| Param | Original file | Final file |
|---|---|---|
| Filename | modeM0/AS1A05_046T01_9000002834_19043cztM0_level2.evt | modeM0/AS1A05_046T01_9000002834_19043cztM0_level2_quad_clean.evt |
| Size (bytes) | 2,028,761,280 | 342,123,840 |
| Size | 1.9 GB | 326.3 MB |
| Events in quadrant A | 13,188,503 | 2,133,797 |
| Events in quadrant B | 14,520,068 | 2,160,699 |
| Events in quadrant C | 13,857,313 | 2,096,799 |
| Events in quadrant D | 17,974,659 | 2,035,394 |
| Mode SS | |||
|---|---|---|---|
| Quadrant | BADHDUFLAG | Total packets | Discarded packets |
| A | 0 | 572 | 0 |
| B | 0 | 572 | 0 |
| C | 0 | 572 | 0 |
| D | 0 | 572 | 0 |
| Mode M0 | |||
|---|---|---|---|
| Quadrant | BADHDUFLAG | Total packets | Discarded packets |
| A | 0 | 57884 | 5 |
| B | 0 | 61369 | 5 |
| C | 0 | 58347 | 5 |
| D | 0 | 72486 | 5 |
| Mode M9 | |||
|---|---|---|---|
| Quadrant | BADHDUFLAG | Total packets | Discarded packets |
| A | 0 | 22 | 0 |
| B | 0 | 22 | 0 |
| C | 0 | 22 | 0 |
| D | 0 | 22 | 0 |
| Quadrant | Total seconds | Saturated seconds | Saturation percentage |
|---|---|---|---|
| A | 28153 | 346 | 1.228999% |
| B | 28153 | 462 | 1.641033% |
| C | 28153 | 420 | 1.491848% |
| D | 28152 | 1425 | 5.061807% |
Noise dominated data is calculated using 1-second bins in cleaned event files. If a bin has >2000 counts, and if more than 50% of those come from <1% of pixels, then it is considered to be noise-dominated and hence unusable.
| Quadrant | # 1 sec bins | Bins with >0 counts | Bins with >2000 counts | High rate bins dominated by noise | Noise dominated (total time) | Noise dominated (detector-on time) | Marked lightcurve |
|---|---|---|---|---|---|---|---|
| A | 32206 | 28159 | 7 | 7 | 0.02% | 0.02% | 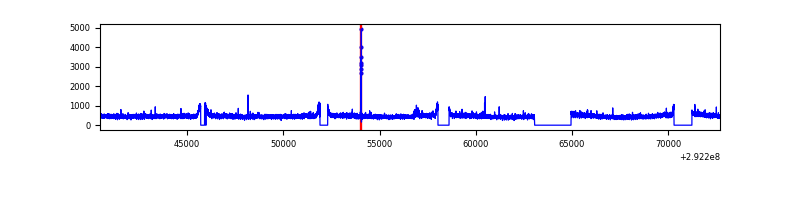 |
| B | 32206 | 28159 | 58 | 58 | 0.18% | 0.21% | 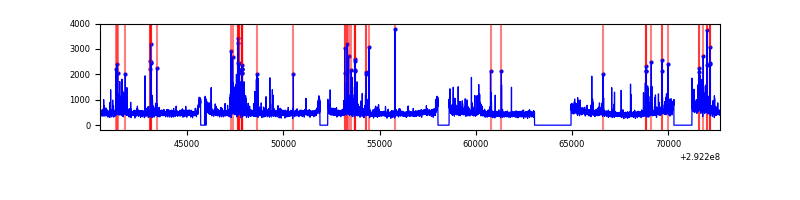 |
| C | 32206 | 28159 | 3 | 3 | 0.01% | 0.01% | 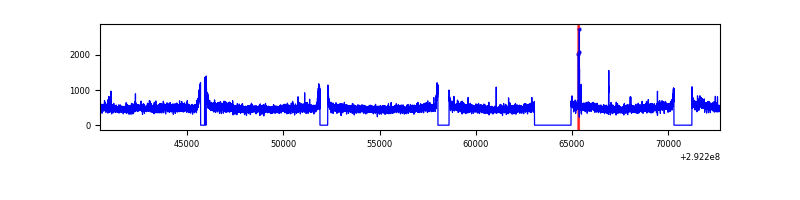 |
| D | 32205 | 28158 | 916 | 916 | 2.84% | 3.25% | 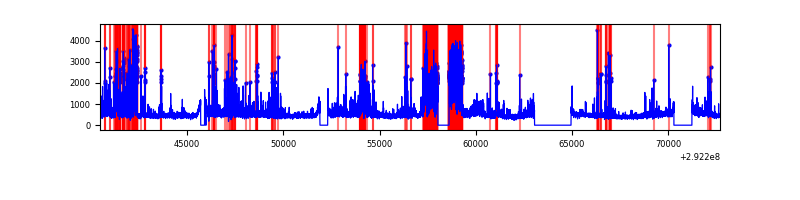 |
Top three noisy pixels from each quadrant. If the there are fewer than three noisy pixels in the level2.evt file, extra rows are filled as -1
| Pixel properties | Quadrant properties | ||||||
|---|---|---|---|---|---|---|---|
| Quadrant | DetID | PixID | Counts | Sigma | Mean | Median | Sigma |
| A | 9 | 143 | 55682 | 76.25 | 3397 | 3322 | 686.7 |
| A | 8 | 144 | 54432 | 74.43 | 3397 | 3322 | 686.7 |
| A | 13 | 254 | 33041 | 43.28 | 3397 | 3322 | 686.7 |
| B | 7 | 220 | 444668 | 675.97 | 3398 | 3310 | 652.9 |
| B | 3 | 112 | 326685 | 495.27 | 3398 | 3310 | 652.9 |
| B | 0 | 189 | 159532 | 239.26 | 3398 | 3310 | 652.9 |
| C | 14 | 238 | 503937 | 648.63 | 3282 | 3307 | 771.8 |
| C | 3 | 233 | 372069 | 477.78 | 3282 | 3307 | 771.8 |
| C | 9 | 15 | 194690 | 247.96 | 3282 | 3307 | 771.8 |
| D | 7 | 238 | 5279334 | 6644.32 | 3256 | 3162 | 794.1 |
| D | 2 | 234 | 131781 | 161.97 | 3256 | 3162 | 794.1 |
| D | 11 | 176 | 123489 | 151.53 | 3256 | 3162 | 794.1 |
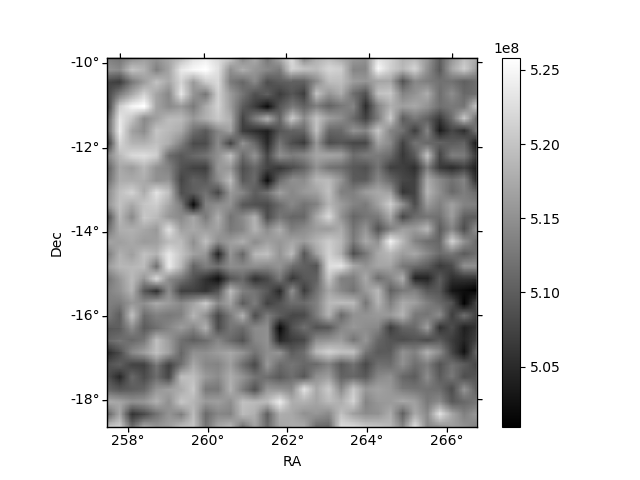
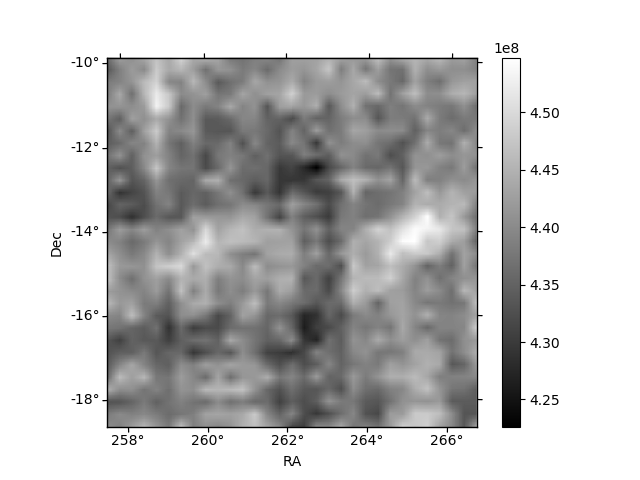
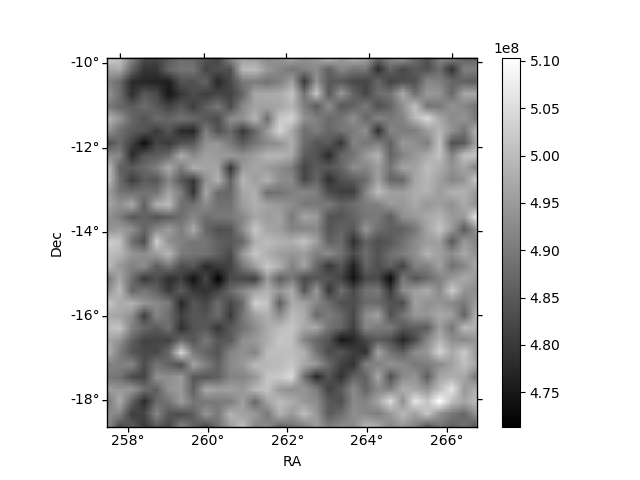
Histogram calculated using DETX and DETY for each event in the final _common_clean file
| Quadrant A | 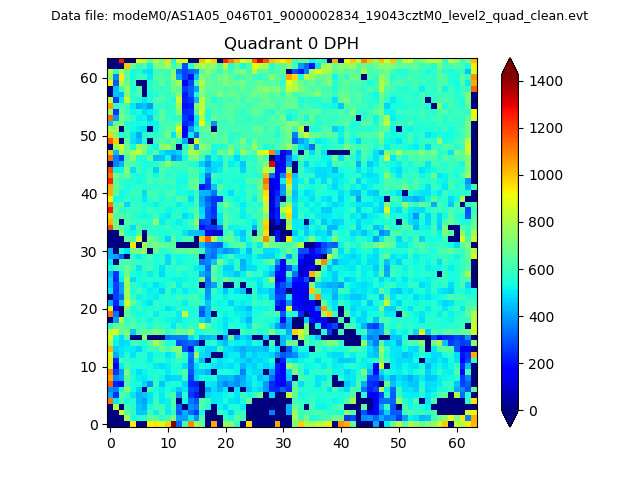 |
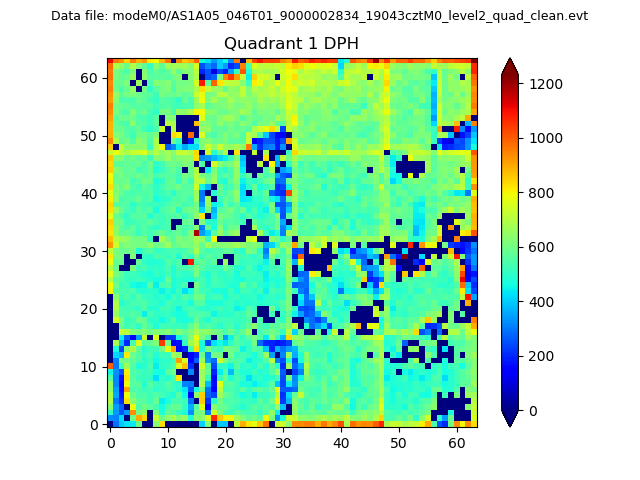 |
Quadrant B |
|---|---|---|---|
| Quadrant D |  |
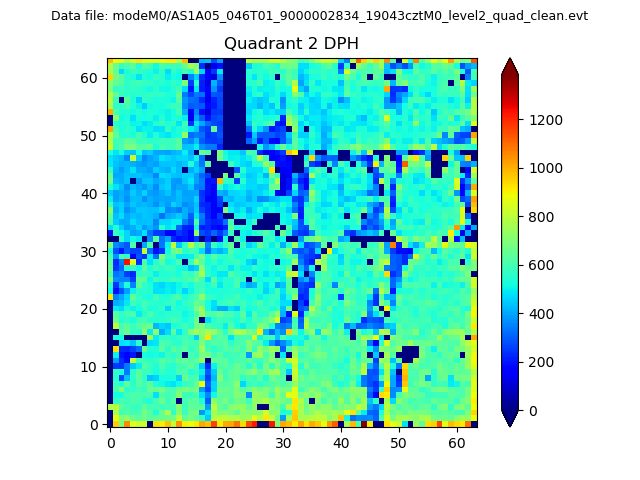 |
Quadrant C |
| Plot type | Count rate plots | Images |
|---|---|---|
| Comparison with Poisson distribution Blue bars denote a histogram of data divided into 1 sec bins. Red curve is a Poisson curve with rate = median count rate of data. |
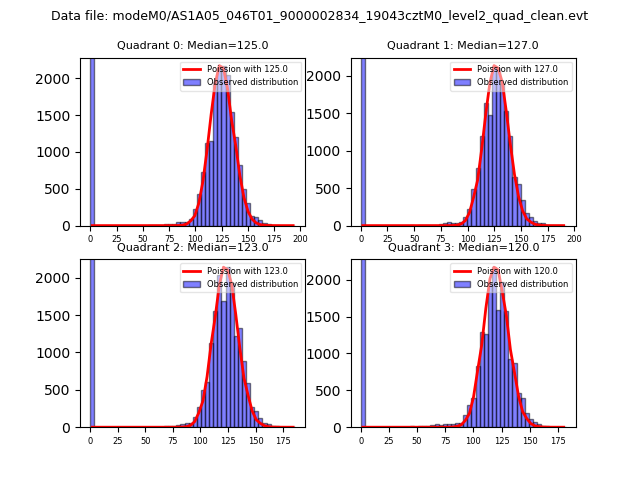 |
 |
| Quadrant-wise count rates Data is divided into 100 sec bins |
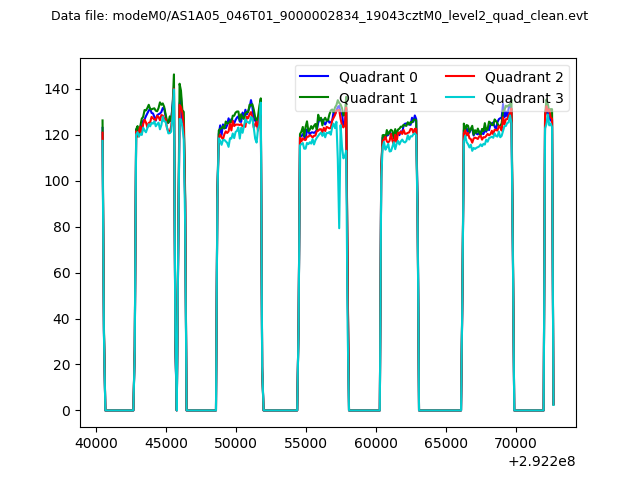 |
|
| Module-wise count rates for Quadrant A Data is divided into 100 sec bins |
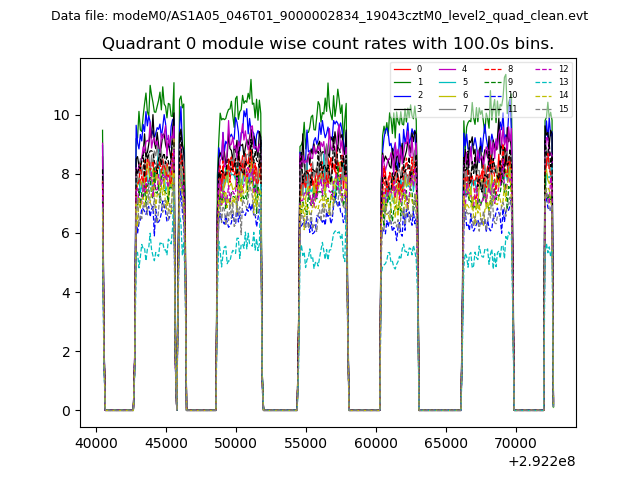 |
 |
| Module-wise count rates for Quadrant B Data is divided into 100 sec bins |
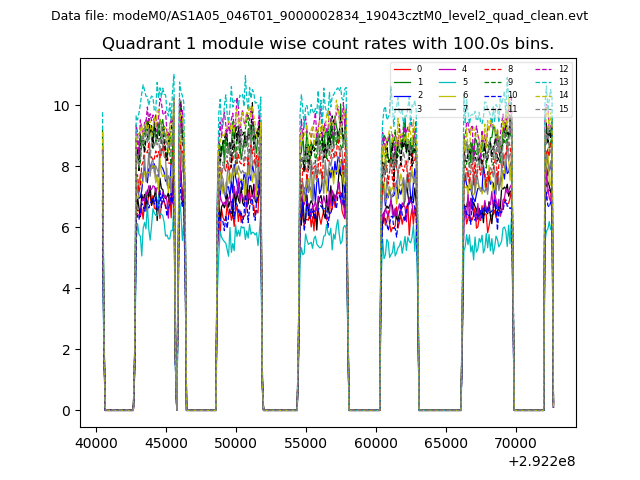 |
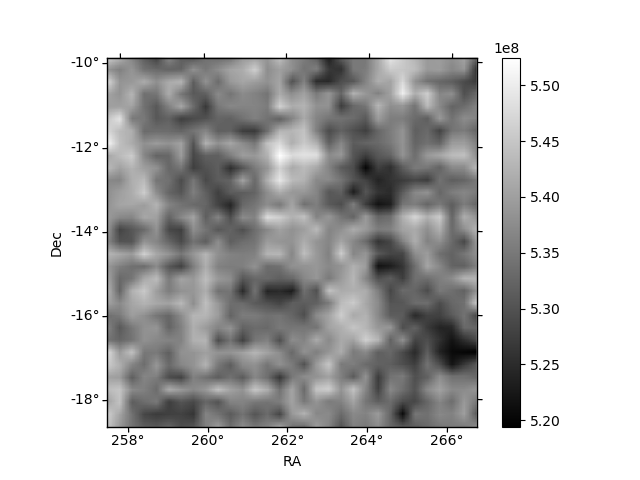 |
| Module-wise count rates for Quadrant C Data is divided into 100 sec bins |
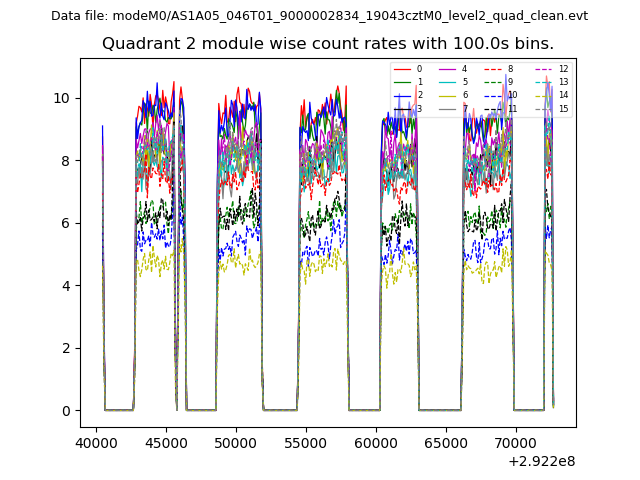 |
 |
| Module-wise count rates for Quadrant D Data is divided into 100 sec bins |
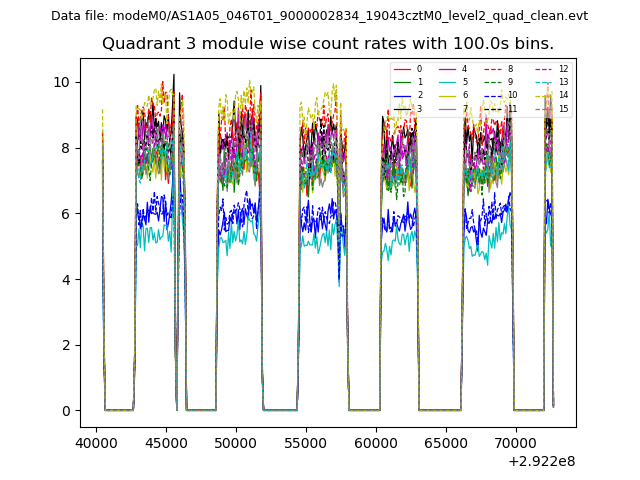 |
 |
| Parameter | Plot |
|---|---|
| CZT HV Monitor | 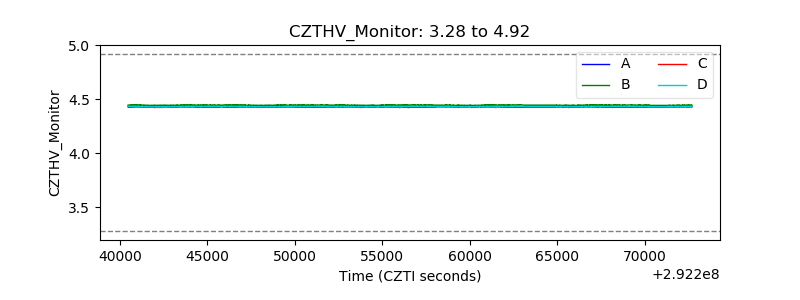 |
| D_VDD | 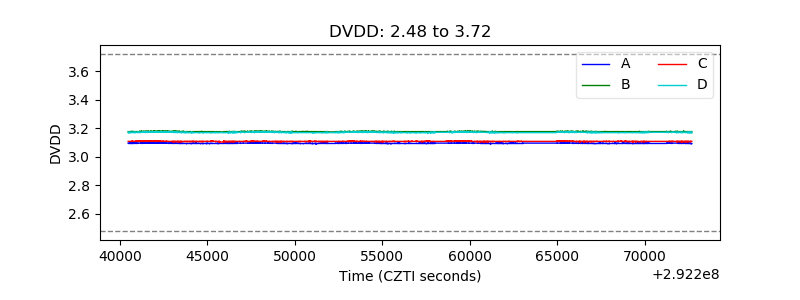 |
| Temperature 1 | 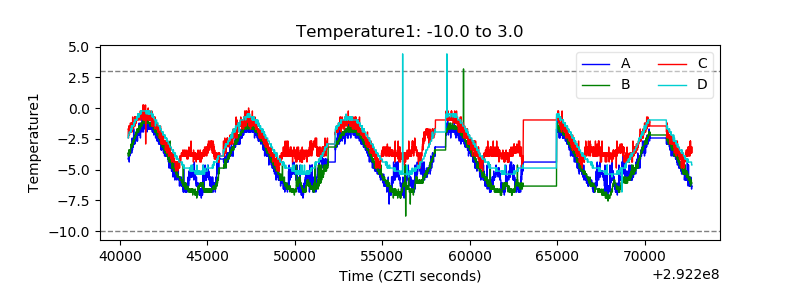 |
| Veto HV Monitor | 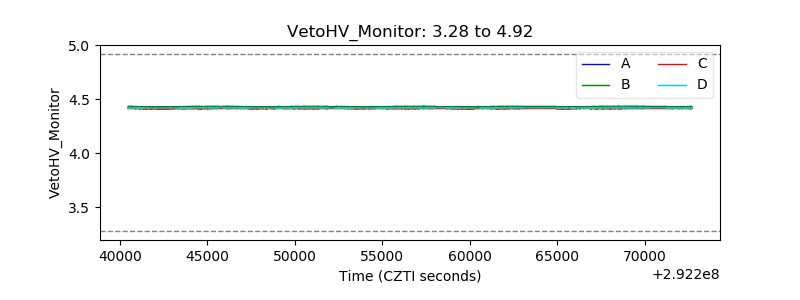 |
| Veto LLD | 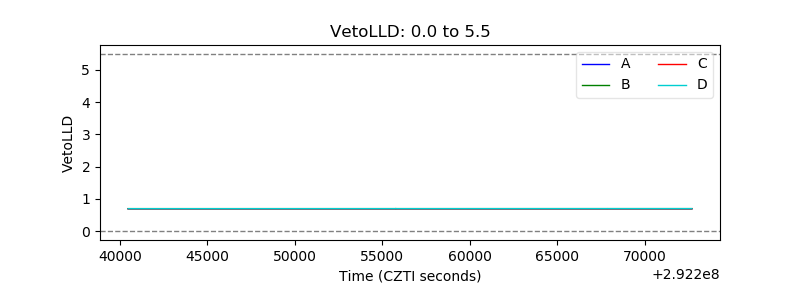 |
| Alpha Counter | 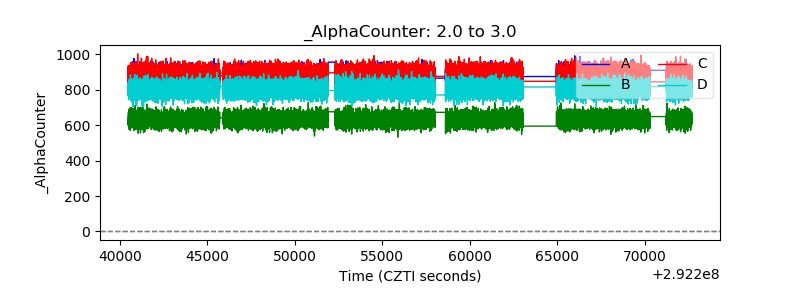 |
| _CPM_Rate |  |
| CZT Counter | 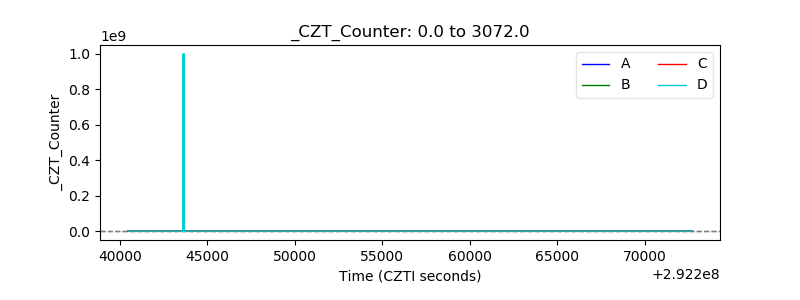 |
| +2.5 Volts monitor |  |
| +5 Volts monitor |  |
| _ROLL_ROT | 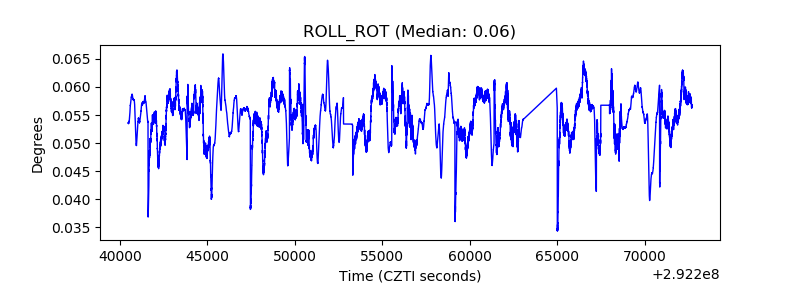 |
| _Roll_DEC | 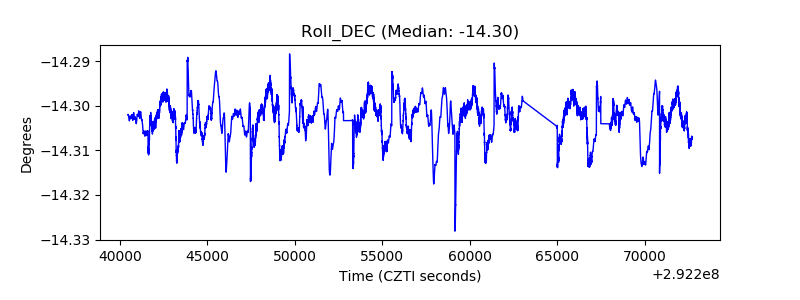 |
| _Roll_RA | 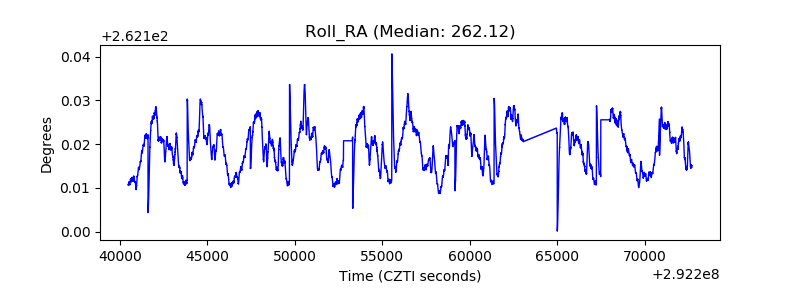 |
| Veto Counter | 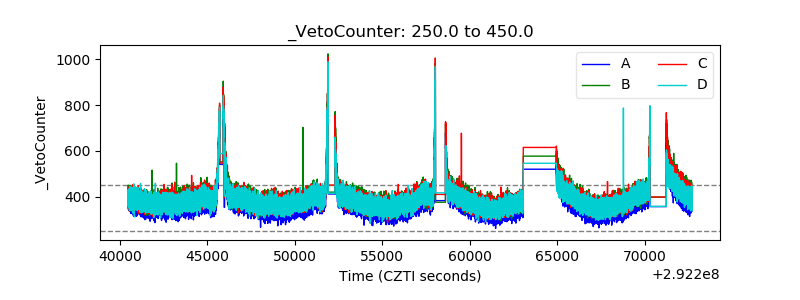 |