| Param | Original file | Final file |
|---|---|---|
| Filename | modeM0/AS1A05_046T01_9000002834_19045cztM0_level2.evt | modeM0/AS1A05_046T01_9000002834_19045cztM0_level2_quad_clean.evt |
| Size (bytes) | 506,773,440 | 93,718,080 |
| Size | 483.3 MB | 89.4 MB |
| Events in quadrant A | 3,414,965 | 590,148 |
| Events in quadrant B | 3,816,407 | 605,688 |
| Events in quadrant C | 3,588,407 | 586,514 |
| Events in quadrant D | 4,051,543 | 566,833 |
| Mode SS | |||
|---|---|---|---|
| Quadrant | BADHDUFLAG | Total packets | Discarded packets |
| A | 0 | 144 | 0 |
| B | 0 | 144 | 0 |
| C | 0 | 144 | 0 |
| D | 0 | 144 | 0 |
| Mode M0 | |||
|---|---|---|---|
| Quadrant | BADHDUFLAG | Total packets | Discarded packets |
| A | 0 | 14611 | 2 |
| B | 0 | 15984 | 2 |
| C | 0 | 14984 | 2 |
| D | 0 | 16839 | 2 |
| Mode M9 | |||
|---|---|---|---|
| Quadrant | BADHDUFLAG | Total packets | Discarded packets |
| A | 0 | 20 | 0 |
| B | 0 | 20 | 0 |
| C | 0 | 20 | 0 |
| D | 0 | 20 | 0 |
| Quadrant | Total seconds | Saturated seconds | Saturation percentage |
|---|---|---|---|
| A | 7020 | 55 | 0.783476% |
| B | 7021 | 125 | 1.780373% |
| C | 7021 | 84 | 1.196411% |
| D | 7021 | 75 | 1.068224% |
Noise dominated data is calculated using 1-second bins in cleaned event files. If a bin has >2000 counts, and if more than 50% of those come from <1% of pixels, then it is considered to be noise-dominated and hence unusable.
| Quadrant | # 1 sec bins | Bins with >0 counts | Bins with >2000 counts | High rate bins dominated by noise | Noise dominated (total time) | Noise dominated (detector-on time) | Marked lightcurve |
|---|---|---|---|---|---|---|---|
| A | 9065 | 7022 | 0 | 0 | 0.00% | 0.00% | 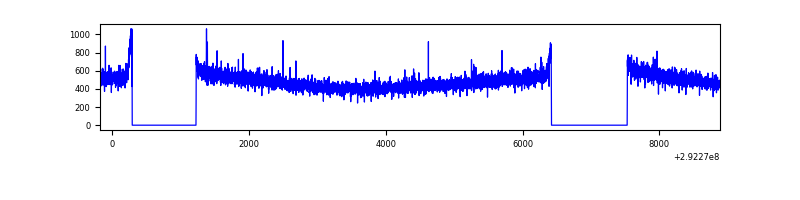 |
| B | 9066 | 7023 | 13 | 13 | 0.14% | 0.19% | 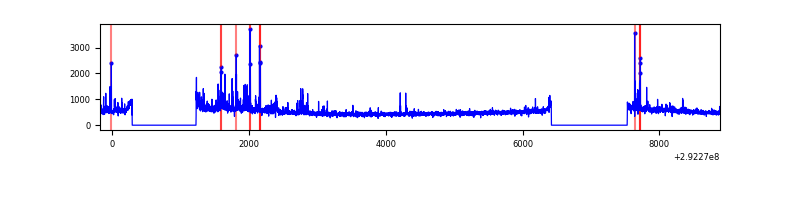 |
| C | 9066 | 7023 | 0 | 0 | 0.00% | 0.00% | 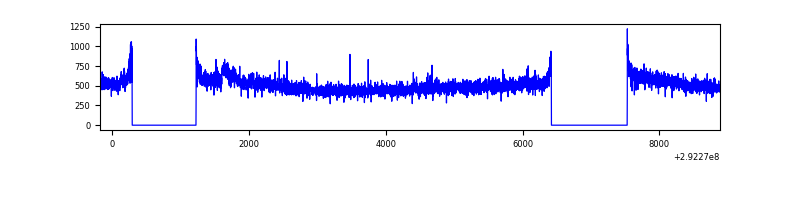 |
| D | 9066 | 7023 | 12 | 12 | 0.13% | 0.17% | 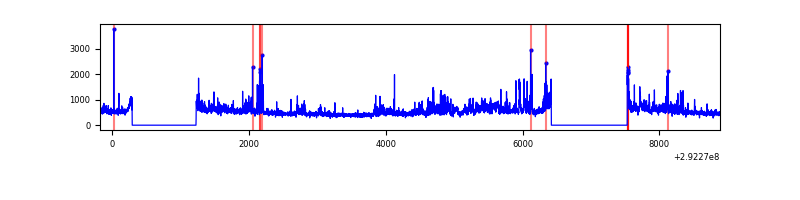 |
Top three noisy pixels from each quadrant. If the there are fewer than three noisy pixels in the level2.evt file, extra rows are filled as -1
| Pixel properties | Quadrant properties | ||||||
|---|---|---|---|---|---|---|---|
| Quadrant | DetID | PixID | Counts | Sigma | Mean | Median | Sigma |
| A | 8 | 6 | 9992 | 50.76 | 884 | 864 | 179.8 |
| A | 13 | 254 | 9174 | 46.21 | 884 | 864 | 179.8 |
| A | 0 | 226 | 7768 | 38.4 | 884 | 864 | 179.8 |
| B | 3 | 112 | 197343 | 1149.37 | 888 | 867 | 170.9 |
| B | 0 | 189 | 50566 | 290.74 | 888 | 867 | 170.9 |
| B | 0 | 197 | 32735 | 186.43 | 888 | 867 | 170.9 |
| C | 14 | 238 | 131975 | 650.63 | 855 | 863 | 201.5 |
| C | 3 | 233 | 89346 | 439.09 | 855 | 863 | 201.5 |
| C | 9 | 15 | 35635 | 172.55 | 855 | 863 | 201.5 |
| D | 7 | 238 | 750305 | 3557.88 | 860 | 836 | 210.7 |
| D | 2 | 234 | 29656 | 136.81 | 860 | 836 | 210.7 |
| D | 7 | 38 | 14612 | 65.4 | 860 | 836 | 210.7 |
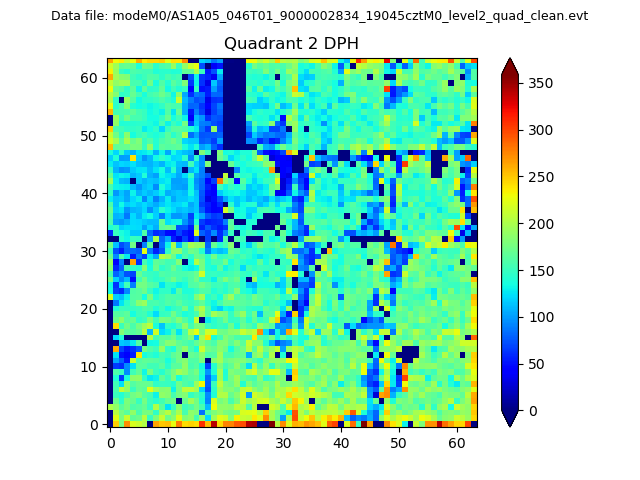
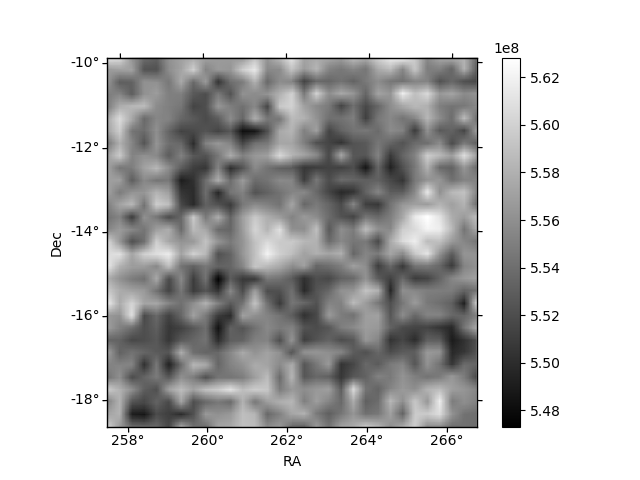
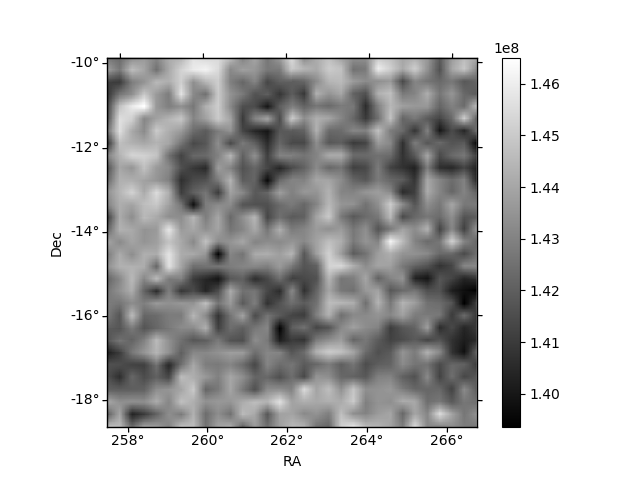
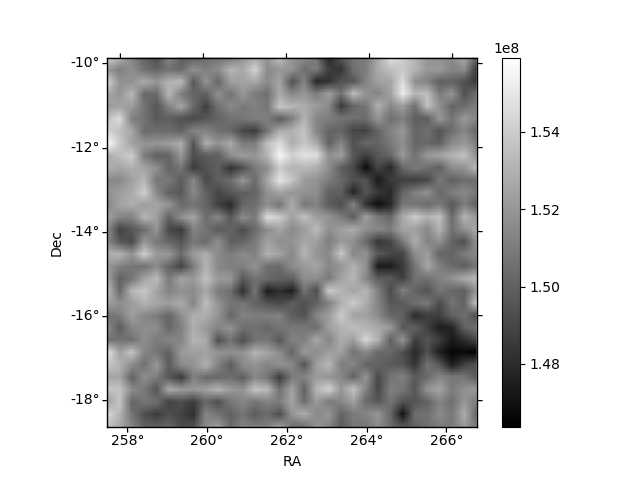
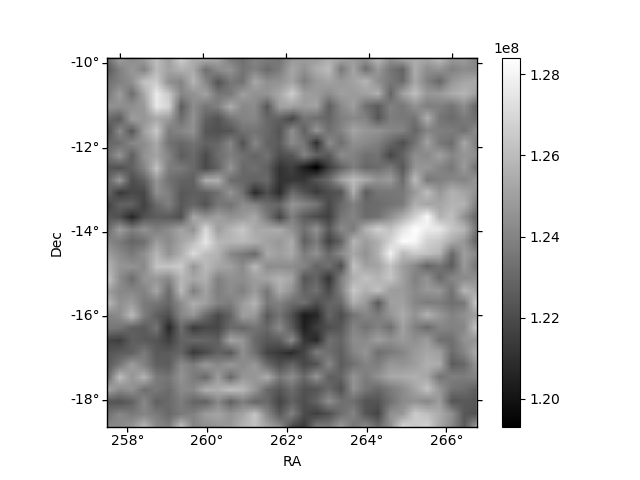
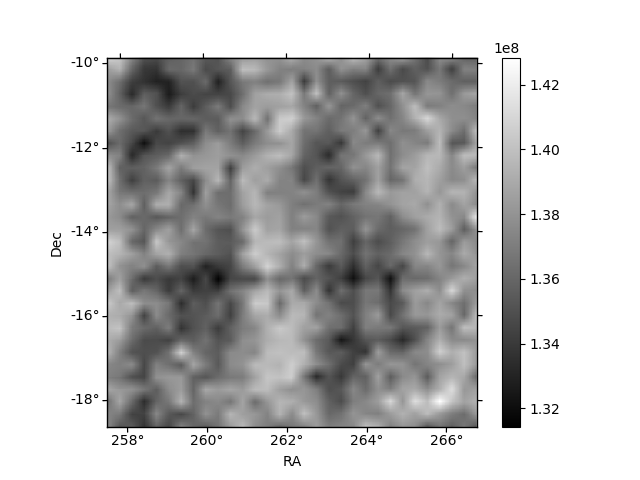
Histogram calculated using DETX and DETY for each event in the final _common_clean file
| Quadrant A | 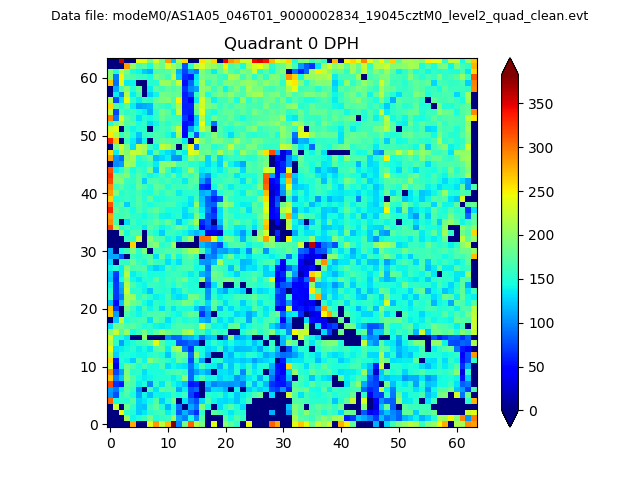 |
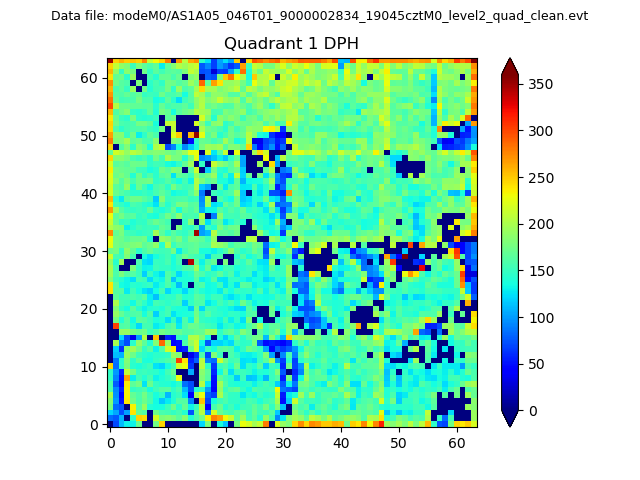 |
Quadrant B |
|---|---|---|---|
| Quadrant D | 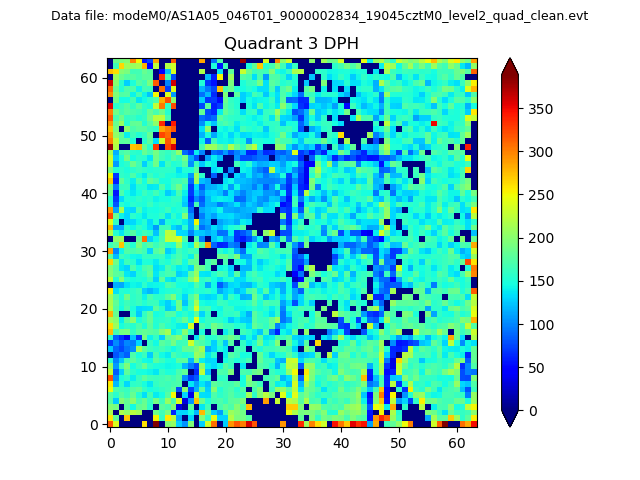 |
 |
Quadrant C |
| Plot type | Count rate plots | Images |
|---|---|---|
| Comparison with Poisson distribution Blue bars denote a histogram of data divided into 1 sec bins. Red curve is a Poisson curve with rate = median count rate of data. |
 |
 |
| Quadrant-wise count rates Data is divided into 100 sec bins |
 |
|
| Module-wise count rates for Quadrant A Data is divided into 100 sec bins |
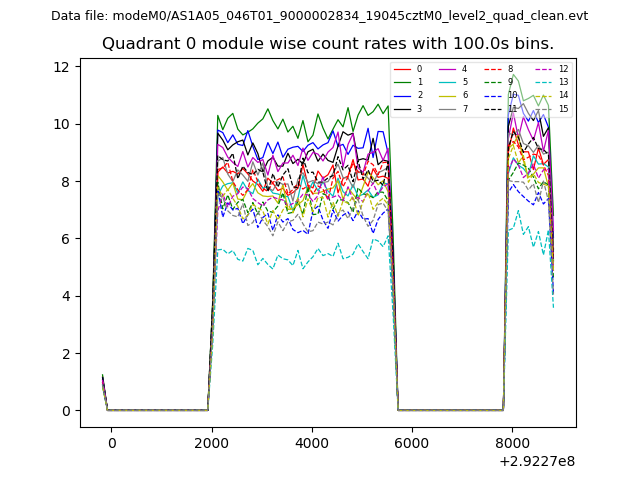 |
 |
| Module-wise count rates for Quadrant B Data is divided into 100 sec bins |
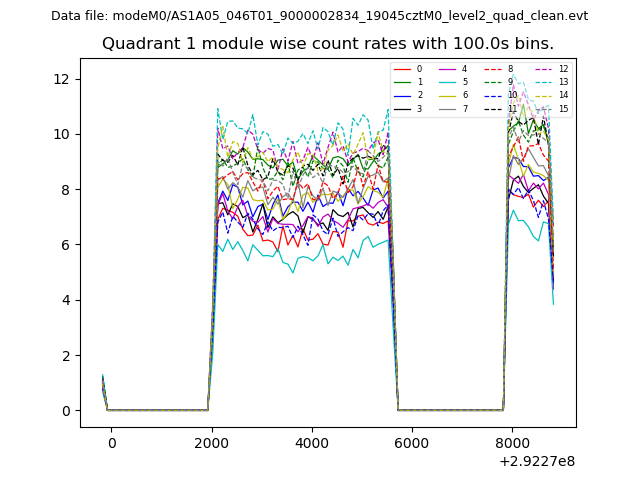 |
 |
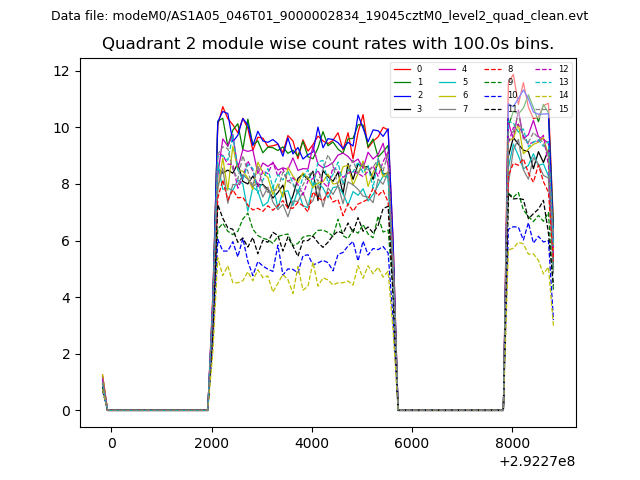
| Module-wise count rates for Quadrant C Data is divided into 100 sec bins |
 |
 |
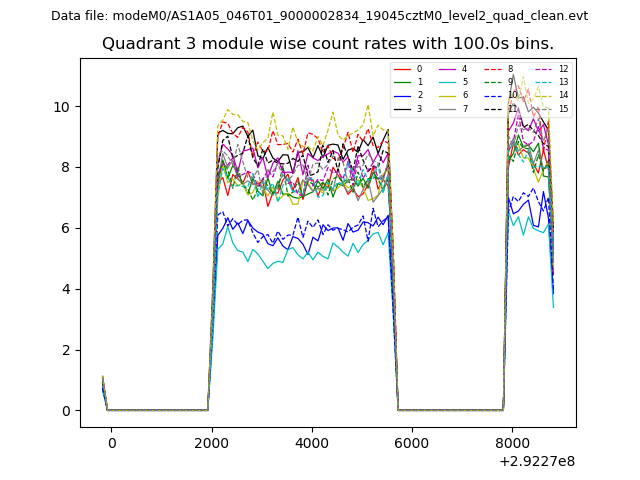
| Module-wise count rates for Quadrant D Data is divided into 100 sec bins |
 |
 |
| Parameter | Plot |
|---|---|
| CZT HV Monitor | 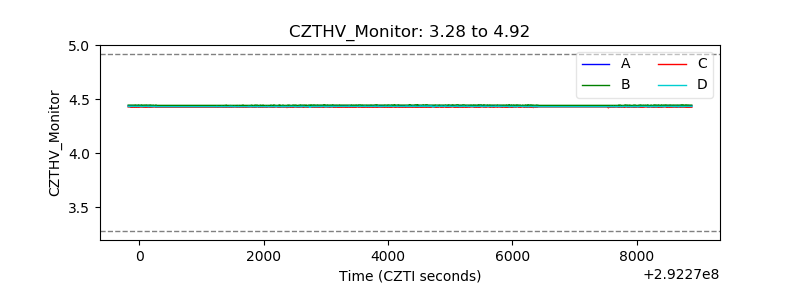 |
| D_VDD | 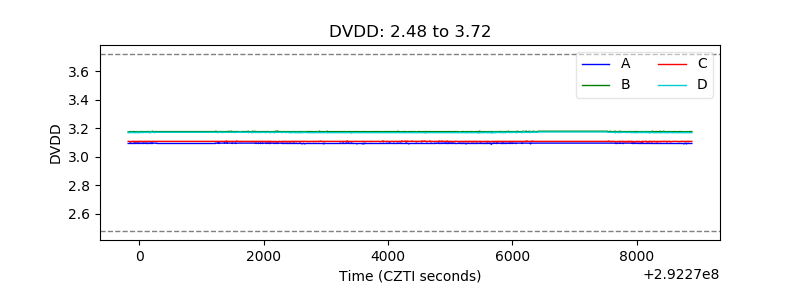 |
| Temperature 1 | 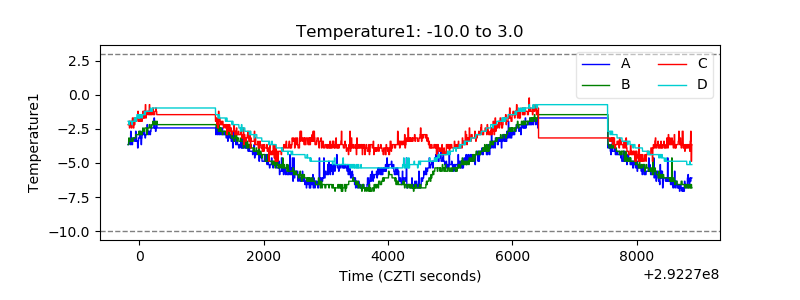 |
| Veto HV Monitor | 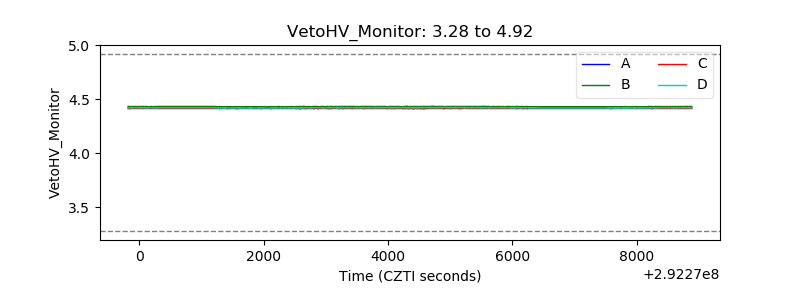 |
| Veto LLD | 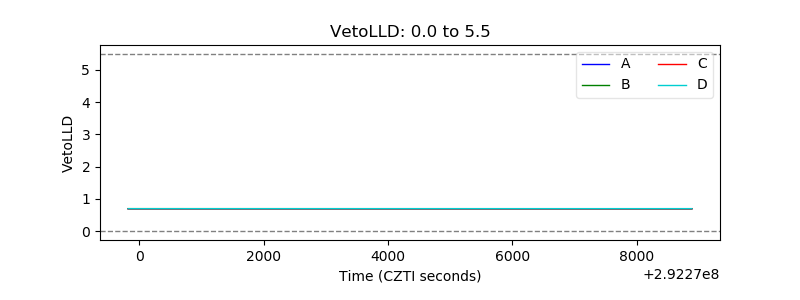 |
| Alpha Counter | 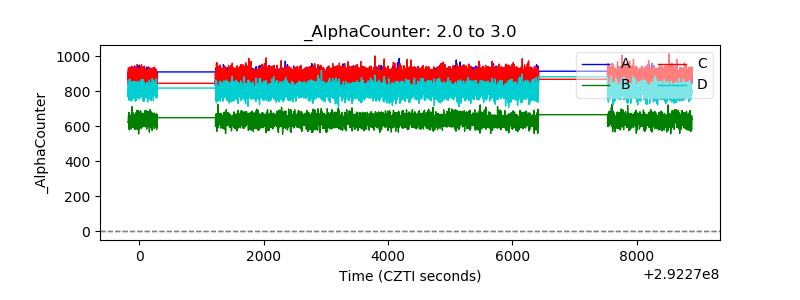 |
| _CPM_Rate |  |
| CZT Counter | 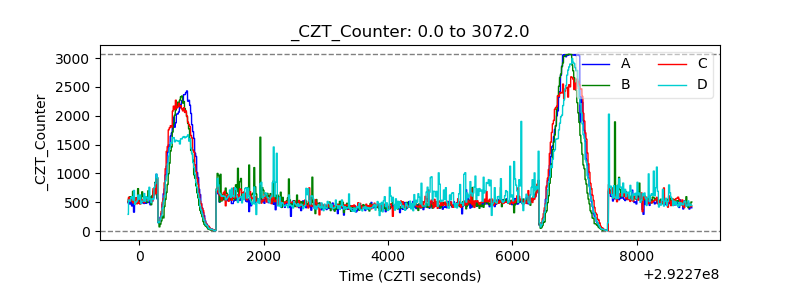 |
| +2.5 Volts monitor |  |
| +5 Volts monitor |  |
| _ROLL_ROT | 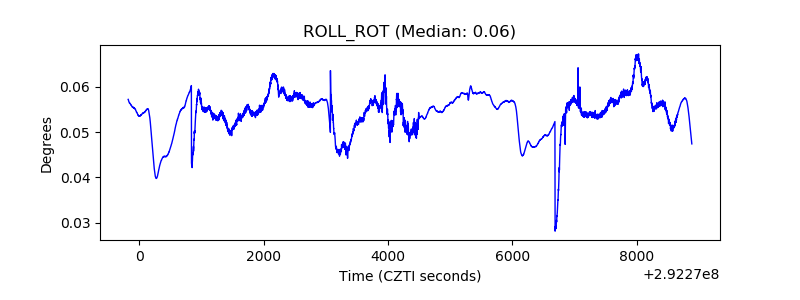 |
| _Roll_DEC | 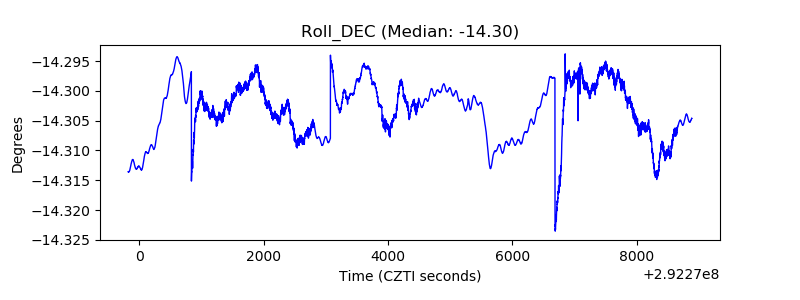 |
| _Roll_RA | 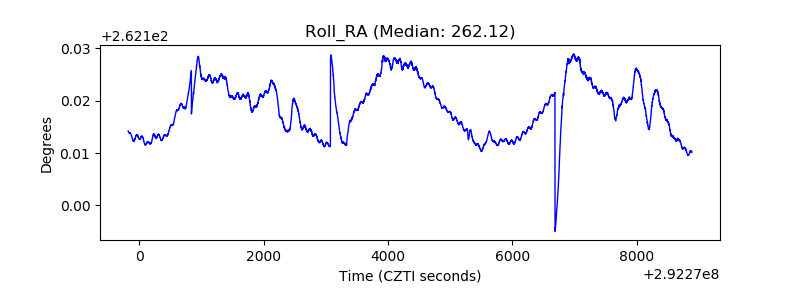 |
| Veto Counter | 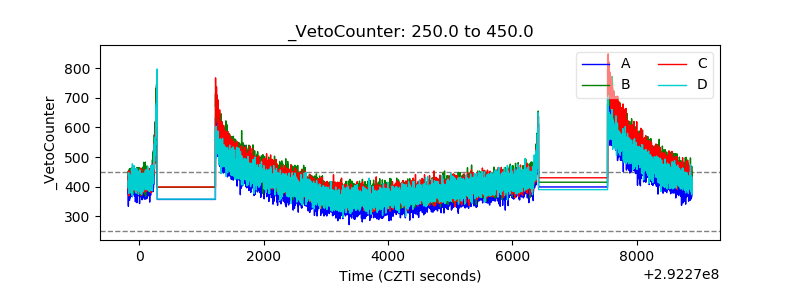 |