| Param | Original file | Final file |
|---|---|---|
| Filename | modeM0/AS1A05_046T01_9000002834_19046cztM0_level2.evt | modeM0/AS1A05_046T01_9000002834_19046cztM0_level2_quad_clean.evt |
| Size (bytes) | 467,199,360 | 103,740,480 |
| Size | 445.6 MB | 98.9 MB |
| Events in quadrant A | 3,125,353 | 676,526 |
| Events in quadrant B | 3,376,508 | 701,363 |
| Events in quadrant C | 3,436,119 | 675,222 |
| Events in quadrant D | 3,783,494 | 649,281 |
| Mode SS | |||
|---|---|---|---|
| Quadrant | BADHDUFLAG | Total packets | Discarded packets |
| A | 0 | 128 | 0 |
| B | 0 | 128 | 0 |
| C | 0 | 128 | 0 |
| D | 0 | 128 | 0 |
| Mode M0 | |||
|---|---|---|---|
| Quadrant | BADHDUFLAG | Total packets | Discarded packets |
| A | 0 | 13342 | 2 |
| B | 0 | 14142 | 2 |
| C | 0 | 14232 | 2 |
| D | 0 | 15626 | 3 |
| Mode M9 | |||
|---|---|---|---|
| Quadrant | BADHDUFLAG | Total packets | Discarded packets |
| A | 0 | 17 | 0 |
| B | 0 | 18 | 0 |
| C | 0 | 18 | 0 |
| D | 0 | 18 | 0 |
| Quadrant | Total seconds | Saturated seconds | Saturation percentage |
|---|---|---|---|
| A | 6299 | 20 | 0.317511% |
| B | 6299 | 95 | 1.508176% |
| C | 6299 | 51 | 0.809652% |
| D | 6298 | 82 | 1.302001% |
Noise dominated data is calculated using 1-second bins in cleaned event files. If a bin has >2000 counts, and if more than 50% of those come from <1% of pixels, then it is considered to be noise-dominated and hence unusable.
| Quadrant | # 1 sec bins | Bins with >0 counts | Bins with >2000 counts | High rate bins dominated by noise | Noise dominated (total time) | Noise dominated (detector-on time) | Marked lightcurve |
|---|---|---|---|---|---|---|---|
| A | 7514 | 6300 | 3 | 3 | 0.04% | 0.05% | 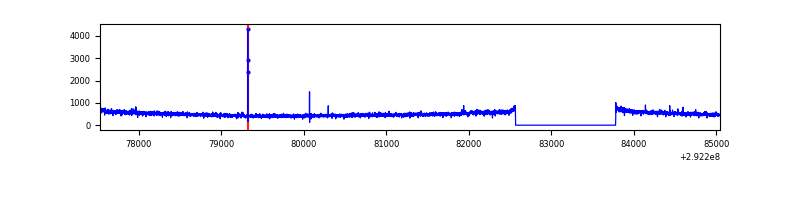 |
| B | 7514 | 6300 | 30 | 30 | 0.40% | 0.48% | 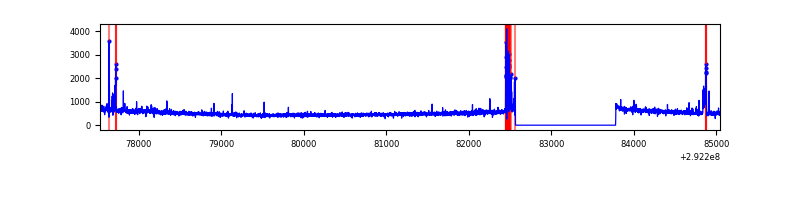 |
| C | 7514 | 6300 | 0 | 0 | 0.00% | 0.00% | 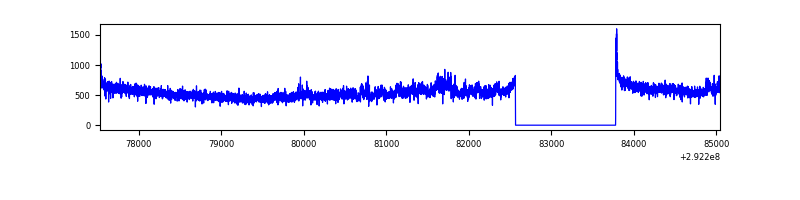 |
| D | 7513 | 6299 | 59 | 59 | 0.79% | 0.94% | 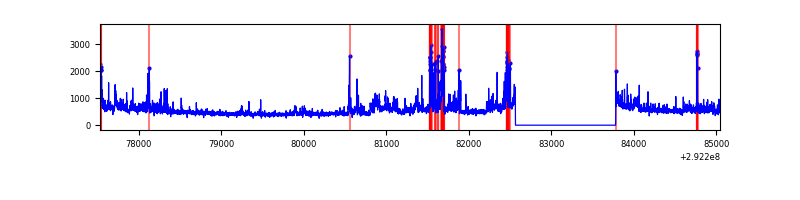 |
Top three noisy pixels from each quadrant. If the there are fewer than three noisy pixels in the level2.evt file, extra rows are filled as -1
| Pixel properties | Quadrant properties | ||||||
|---|---|---|---|---|---|---|---|
| Quadrant | DetID | PixID | Counts | Sigma | Mean | Median | Sigma |
| A | 13 | 210 | 26984 | 161.53 | 801 | 785 | 162.2 |
| A | 14 | 235 | 11083 | 63.49 | 801 | 785 | 162.2 |
| A | 13 | 254 | 8146 | 45.38 | 801 | 785 | 162.2 |
| B | 7 | 220 | 82973 | 535.23 | 808 | 788 | 153.6 |
| B | 3 | 112 | 65574 | 421.92 | 808 | 788 | 153.6 |
| B | 0 | 197 | 27979 | 177.08 | 808 | 788 | 153.6 |
| C | 3 | 233 | 254163 | 1382.41 | 783 | 791 | 183.3 |
| C | 14 | 238 | 122500 | 664.05 | 783 | 791 | 183.3 |
| C | 9 | 15 | 6544 | 31.39 | 783 | 791 | 183.3 |
| D | 7 | 238 | 816168 | 4283.66 | 780 | 761 | 190.4 |
| D | 2 | 234 | 25814 | 131.61 | 780 | 761 | 190.4 |
| D | 7 | 96 | 10813 | 52.81 | 780 | 761 | 190.4 |
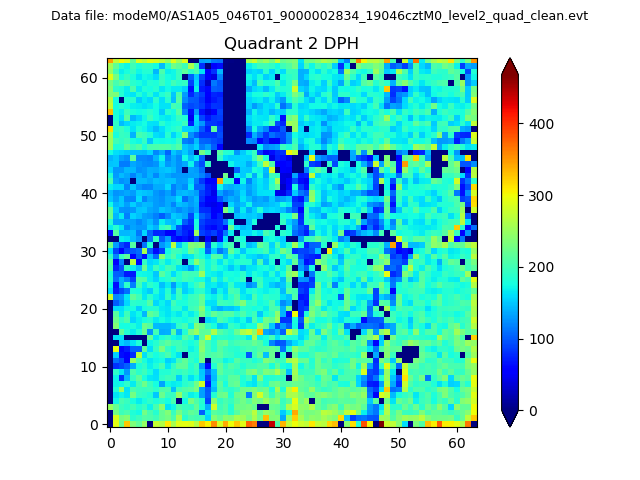
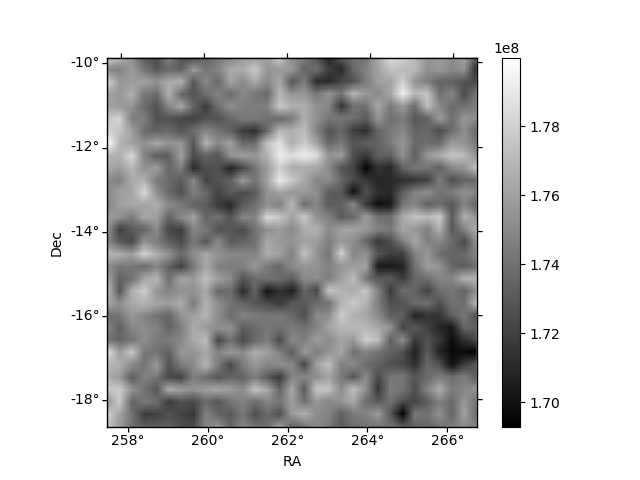
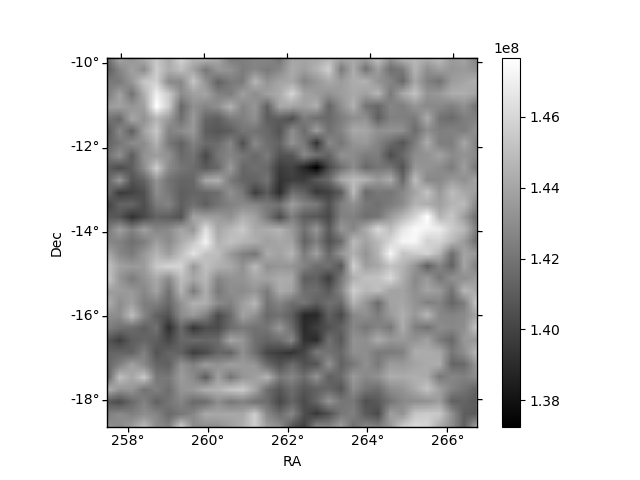
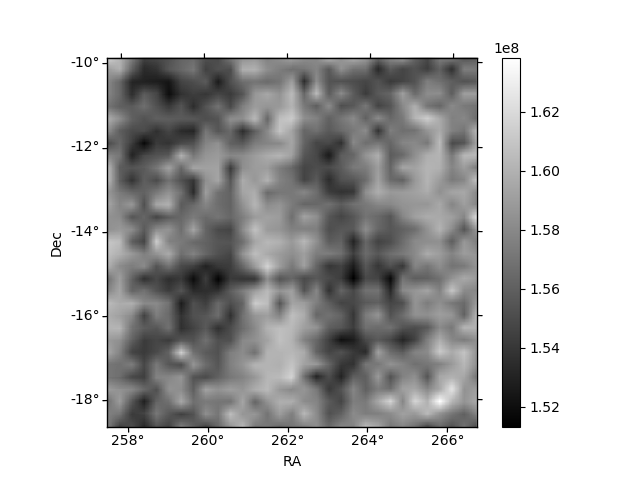
Histogram calculated using DETX and DETY for each event in the final _common_clean file
| Quadrant A | 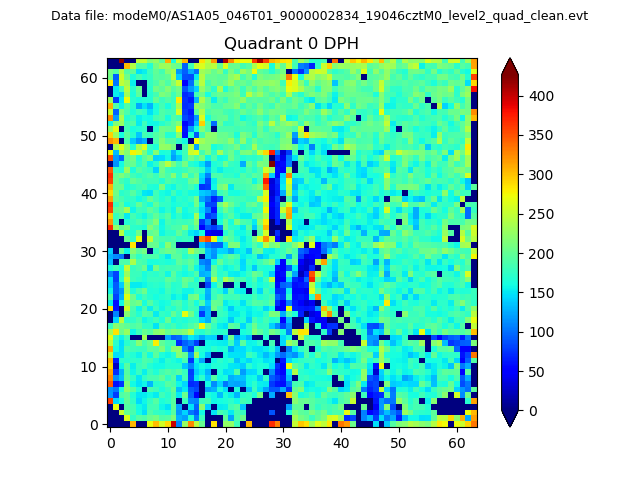 |
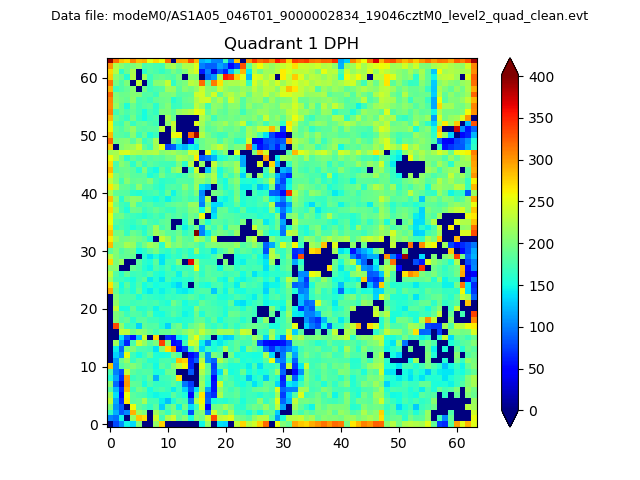 |
Quadrant B |
|---|---|---|---|
| Quadrant D | 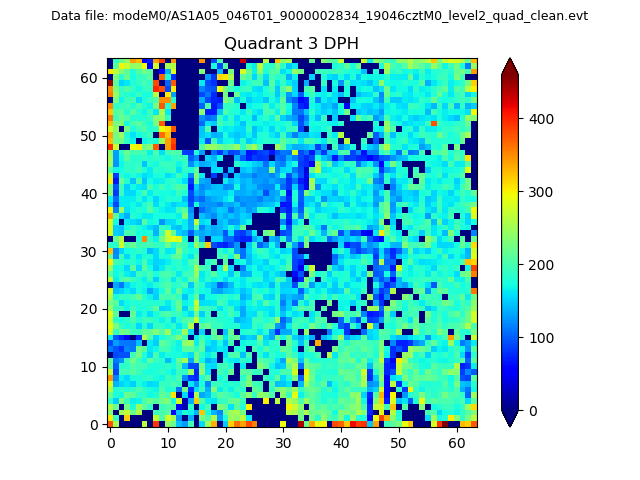 |
 |
Quadrant C |
| Plot type | Count rate plots | Images |
|---|---|---|
| Comparison with Poisson distribution Blue bars denote a histogram of data divided into 1 sec bins. Red curve is a Poisson curve with rate = median count rate of data. |
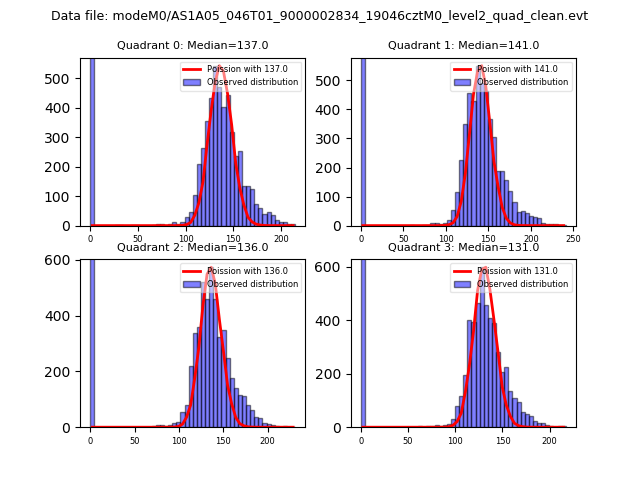 |
 |
| Quadrant-wise count rates Data is divided into 100 sec bins |
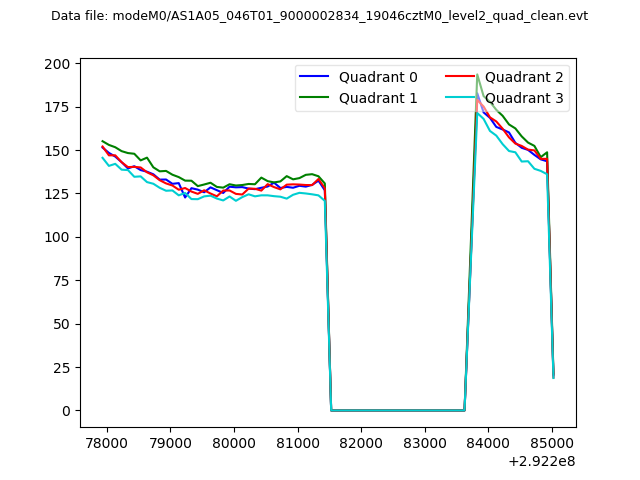 |
|
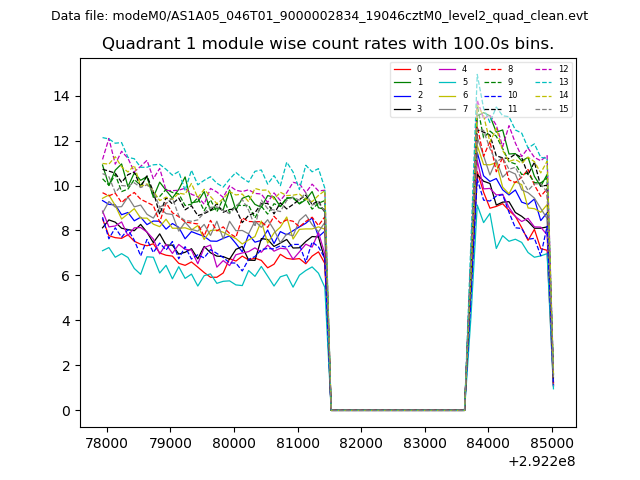
| Module-wise count rates for Quadrant A Data is divided into 100 sec bins |
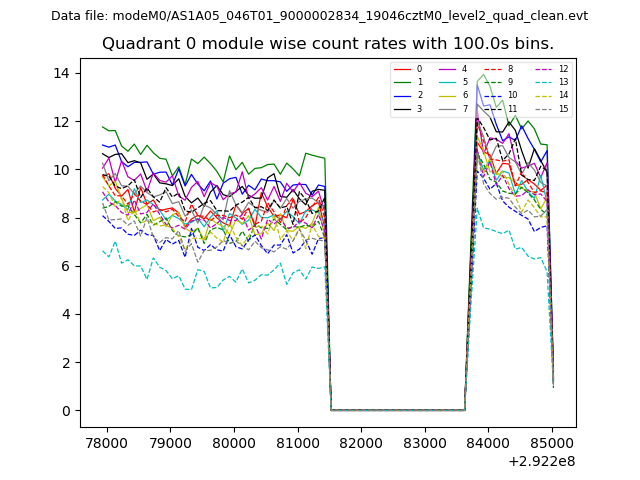 |
 |
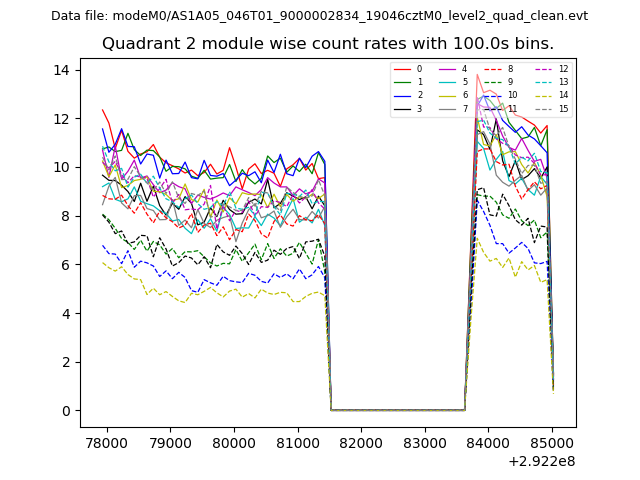
| Module-wise count rates for Quadrant B Data is divided into 100 sec bins |
 |
 |
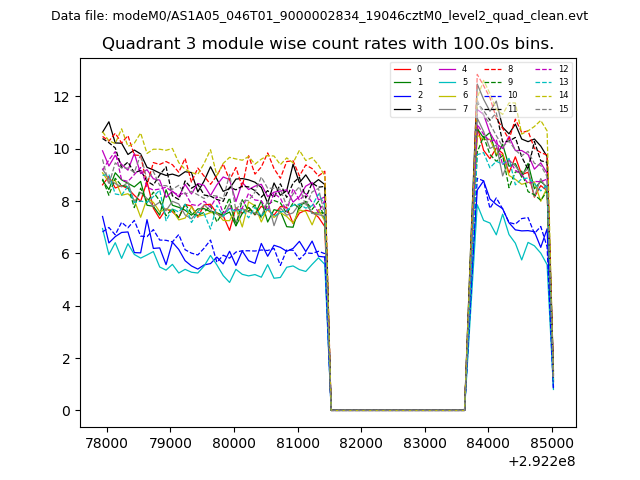
| Module-wise count rates for Quadrant C Data is divided into 100 sec bins |
 |
 |
| Module-wise count rates for Quadrant D Data is divided into 100 sec bins |
 |
 |
| Parameter | Plot |
|---|---|
| CZT HV Monitor | 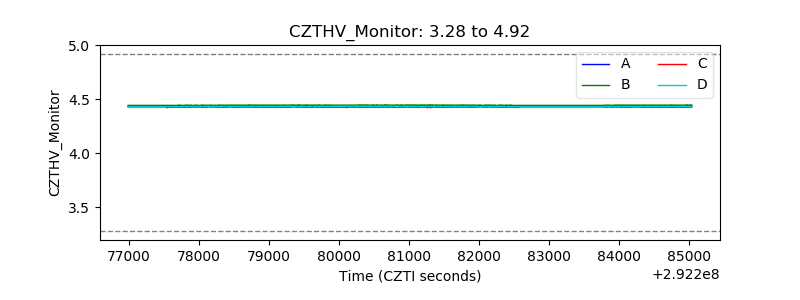 |
| D_VDD | 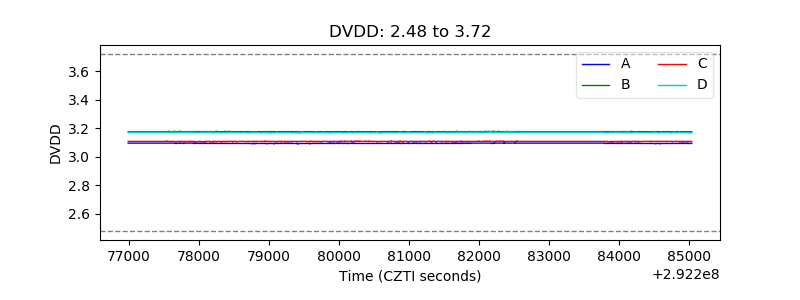 |
| Temperature 1 | 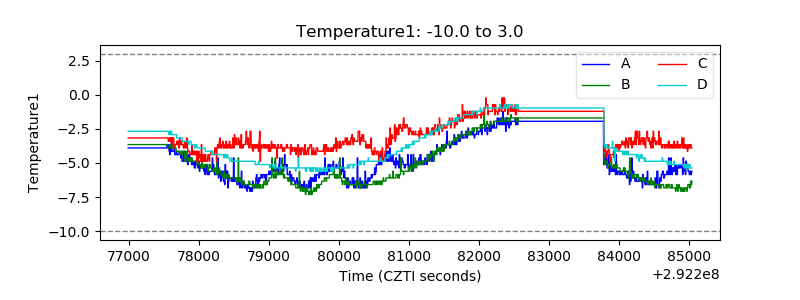 |
| Veto HV Monitor | 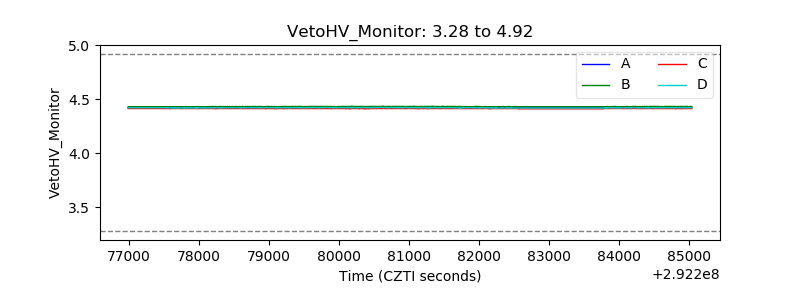 |
| Veto LLD | 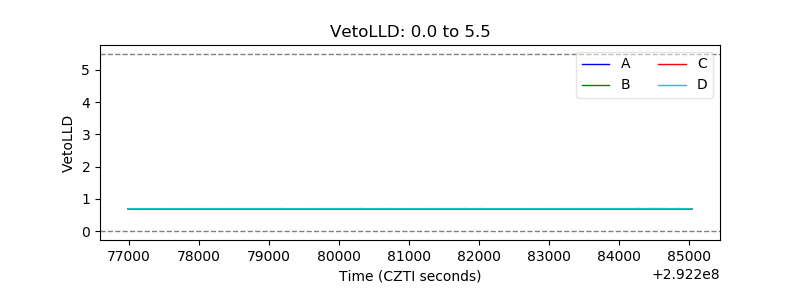 |
| Alpha Counter | 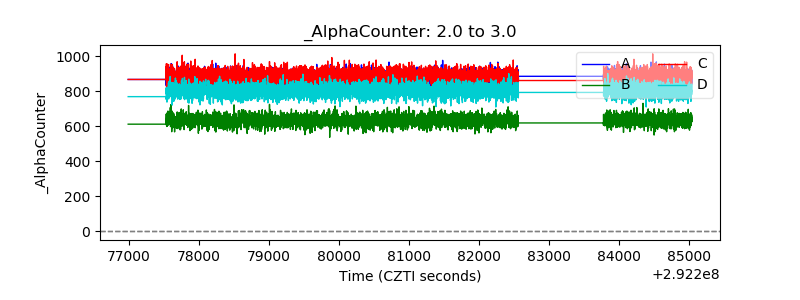 |
| _CPM_Rate | 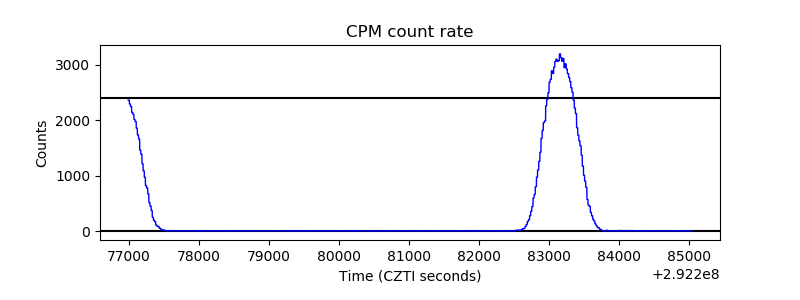 |
| CZT Counter | 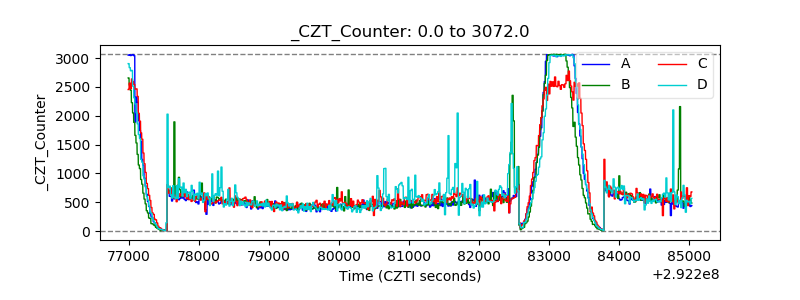 |
| +2.5 Volts monitor |  |
| +5 Volts monitor |  |
| _ROLL_ROT | 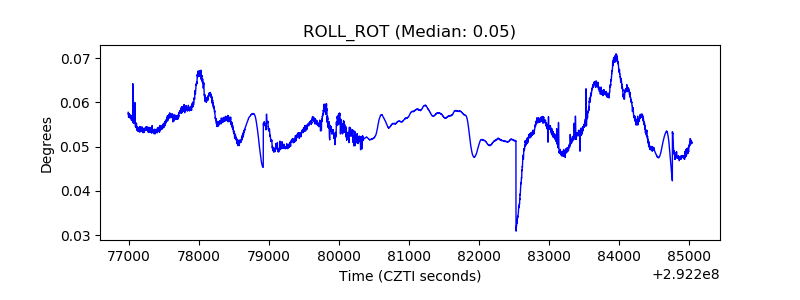 |
| _Roll_DEC | 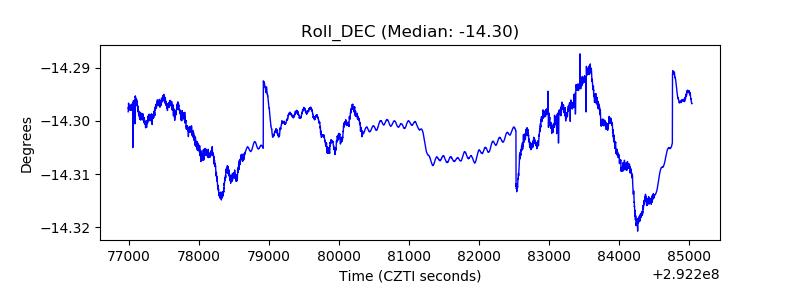 |
| _Roll_RA | 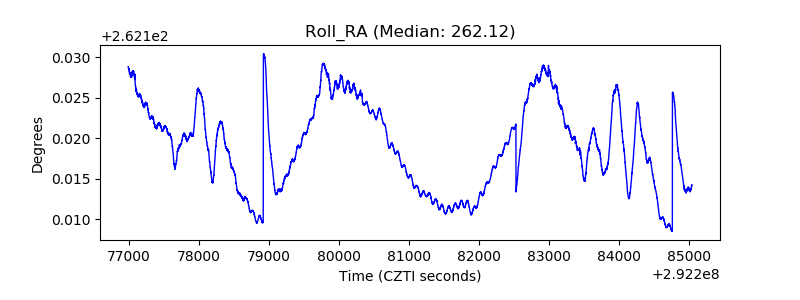 |
| Veto Counter | 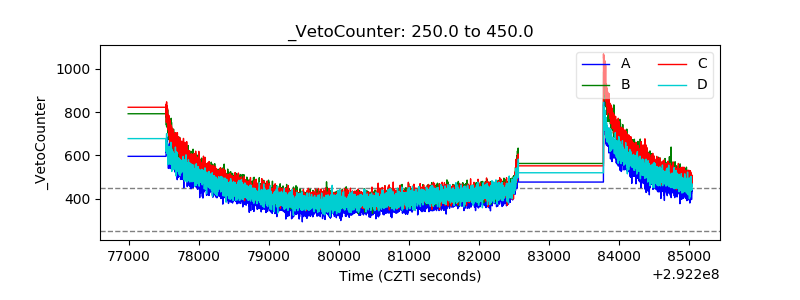 |