| Param | Original file | Final file |
|---|---|---|
| Filename | modeM0/AS1A05_046T01_9000002834_19047cztM0_level2.evt | modeM0/AS1A05_046T01_9000002834_19047cztM0_level2_quad_clean.evt |
| Size (bytes) | 508,913,280 | 110,831,040 |
| Size | 485.3 MB | 105.7 MB |
| Events in quadrant A | 3,176,245 | 733,858 |
| Events in quadrant B | 3,460,859 | 762,843 |
| Events in quadrant C | 3,789,202 | 729,473 |
| Events in quadrant D | 4,559,122 | 690,787 |
| Mode SS | |||
|---|---|---|---|
| Quadrant | BADHDUFLAG | Total packets | Discarded packets |
| A | 0 | 128 | 0 |
| B | 0 | 128 | 0 |
| C | 0 | 128 | 0 |
| D | 0 | 128 | 0 |
| Mode M0 | |||
|---|---|---|---|
| Quadrant | BADHDUFLAG | Total packets | Discarded packets |
| A | 0 | 13365 | 2 |
| B | 0 | 14312 | 2 |
| C | 0 | 15589 | 2 |
| D | 0 | 17684 | 2 |
| Mode M9 | |||
|---|---|---|---|
| Quadrant | BADHDUFLAG | Total packets | Discarded packets |
| A | 0 | 15 | 0 |
| B | 0 | 16 | 0 |
| C | 0 | 16 | 0 |
| D | 0 | 16 | 0 |
| Quadrant | Total seconds | Saturated seconds | Saturation percentage |
|---|---|---|---|
| A | 6302 | 25 | 0.396699% |
| B | 6302 | 70 | 1.110758% |
| C | 6302 | 64 | 1.015551% |
| D | 6302 | 57 | 0.904475% |
Noise dominated data is calculated using 1-second bins in cleaned event files. If a bin has >2000 counts, and if more than 50% of those come from <1% of pixels, then it is considered to be noise-dominated and hence unusable.
| Quadrant | # 1 sec bins | Bins with >0 counts | Bins with >2000 counts | High rate bins dominated by noise | Noise dominated (total time) | Noise dominated (detector-on time) | Marked lightcurve |
|---|---|---|---|---|---|---|---|
| A | 7582 | 6303 | 1 | 1 | 0.01% | 0.02% | 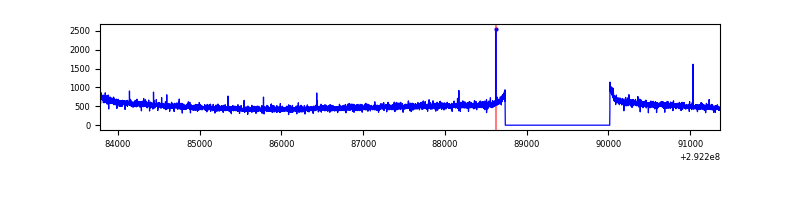 |
| B | 7582 | 6303 | 18 | 18 | 0.24% | 0.29% | 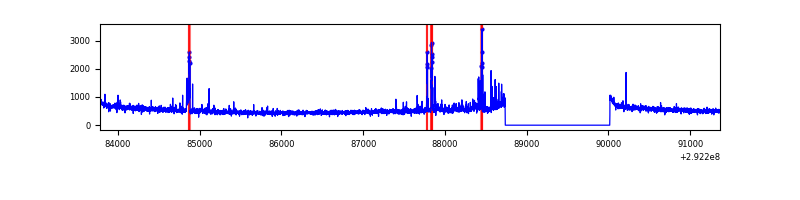 |
| C | 7582 | 6303 | 0 | 0 | 0.00% | 0.00% | 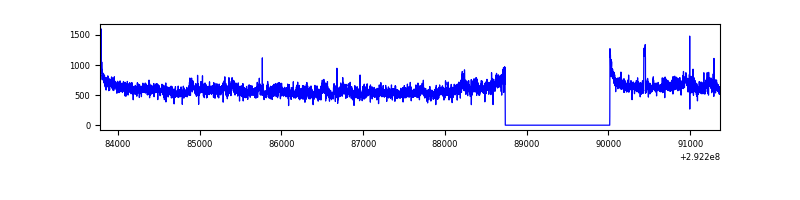 |
| D | 7582 | 6303 | 58 | 58 | 0.76% | 0.92% | 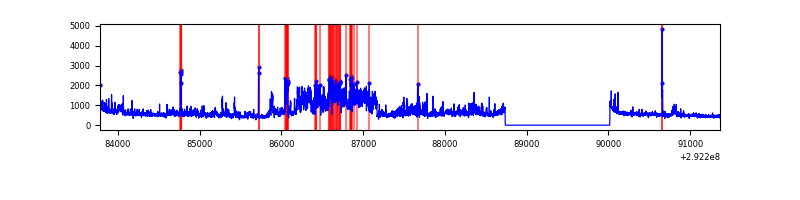 |
Top three noisy pixels from each quadrant. If the there are fewer than three noisy pixels in the level2.evt file, extra rows are filled as -1
| Pixel properties | Quadrant properties | ||||||
|---|---|---|---|---|---|---|---|
| Quadrant | DetID | PixID | Counts | Sigma | Mean | Median | Sigma |
| A | 13 | 254 | 8305 | 45.33 | 823 | 808 | 165.4 |
| A | 0 | 226 | 7036 | 37.66 | 823 | 808 | 165.4 |
| A | 3 | 137 | 6142 | 32.25 | 823 | 808 | 165.4 |
| B | 3 | 112 | 119331 | 762.61 | 831 | 812 | 155.4 |
| B | 7 | 220 | 68984 | 438.65 | 831 | 812 | 155.4 |
| B | 12 | 111 | 18391 | 113.11 | 831 | 812 | 155.4 |
| C | 3 | 233 | 445142 | 2370.04 | 805 | 814 | 187.5 |
| C | 14 | 238 | 124420 | 659.31 | 805 | 814 | 187.5 |
| C | 9 | 15 | 78962 | 416.84 | 805 | 814 | 187.5 |
| D | 7 | 238 | 1505467 | 7779.31 | 800 | 779 | 193.4 |
| D | 2 | 234 | 24503 | 122.65 | 800 | 779 | 193.4 |
| D | 9 | 68 | 13868 | 67.67 | 800 | 779 | 193.4 |
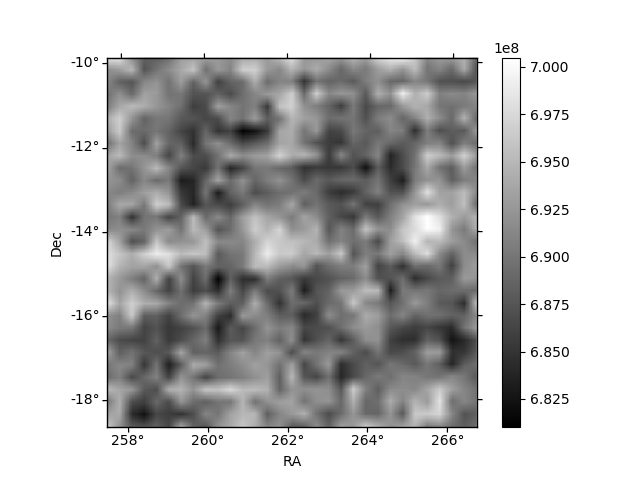
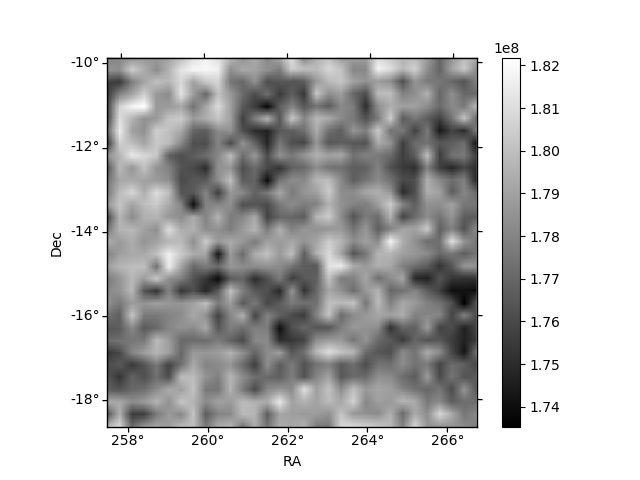
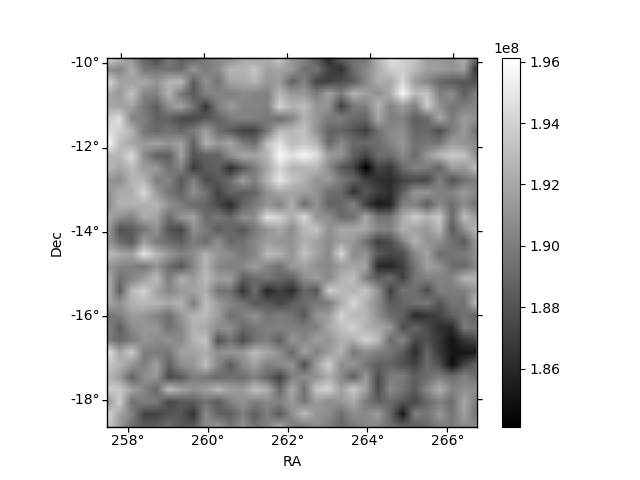
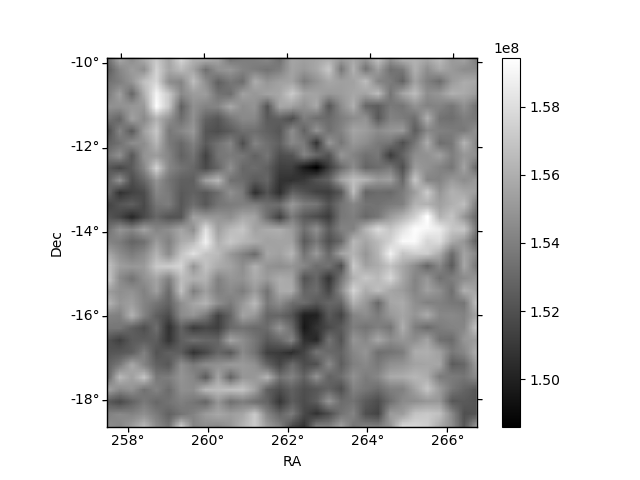
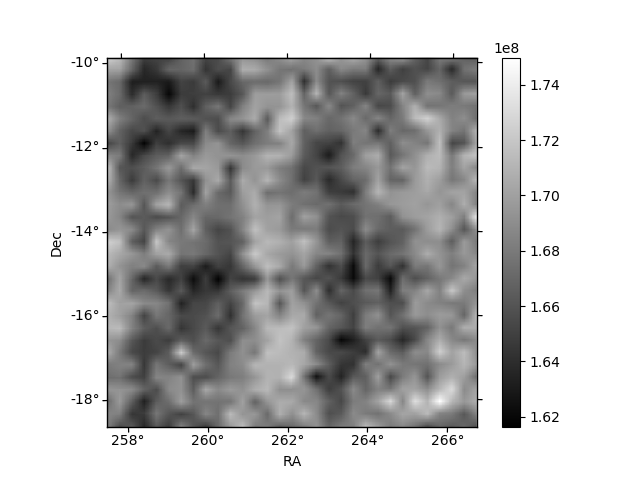
Histogram calculated using DETX and DETY for each event in the final _common_clean file
| Quadrant A | 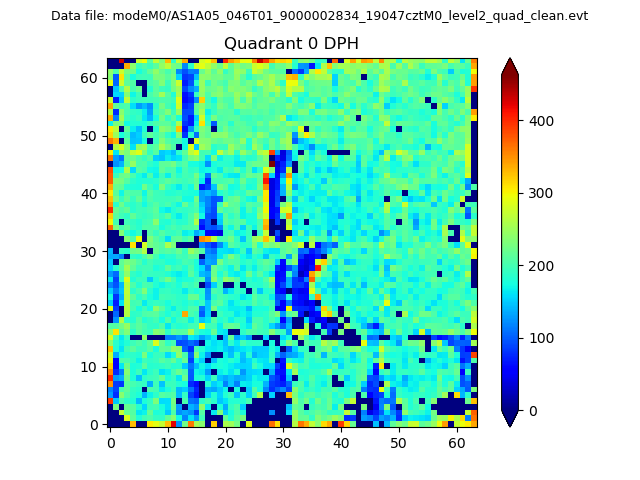 |
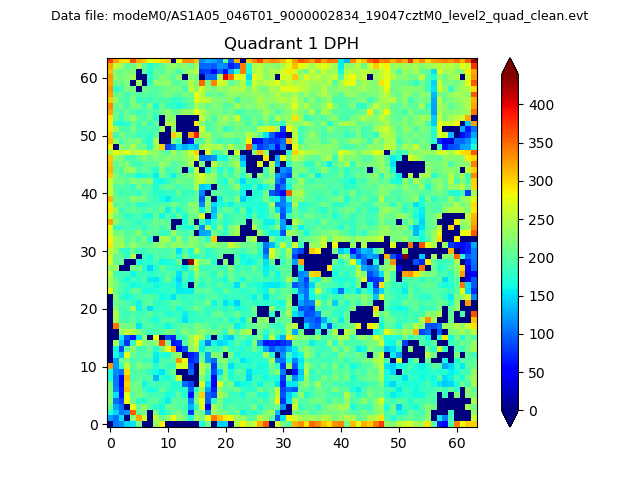 |
Quadrant B |
|---|---|---|---|
| Quadrant D | 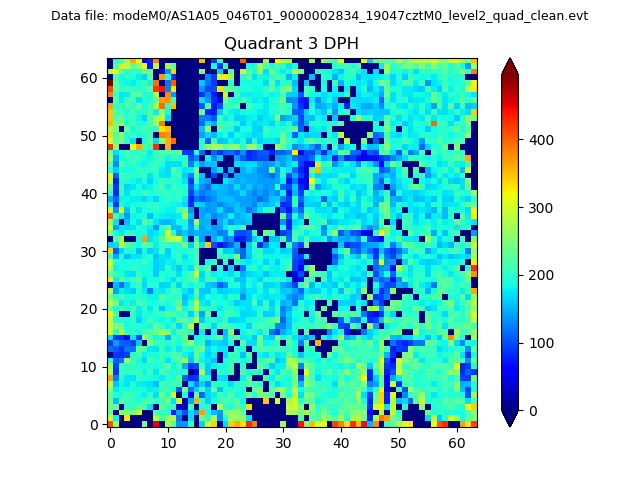 |
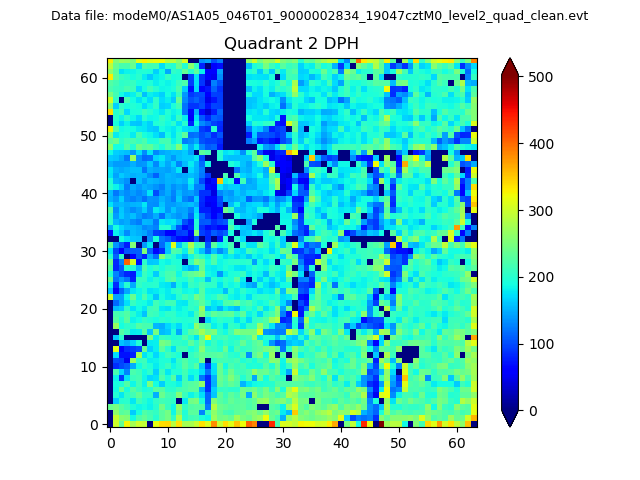 |
Quadrant C |
| Plot type | Count rate plots | Images |
|---|---|---|
| Comparison with Poisson distribution Blue bars denote a histogram of data divided into 1 sec bins. Red curve is a Poisson curve with rate = median count rate of data. |
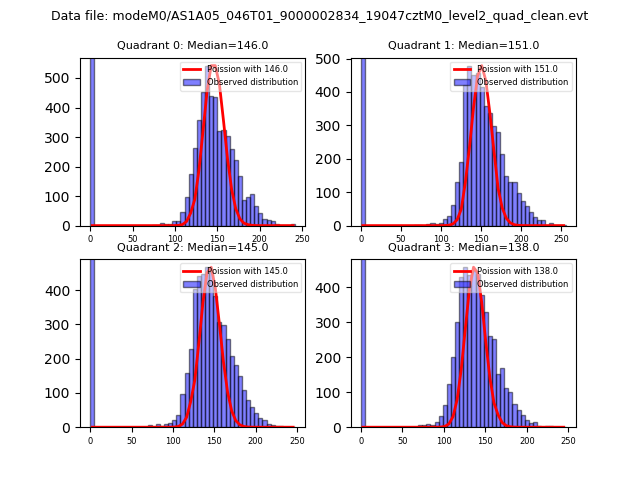 |
 |
| Quadrant-wise count rates Data is divided into 100 sec bins |
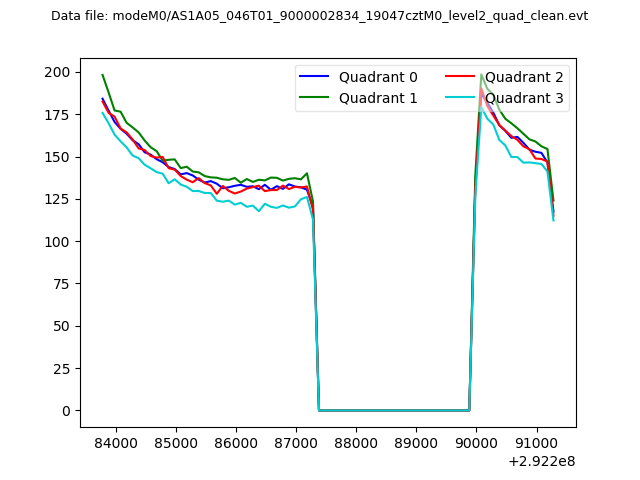 |
|
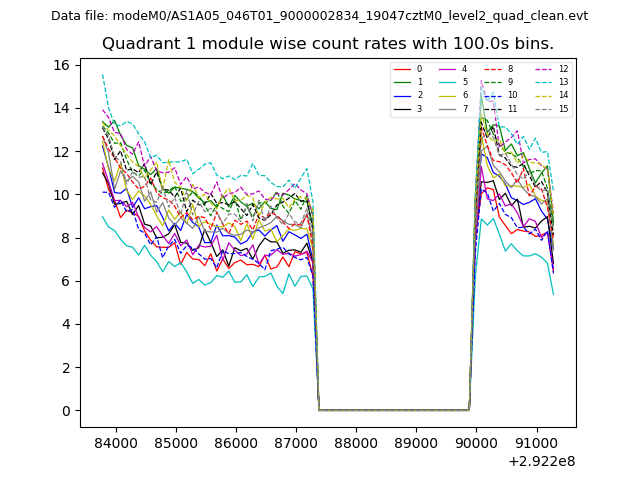
| Module-wise count rates for Quadrant A Data is divided into 100 sec bins |
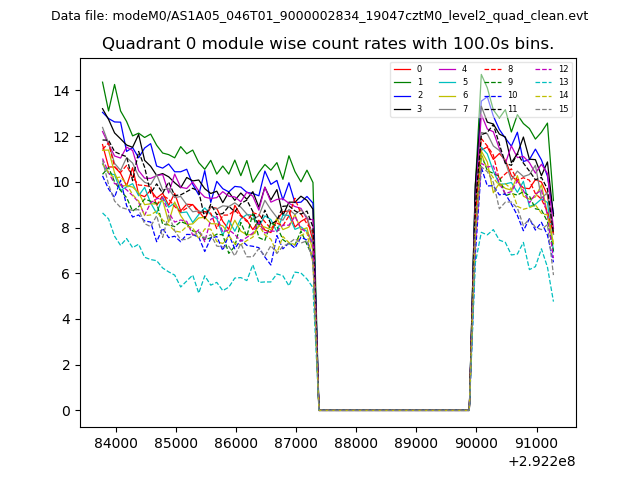 |
 |
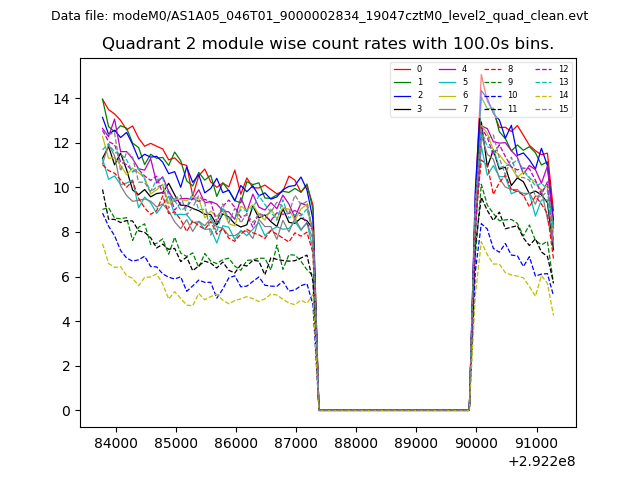
| Module-wise count rates for Quadrant B Data is divided into 100 sec bins |
 |
 |
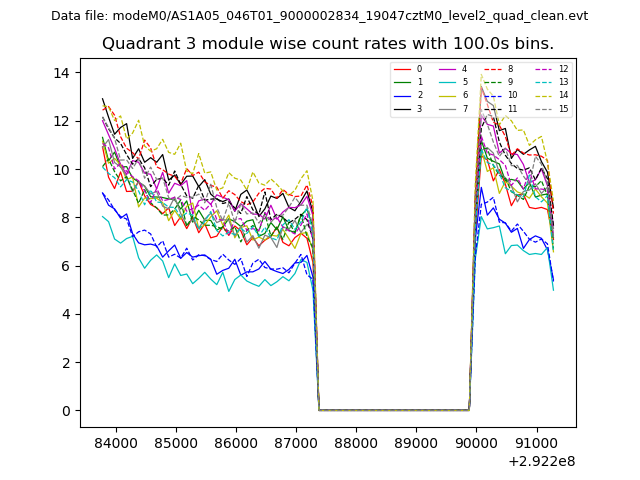
| Module-wise count rates for Quadrant C Data is divided into 100 sec bins |
 |
 |
| Module-wise count rates for Quadrant D Data is divided into 100 sec bins |
 |
 |
| Parameter | Plot |
|---|---|
| CZT HV Monitor | 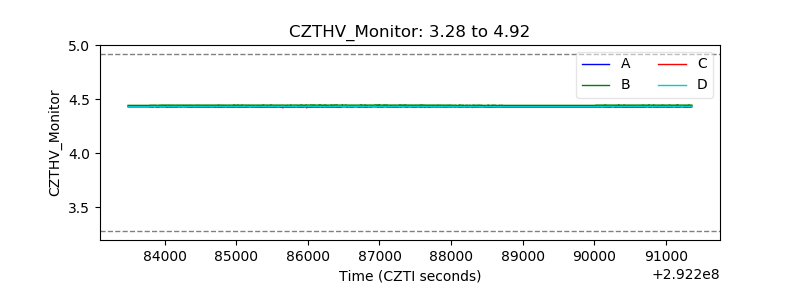 |
| D_VDD | 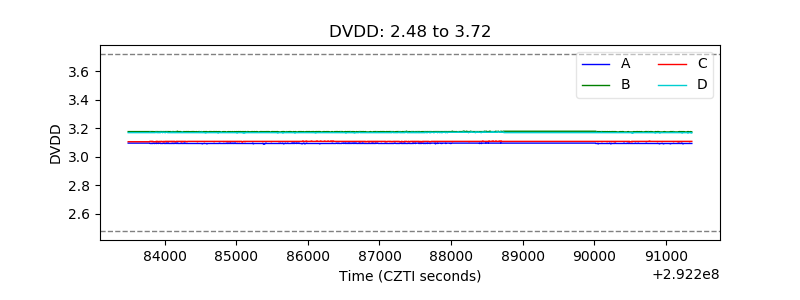 |
| Temperature 1 | 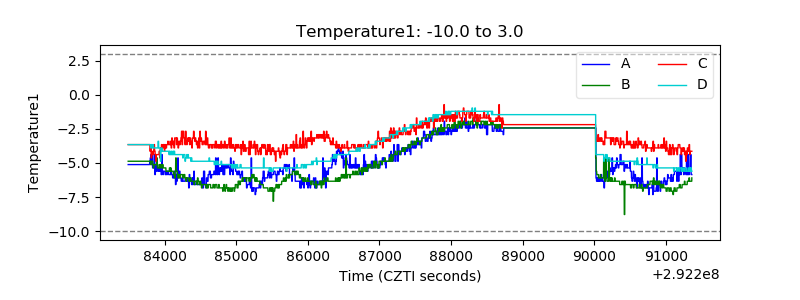 |
| Veto HV Monitor | 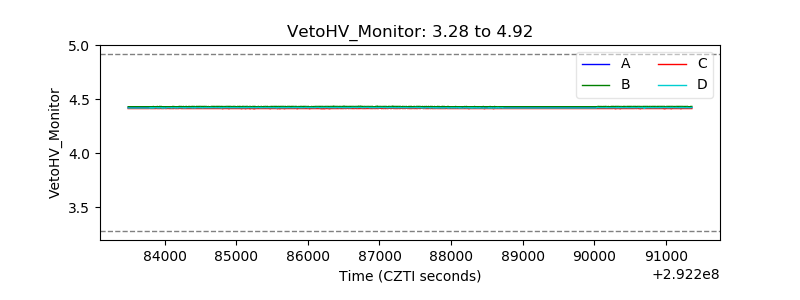 |
| Veto LLD | 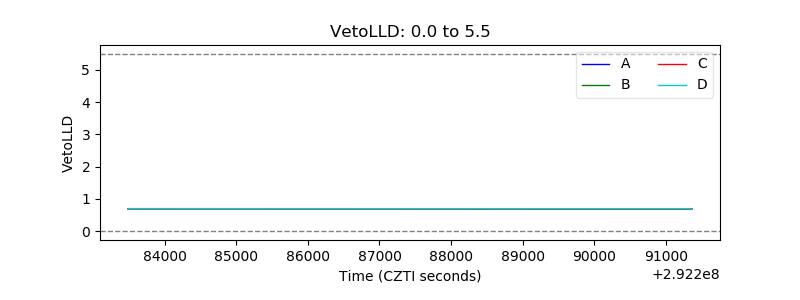 |
| Alpha Counter | 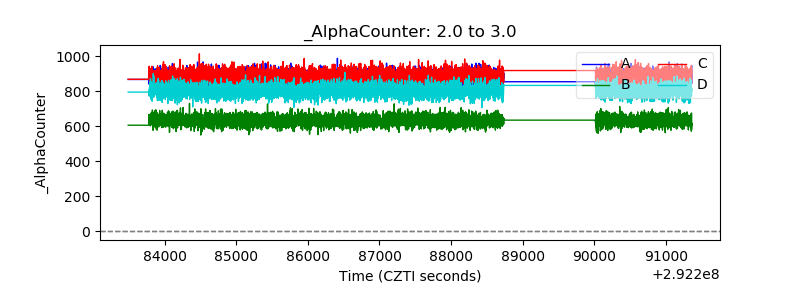 |
| _CPM_Rate | 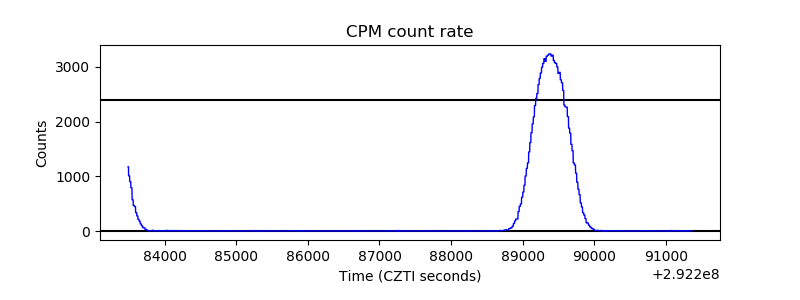 |
| CZT Counter | 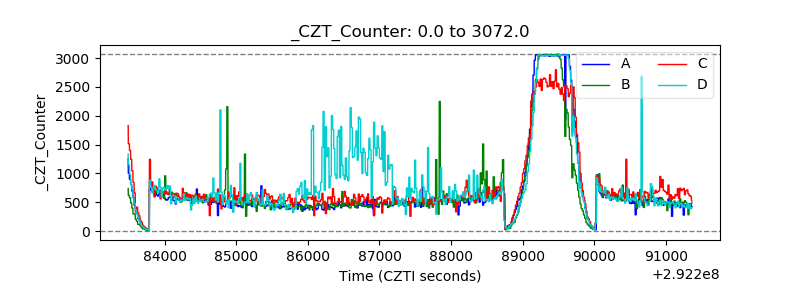 |
| +2.5 Volts monitor |  |
| +5 Volts monitor | 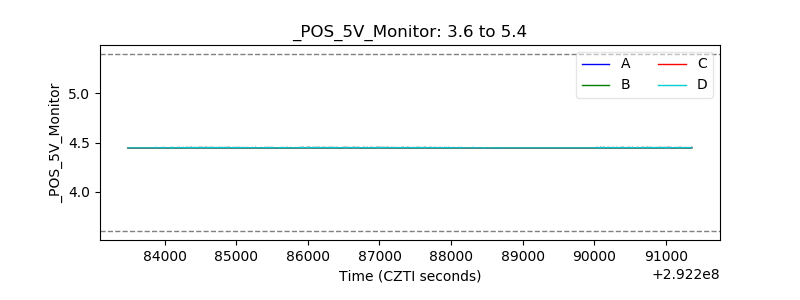 |
| _ROLL_ROT | 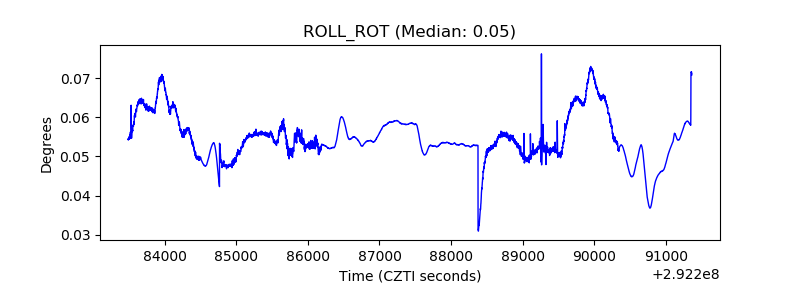 |
| _Roll_DEC | 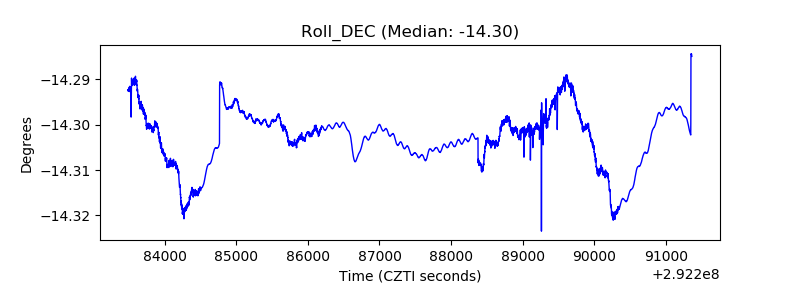 |
| _Roll_RA | 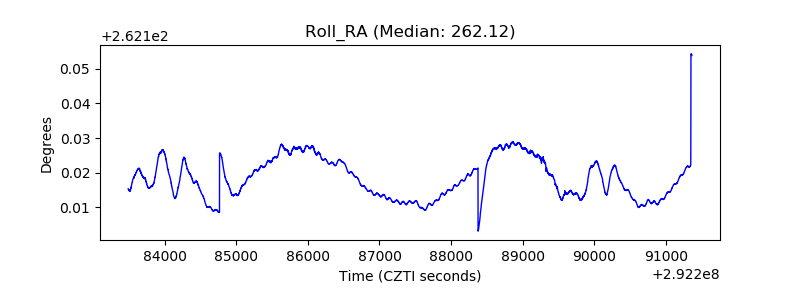 |
| Veto Counter | 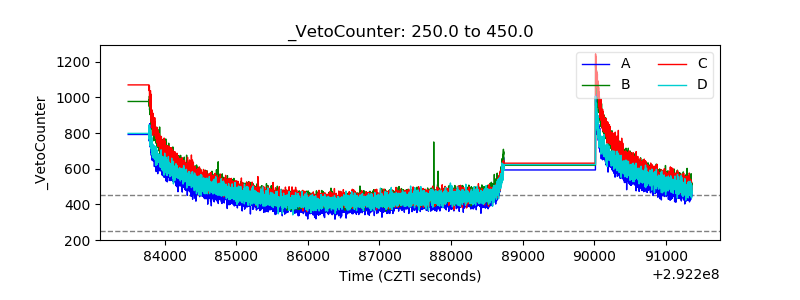 |