| Param | Original file | Final file |
|---|---|---|
| Filename | modeM0/AS1A05_046T01_9000002834_19052cztM0_level2.evt | modeM0/AS1A05_046T01_9000002834_19052cztM0_level2_quad_clean.evt |
| Size (bytes) | 449,530,560 | 81,895,680 |
| Size | 428.7 MB | 78.1 MB |
| Events in quadrant A | 3,140,504 | 506,554 |
| Events in quadrant B | 3,551,981 | 517,526 |
| Events in quadrant C | 3,280,353 | 500,674 |
| Events in quadrant D | 3,185,676 | 488,185 |
| Mode SS | |||
|---|---|---|---|
| Quadrant | BADHDUFLAG | Total packets | Discarded packets |
| A | 0 | 136 | 0 |
| B | 0 | 136 | 0 |
| C | 0 | 136 | 0 |
| D | 0 | 136 | 0 |
| Mode M0 | |||
|---|---|---|---|
| Quadrant | BADHDUFLAG | Total packets | Discarded packets |
| A | 0 | 13707 | 1 |
| B | 0 | 14717 | 1 |
| C | 0 | 13967 | 1 |
| D | 0 | 14007 | 1 |
| Mode M9 | |||
|---|---|---|---|
| Quadrant | BADHDUFLAG | Total packets | Discarded packets |
| A | 0 | 5 | 0 |
| B | 0 | 5 | 0 |
| C | 0 | 5 | 0 |
| D | 0 | 5 | 0 |
| Quadrant | Total seconds | Saturated seconds | Saturation percentage |
|---|---|---|---|
| A | 6706 | 107 | 1.595586% |
| B | 6707 | 163 | 2.430297% |
| C | 6707 | 127 | 1.893544% |
| D | 6707 | 79 | 1.177874% |
Noise dominated data is calculated using 1-second bins in cleaned event files. If a bin has >2000 counts, and if more than 50% of those come from <1% of pixels, then it is considered to be noise-dominated and hence unusable.
| Quadrant | # 1 sec bins | Bins with >0 counts | Bins with >2000 counts | High rate bins dominated by noise | Noise dominated (total time) | Noise dominated (detector-on time) | Marked lightcurve |
|---|---|---|---|---|---|---|---|
| A | 7101 | 6708 | 0 | 0 | 0.00% | 0.00% | 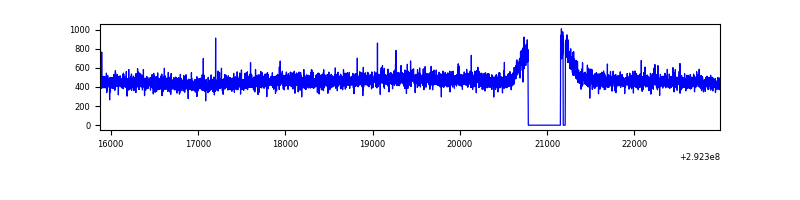 |
| B | 7102 | 6709 | 24 | 24 | 0.34% | 0.36% | 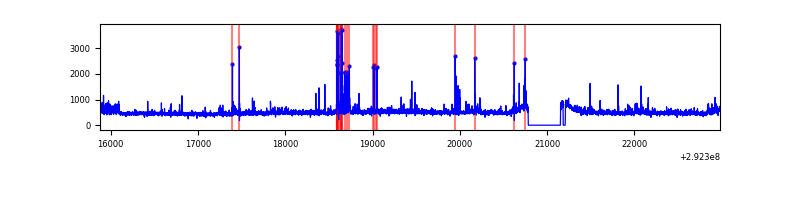 |
| C | 7102 | 6709 | 1 | 1 | 0.01% | 0.01% | 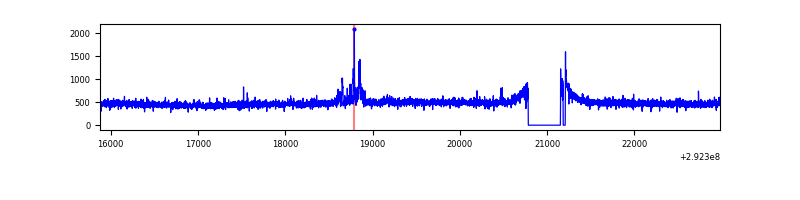 |
| D | 7102 | 6709 | 0 | 0 | 0.00% | 0.00% | 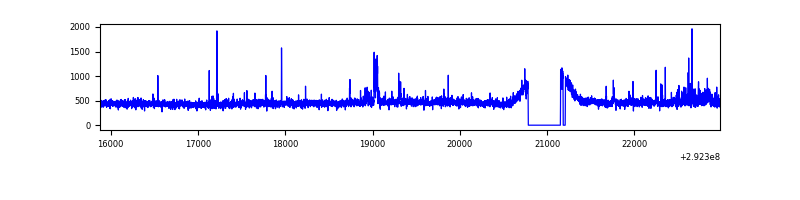 |
Top three noisy pixels from each quadrant. If the there are fewer than three noisy pixels in the level2.evt file, extra rows are filled as -1
| Pixel properties | Quadrant properties | ||||||
|---|---|---|---|---|---|---|---|
| Quadrant | DetID | PixID | Counts | Sigma | Mean | Median | Sigma |
| A | 13 | 254 | 8490 | 46.57 | 814 | 796 | 165.2 |
| A | 0 | 226 | 6873 | 36.78 | 814 | 796 | 165.2 |
| A | 3 | 137 | 6481 | 34.41 | 814 | 796 | 165.2 |
| B | 10 | 246 | 161246 | 1031.52 | 808 | 786 | 155.6 |
| B | 7 | 220 | 87478 | 557.3 | 808 | 786 | 155.6 |
| B | 3 | 112 | 54310 | 344.08 | 808 | 786 | 155.6 |
| C | 14 | 238 | 121722 | 653.18 | 785 | 790 | 185.1 |
| C | 3 | 233 | 89970 | 481.68 | 785 | 790 | 185.1 |
| C | 8 | 128 | 5852 | 27.34 | 785 | 790 | 185.1 |
| D | 7 | 238 | 144163 | 731.57 | 799 | 776 | 196.0 |
| D | 2 | 234 | 31911 | 158.85 | 799 | 776 | 196.0 |
| D | 14 | 226 | 7843 | 36.06 | 799 | 776 | 196.0 |
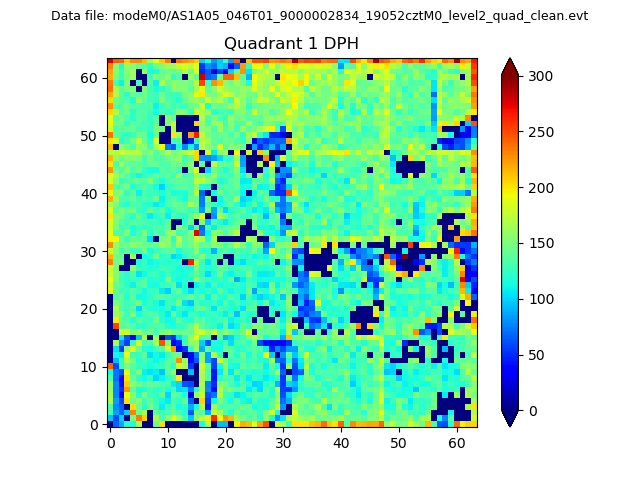
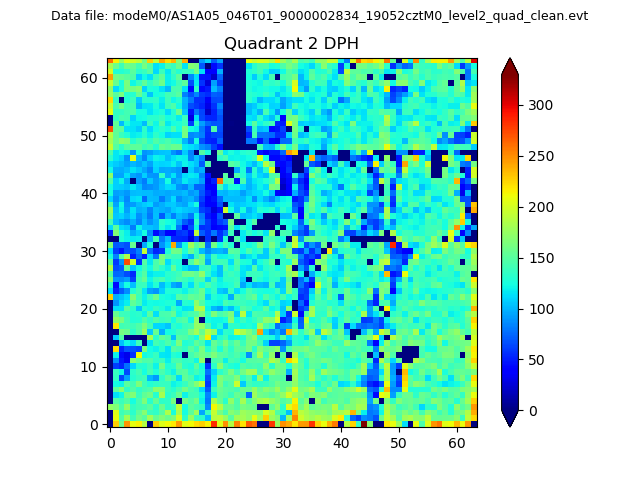
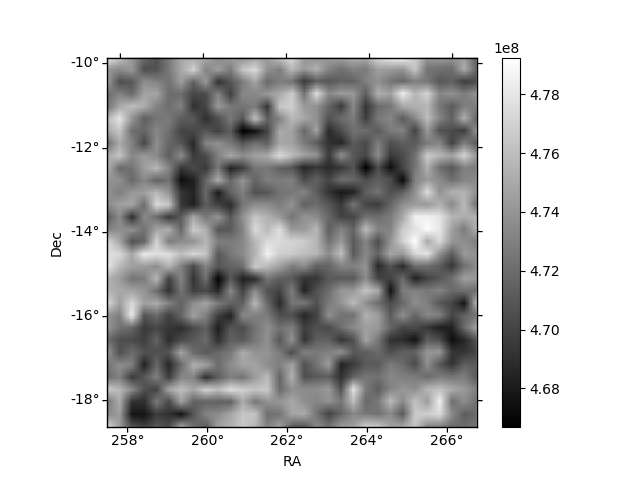
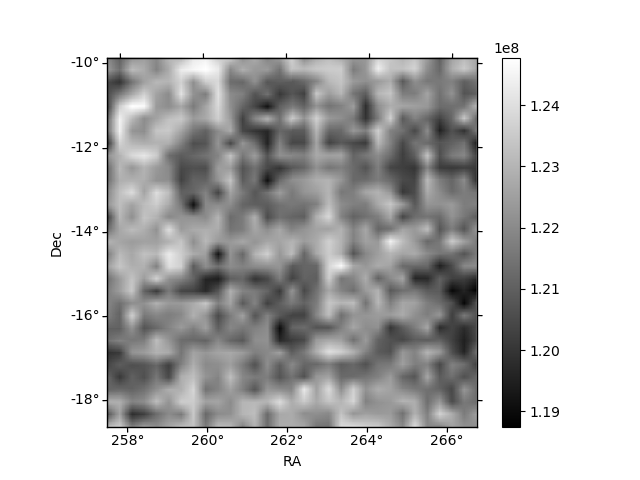
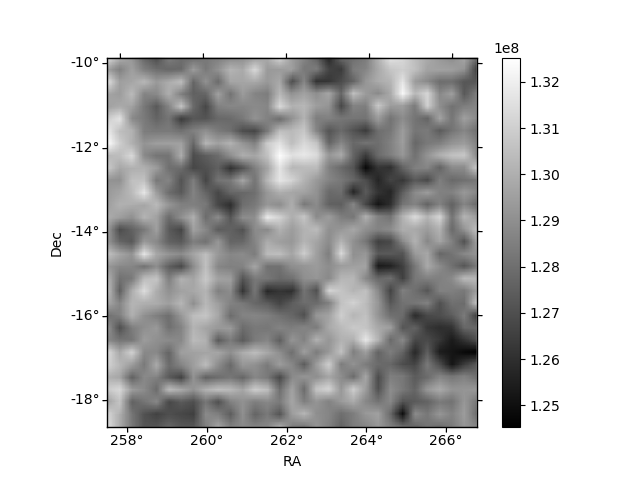
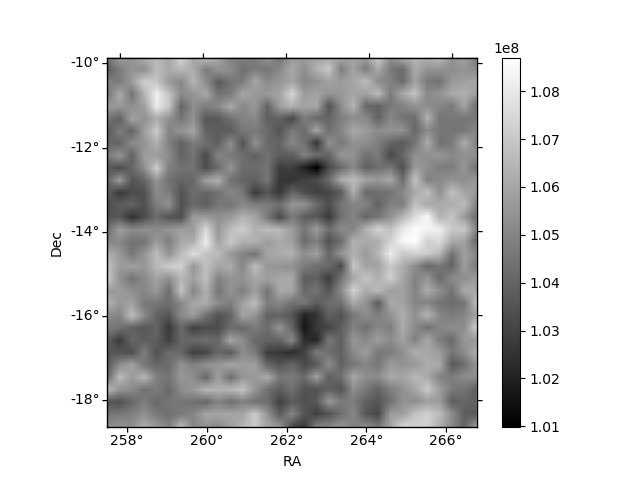
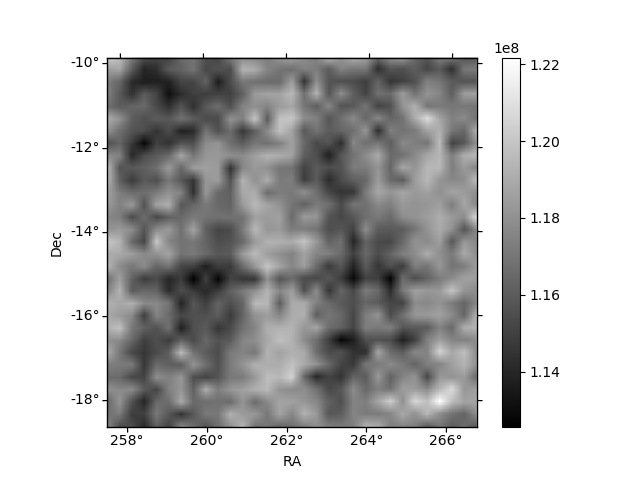
Histogram calculated using DETX and DETY for each event in the final _common_clean file
| Quadrant A |  |
 |
Quadrant B |
|---|---|---|---|
| Quadrant D | 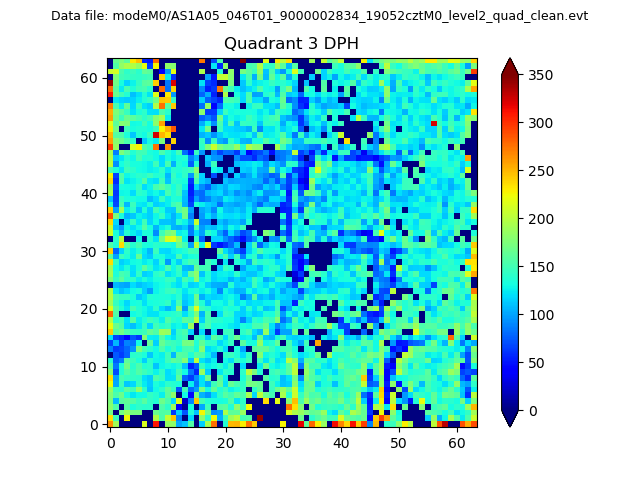 |
 |
Quadrant C |
| Plot type | Count rate plots | Images |
|---|---|---|
| Comparison with Poisson distribution Blue bars denote a histogram of data divided into 1 sec bins. Red curve is a Poisson curve with rate = median count rate of data. |
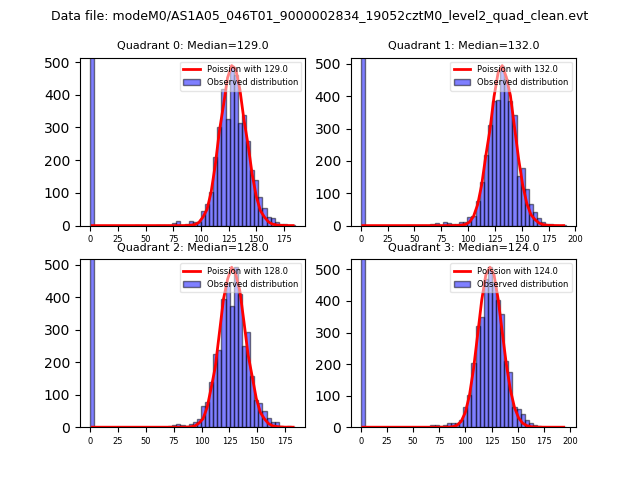 |
 |
| Quadrant-wise count rates Data is divided into 100 sec bins |
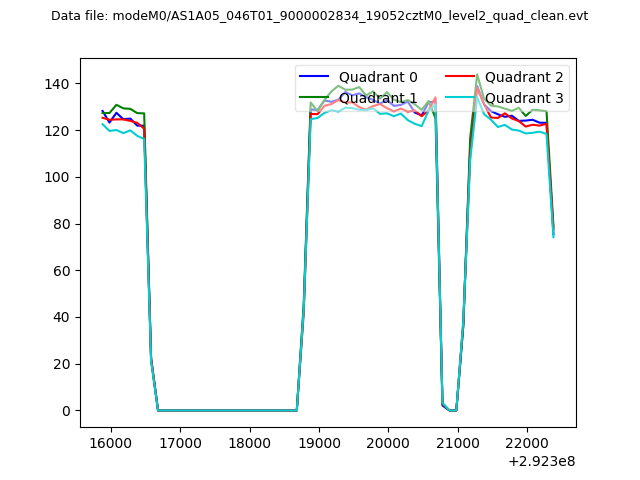 |
|
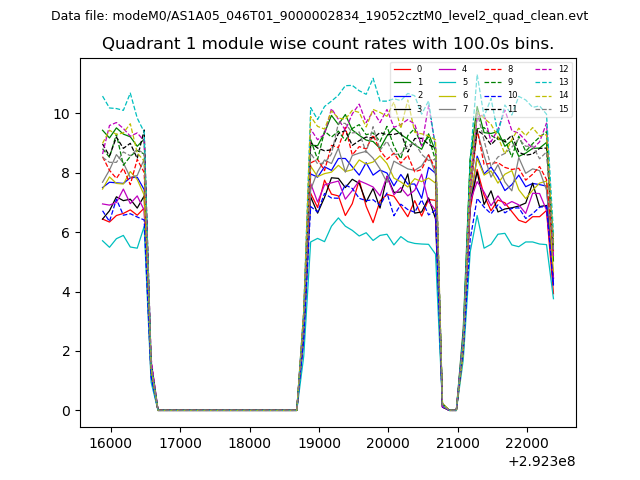
| Module-wise count rates for Quadrant A Data is divided into 100 sec bins |
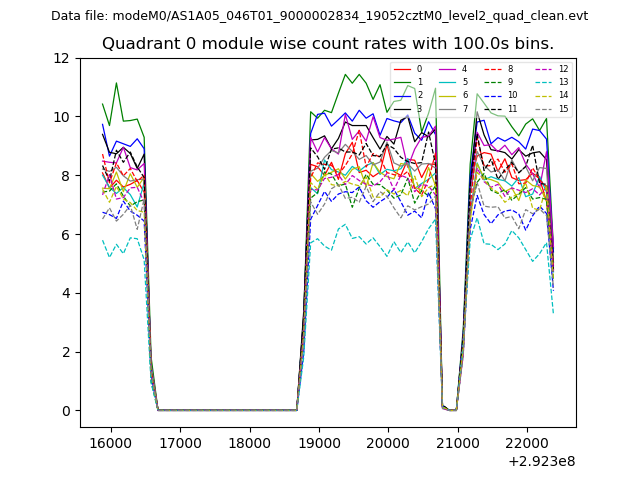 |
 |
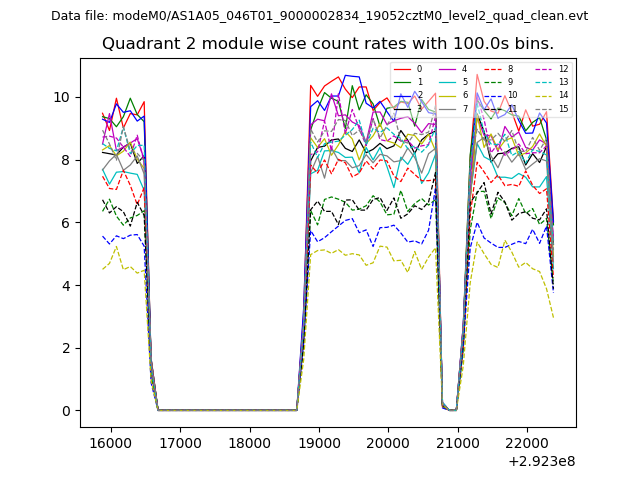
| Module-wise count rates for Quadrant B Data is divided into 100 sec bins |
 |
 |
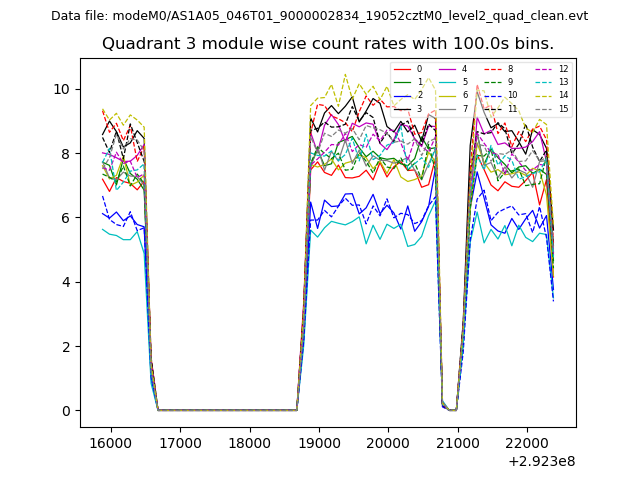
| Module-wise count rates for Quadrant C Data is divided into 100 sec bins |
 |
 |
| Module-wise count rates for Quadrant D Data is divided into 100 sec bins |
 |
 |
| Parameter | Plot |
|---|---|
| CZT HV Monitor | 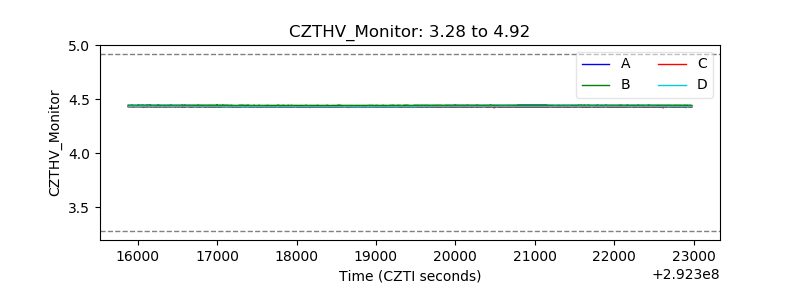 |
| D_VDD | 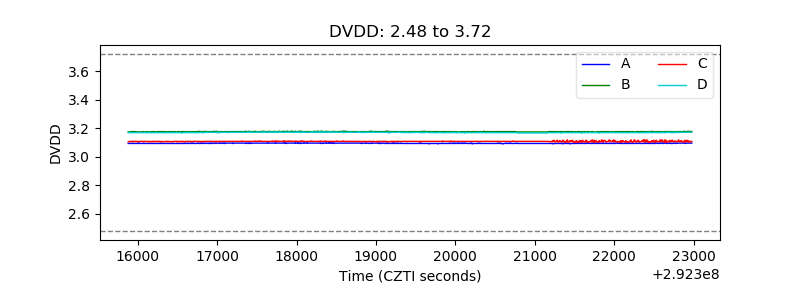 |
| Temperature 1 | 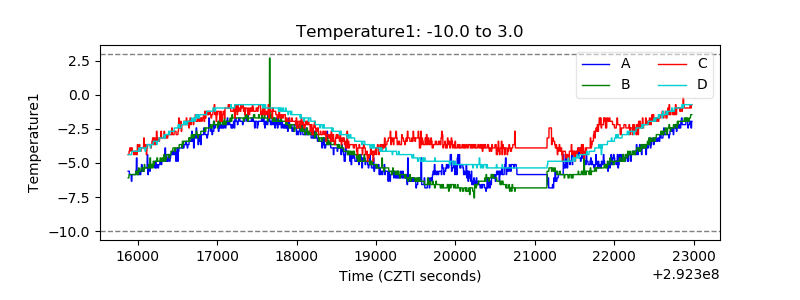 |
| Veto HV Monitor | 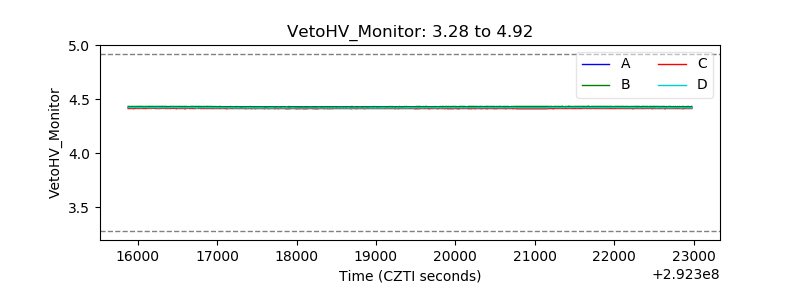 |
| Veto LLD | 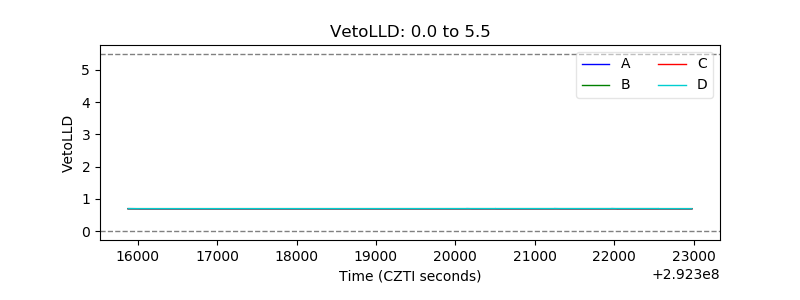 |
| Alpha Counter | 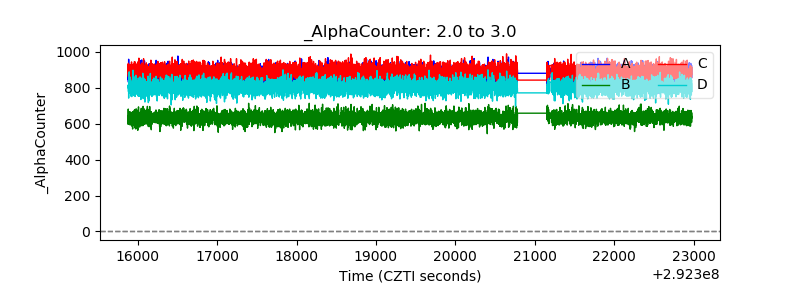 |
| _CPM_Rate |  |
| CZT Counter | 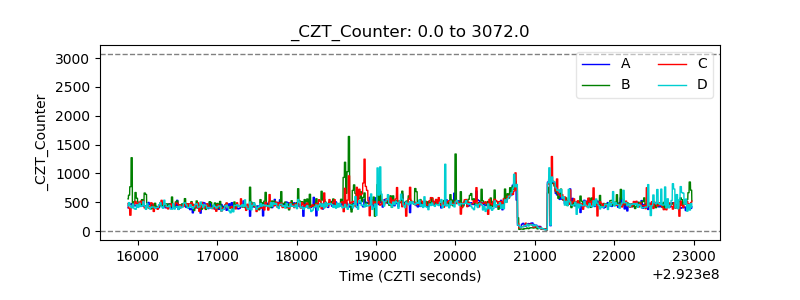 |
| +2.5 Volts monitor | 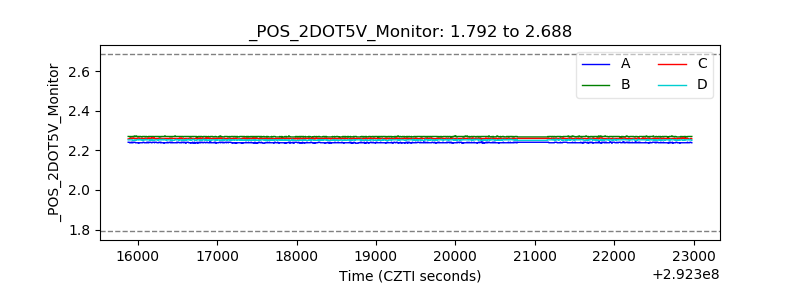 |
| +5 Volts monitor |  |
| _ROLL_ROT | 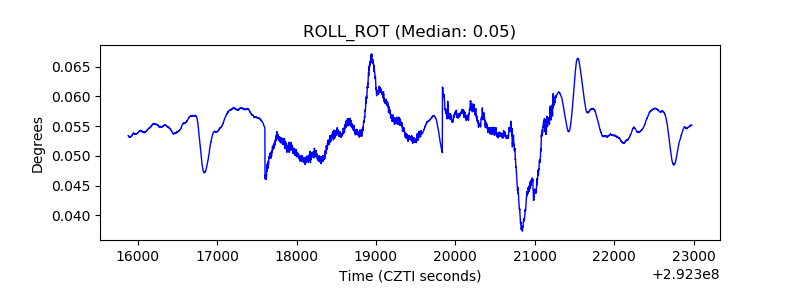 |
| _Roll_DEC | 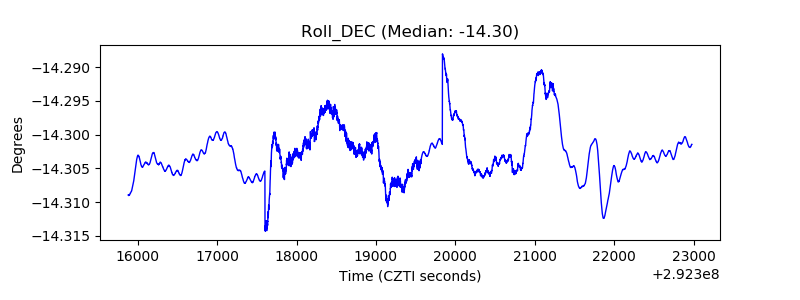 |
| _Roll_RA | 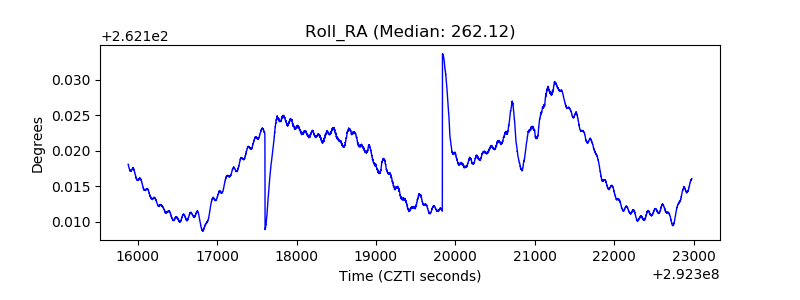 |
| Veto Counter | 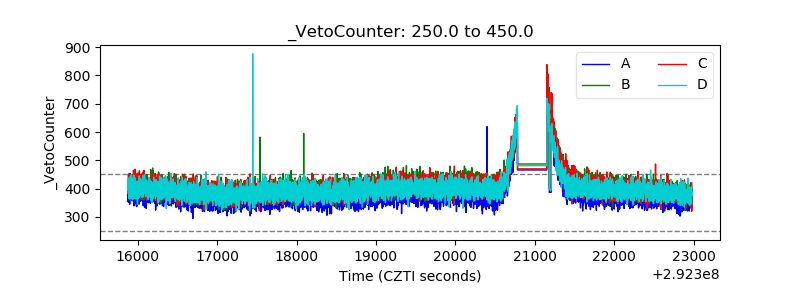 |