| Param | Original file | Final file |
|---|---|---|
| Filename | modeM0/AS1A05_046T01_9000002834_19053cztM0_level2.evt | modeM0/AS1A05_046T01_9000002834_19053cztM0_level2_quad_clean.evt |
| Size (bytes) | 526,285,440 | 95,120,640 |
| Size | 501.9 MB | 90.7 MB |
| Events in quadrant A | 3,650,385 | 587,813 |
| Events in quadrant B | 3,937,940 | 603,847 |
| Events in quadrant C | 3,746,444 | 584,943 |
| Events in quadrant D | 4,083,294 | 570,669 |
| Mode SS | |||
|---|---|---|---|
| Quadrant | BADHDUFLAG | Total packets | Discarded packets |
| A | 0 | 156 | 0 |
| B | 0 | 156 | 0 |
| C | 0 | 156 | 0 |
| D | 0 | 156 | 0 |
| Mode M0 | |||
|---|---|---|---|
| Quadrant | BADHDUFLAG | Total packets | Discarded packets |
| A | 0 | 15859 | 1 |
| B | 0 | 16428 | 1 |
| C | 0 | 15903 | 1 |
| D | 0 | 17272 | 1 |
| Mode M9 | |||
|---|---|---|---|
| Quadrant | BADHDUFLAG | Total packets | Discarded packets |
| A | 0 | 1 | 0 |
| B | 0 | 1 | 0 |
| C | 0 | 1 | 0 |
| D | 0 | 1 | 0 |
| Quadrant | Total seconds | Saturated seconds | Saturation percentage |
|---|---|---|---|
| A | 7659 | 220 | 2.872438% |
| B | 7660 | 232 | 3.028721% |
| C | 7660 | 224 | 2.924282% |
| D | 7660 | 222 | 2.898172% |
Noise dominated data is calculated using 1-second bins in cleaned event files. If a bin has >2000 counts, and if more than 50% of those come from <1% of pixels, then it is considered to be noise-dominated and hence unusable.
| Quadrant | # 1 sec bins | Bins with >0 counts | Bins with >2000 counts | High rate bins dominated by noise | Noise dominated (total time) | Noise dominated (detector-on time) | Marked lightcurve |
|---|---|---|---|---|---|---|---|
| A | 7774 | 7660 | 0 | 0 | 0.00% | 0.00% |  |
| B | 7775 | 7661 | 5 | 5 | 0.06% | 0.07% |  |
| C | 7775 | 7661 | 0 | 0 | 0.00% | 0.00% |  |
| D | 7775 | 7661 | 55 | 55 | 0.71% | 0.72% |  |
Top three noisy pixels from each quadrant. If the there are fewer than three noisy pixels in the level2.evt file, extra rows are filled as -1
| Pixel properties | Quadrant properties | ||||||
|---|---|---|---|---|---|---|---|
| Quadrant | DetID | PixID | Counts | Sigma | Mean | Median | Sigma |
| A | 13 | 254 | 9006 | 41.62 | 947 | 925 | 194.2 |
| A | 0 | 226 | 8160 | 37.26 | 947 | 925 | 194.2 |
| A | 3 | 137 | 7640 | 34.58 | 947 | 925 | 194.2 |
| B | 10 | 246 | 122445 | 656.58 | 941 | 916 | 185.1 |
| B | 4 | 216 | 31686 | 166.24 | 941 | 916 | 185.1 |
| B | 12 | 111 | 22007 | 113.95 | 941 | 916 | 185.1 |
| C | 14 | 238 | 138974 | 637.01 | 913 | 920 | 216.7 |
| C | 3 | 233 | 24277 | 107.77 | 913 | 920 | 216.7 |
| C | 8 | 128 | 13705 | 58.99 | 913 | 920 | 216.7 |
| D | 7 | 238 | 416272 | 1817.53 | 931 | 902 | 228.5 |
| D | 7 | 38 | 131309 | 570.62 | 931 | 902 | 228.5 |
| D | 2 | 234 | 38946 | 166.47 | 931 | 902 | 228.5 |
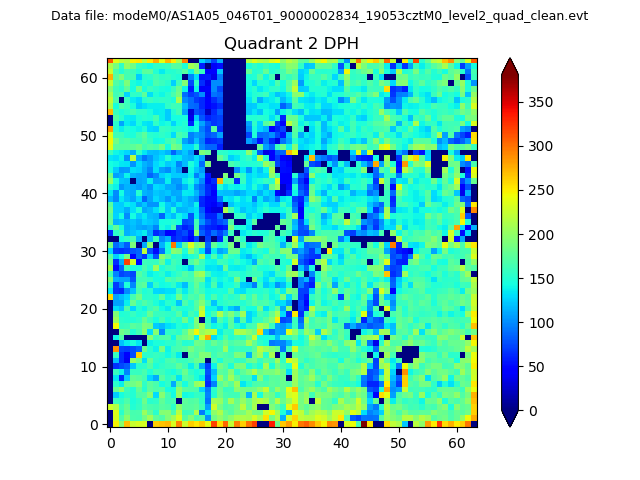
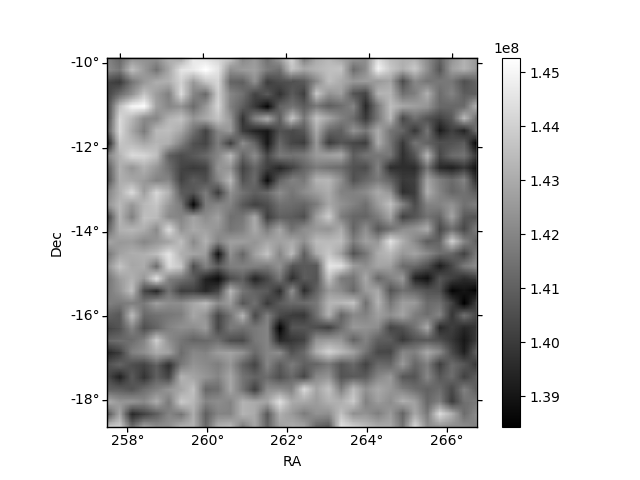
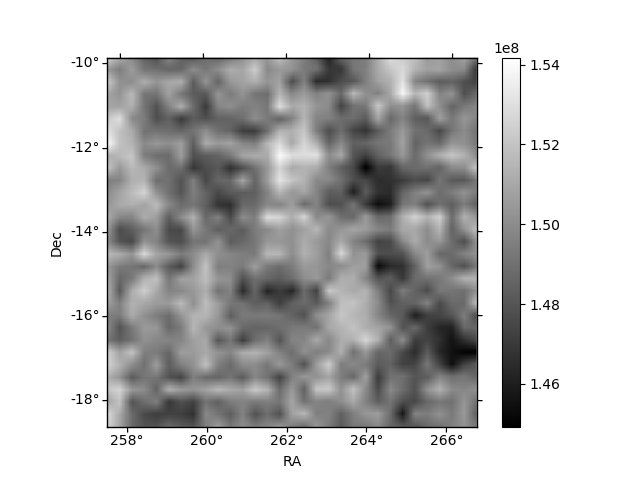
Histogram calculated using DETX and DETY for each event in the final _common_clean file
| Quadrant A | 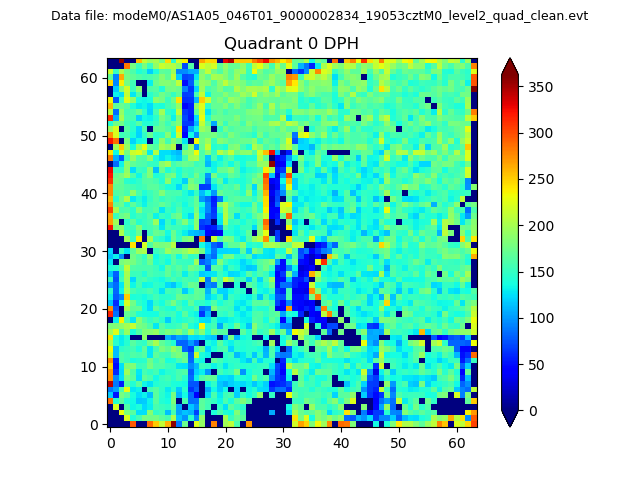 |
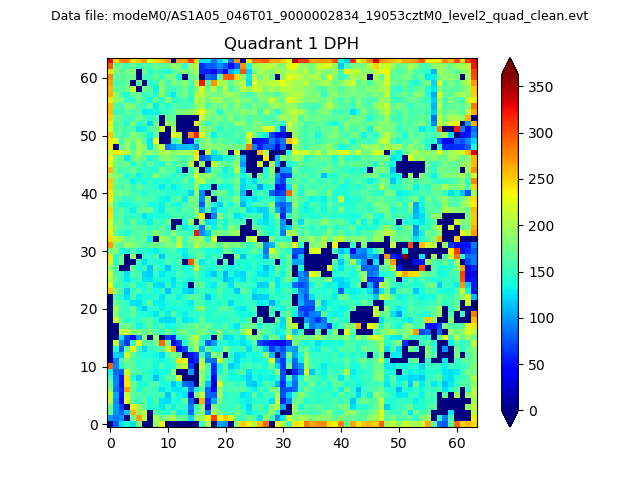 |
Quadrant B |
|---|---|---|---|
| Quadrant D | 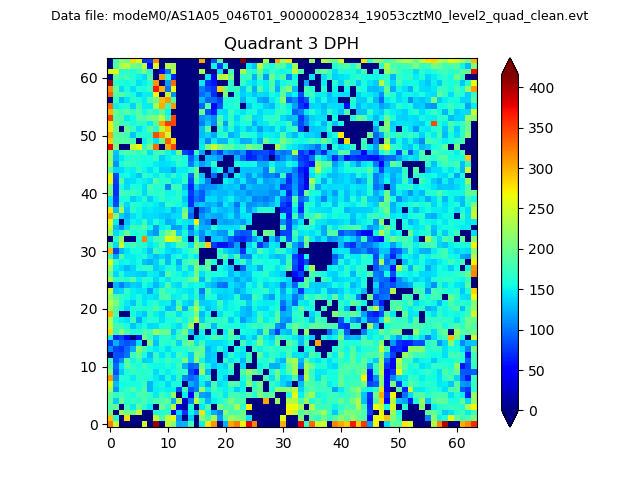 |
 |
Quadrant C |
| Plot type | Count rate plots | Images |
|---|---|---|
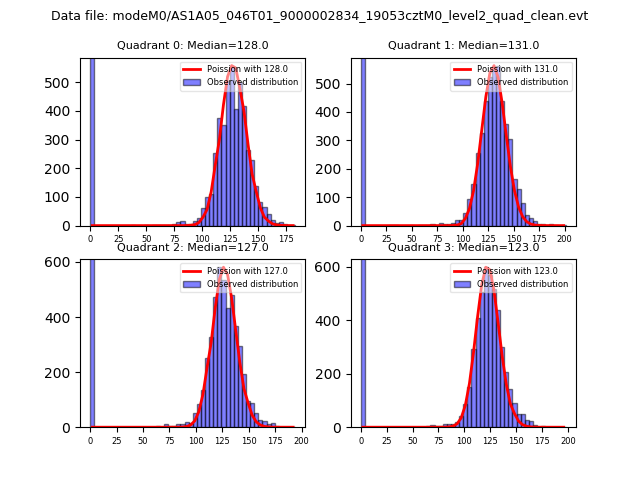
| Comparison with Poisson distribution Blue bars denote a histogram of data divided into 1 sec bins. Red curve is a Poisson curve with rate = median count rate of data. |
 |
 |
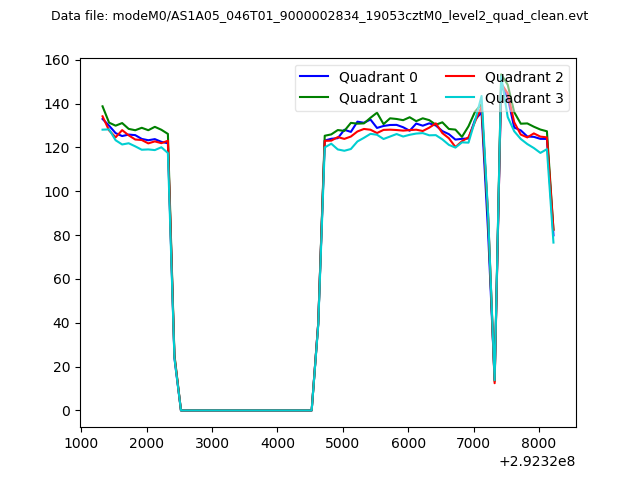
| Quadrant-wise count rates Data is divided into 100 sec bins |
 |
|
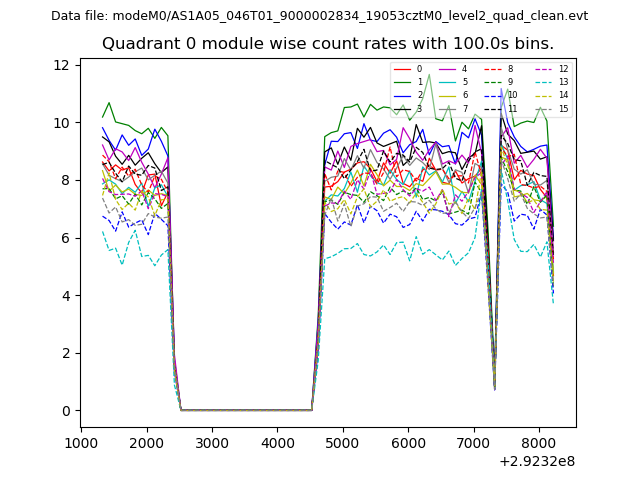
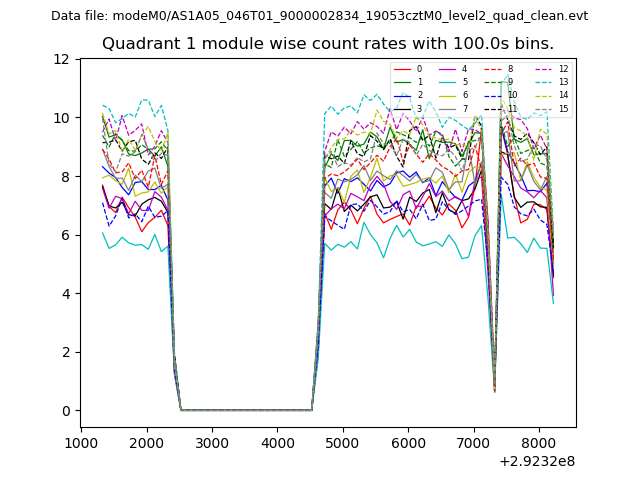
| Module-wise count rates for Quadrant A Data is divided into 100 sec bins |
 |
 |
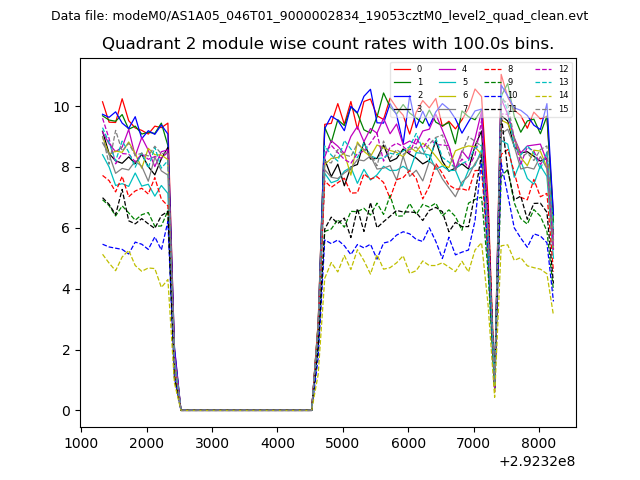
| Module-wise count rates for Quadrant B Data is divided into 100 sec bins |
 |
 |
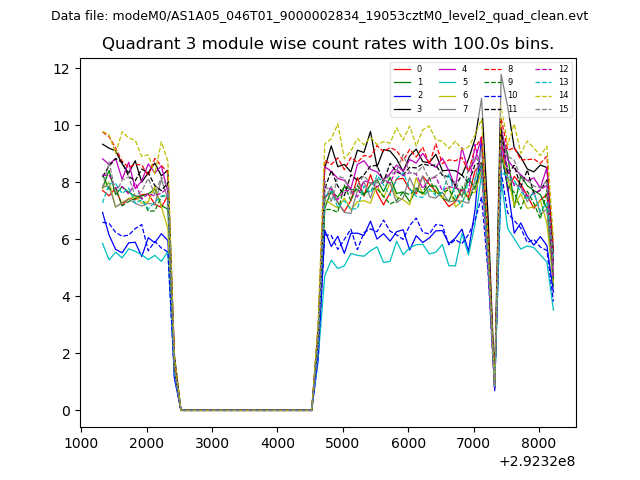
| Module-wise count rates for Quadrant C Data is divided into 100 sec bins |
 |
 |
| Module-wise count rates for Quadrant D Data is divided into 100 sec bins |
 |
 |
| Parameter | Plot |
|---|---|
| CZT HV Monitor | 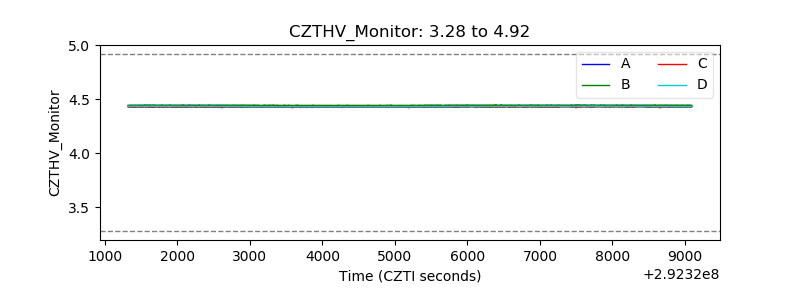 |
| D_VDD | 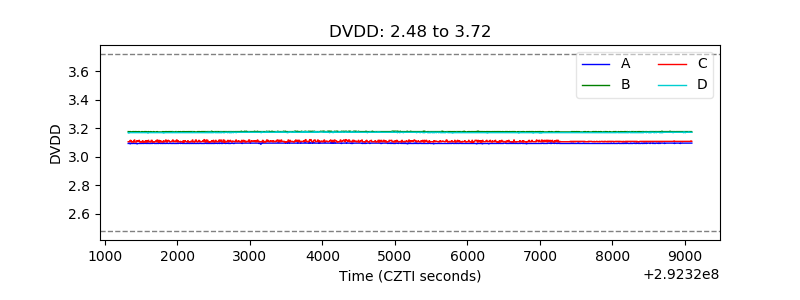 |
| Temperature 1 | 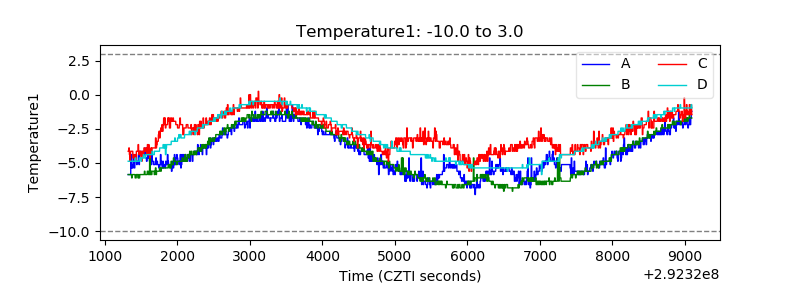 |
| Veto HV Monitor | 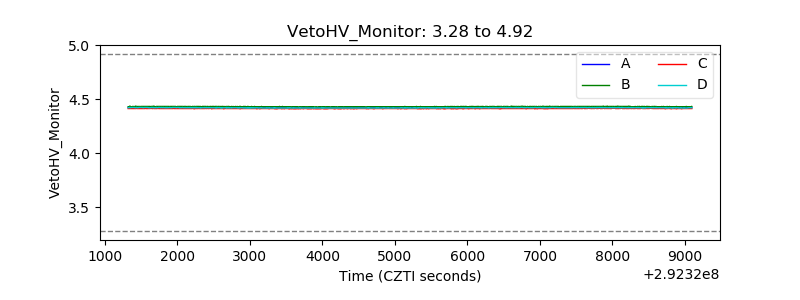 |
| Veto LLD | 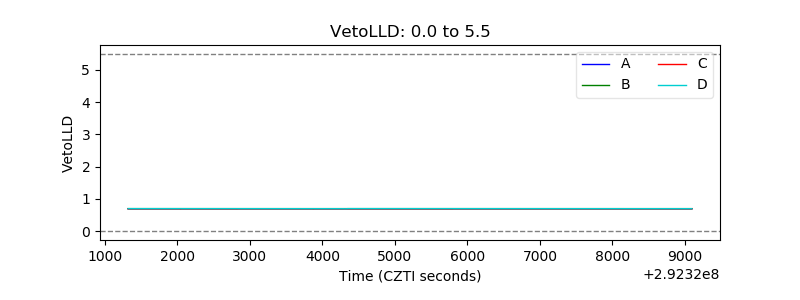 |
| Alpha Counter | 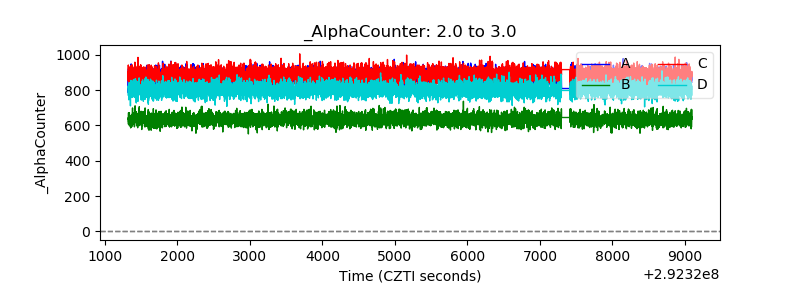 |
| _CPM_Rate |  |
| CZT Counter | 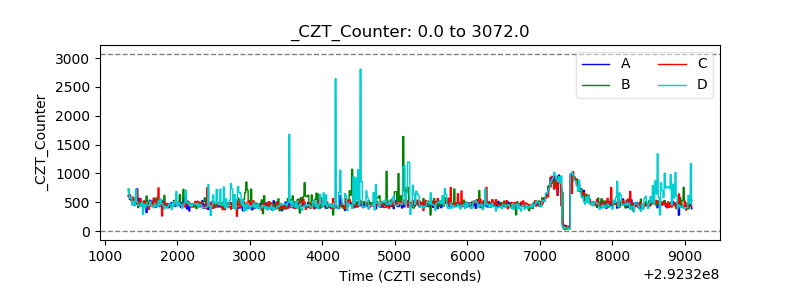 |
| +2.5 Volts monitor |  |
| +5 Volts monitor | 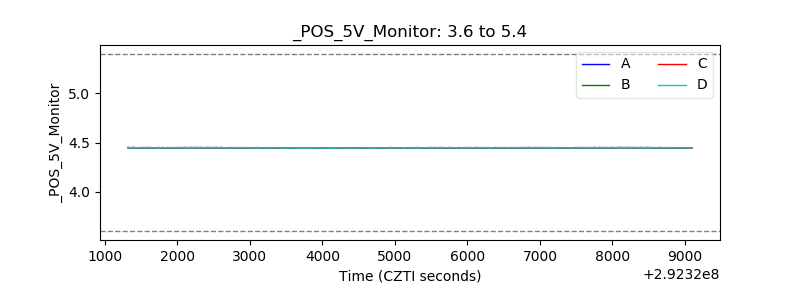 |
| _ROLL_ROT | 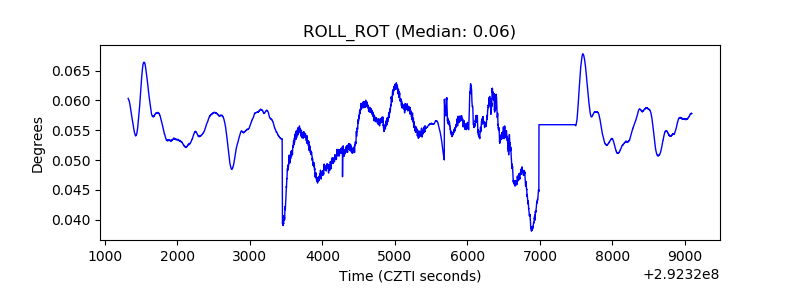 |
| _Roll_DEC | 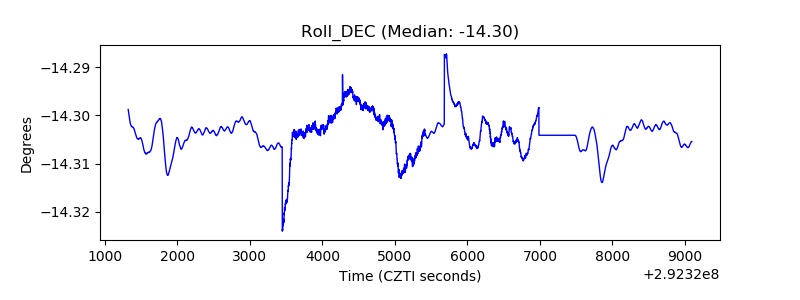 |
| _Roll_RA | 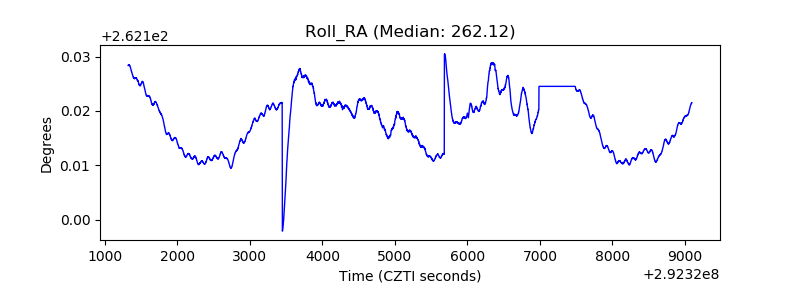 |
| Veto Counter | 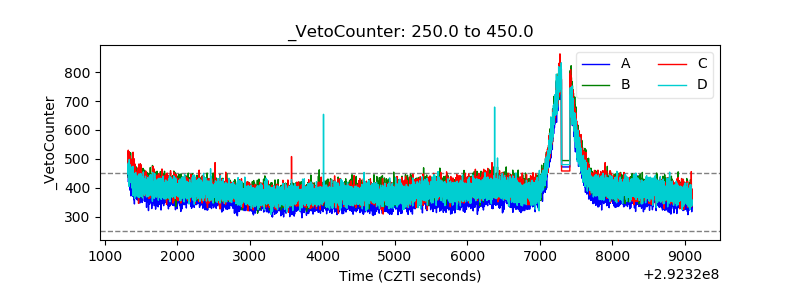 |