| Param | Original file | Final file |
|---|---|---|
| Filename | modeM0/AS1A05_046T01_9000002834_19054cztM0_level2.evt | modeM0/AS1A05_046T01_9000002834_19054cztM0_level2_quad_clean.evt |
| Size (bytes) | 538,421,760 | 85,818,240 |
| Size | 513.5 MB | 81.8 MB |
| Events in quadrant A | 3,621,105 | 520,133 |
| Events in quadrant B | 4,001,806 | 529,986 |
| Events in quadrant C | 4,235,670 | 515,028 |
| Events in quadrant D | 3,928,339 | 501,672 |
| Mode SS | |||
|---|---|---|---|
| Quadrant | BADHDUFLAG | Total packets | Discarded packets |
| A | 0 | 154 | 0 |
| B | 0 | 154 | 0 |
| C | 0 | 154 | 0 |
| D | 0 | 154 | 0 |
| Mode M0 | |||
|---|---|---|---|
| Quadrant | BADHDUFLAG | Total packets | Discarded packets |
| A | 0 | 15757 | 2 |
| B | 0 | 16699 | 2 |
| C | 0 | 17355 | 2 |
| D | 0 | 16682 | 2 |
| Mode M9 | |||
|---|---|---|---|
| Quadrant | BADHDUFLAG | Total packets | Discarded packets |
| A | 0 | 4 | 0 |
| B | 0 | 4 | 0 |
| C | 0 | 4 | 0 |
| D | 0 | 4 | 0 |
| Quadrant | Total seconds | Saturated seconds | Saturation percentage |
|---|---|---|---|
| A | 7649 | 106 | 1.385802% |
| B | 7650 | 165 | 2.156863% |
| C | 7650 | 372 | 4.862745% |
| D | 7650 | 104 | 1.359477% |
Noise dominated data is calculated using 1-second bins in cleaned event files. If a bin has >2000 counts, and if more than 50% of those come from <1% of pixels, then it is considered to be noise-dominated and hence unusable.
| Quadrant | # 1 sec bins | Bins with >0 counts | Bins with >2000 counts | High rate bins dominated by noise | Noise dominated (total time) | Noise dominated (detector-on time) | Marked lightcurve |
|---|---|---|---|---|---|---|---|
| A | 7984 | 7650 | 0 | 0 | 0.00% | 0.00% | 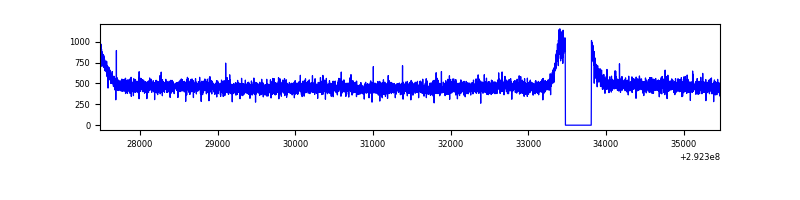 |
| B | 7985 | 7651 | 21 | 21 | 0.26% | 0.27% | 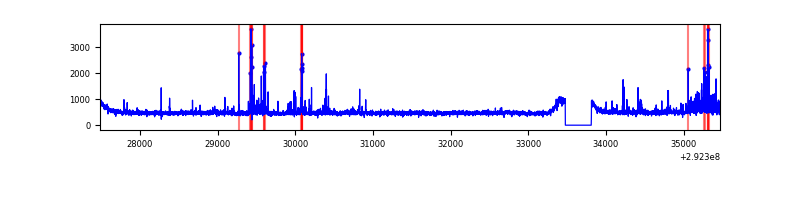 |
| C | 7985 | 7651 | 179 | 179 | 2.24% | 2.34% | 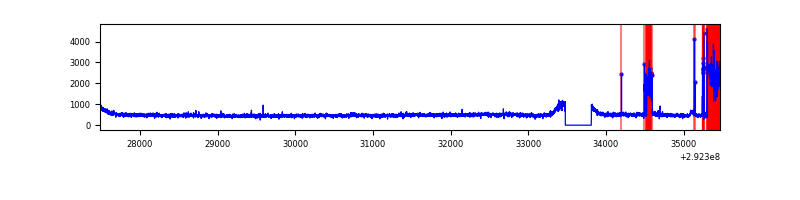 |
| D | 7985 | 7651 | 11 | 11 | 0.14% | 0.14% | 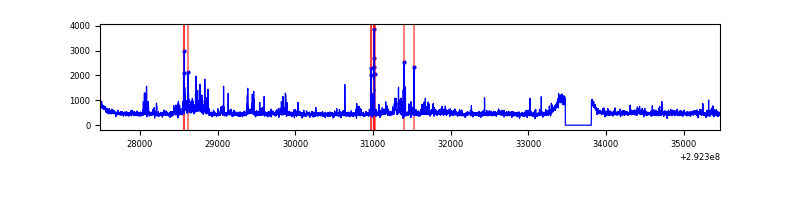 |
Top three noisy pixels from each quadrant. If the there are fewer than three noisy pixels in the level2.evt file, extra rows are filled as -1
| Pixel properties | Quadrant properties | ||||||
|---|---|---|---|---|---|---|---|
| Quadrant | DetID | PixID | Counts | Sigma | Mean | Median | Sigma |
| A | 13 | 254 | 8764 | 41.14 | 938 | 918 | 190.7 |
| A | 0 | 226 | 8154 | 37.94 | 938 | 918 | 190.7 |
| A | 3 | 137 | 7484 | 34.43 | 938 | 918 | 190.7 |
| B | 7 | 220 | 160499 | 878.98 | 933 | 907 | 181.6 |
| B | 3 | 112 | 110998 | 606.34 | 933 | 907 | 181.6 |
| B | 3 | 64 | 25000 | 132.7 | 933 | 907 | 181.6 |
| C | 9 | 54 | 562329 | 2660.86 | 893 | 899 | 211.0 |
| C | 14 | 238 | 136465 | 642.51 | 893 | 899 | 211.0 |
| C | 3 | 233 | 53463 | 249.12 | 893 | 899 | 211.0 |
| D | 7 | 238 | 398133 | 1772.8 | 919 | 893 | 224.1 |
| D | 2 | 234 | 38377 | 167.28 | 919 | 893 | 224.1 |
| D | 13 | 238 | 16289 | 68.71 | 919 | 893 | 224.1 |
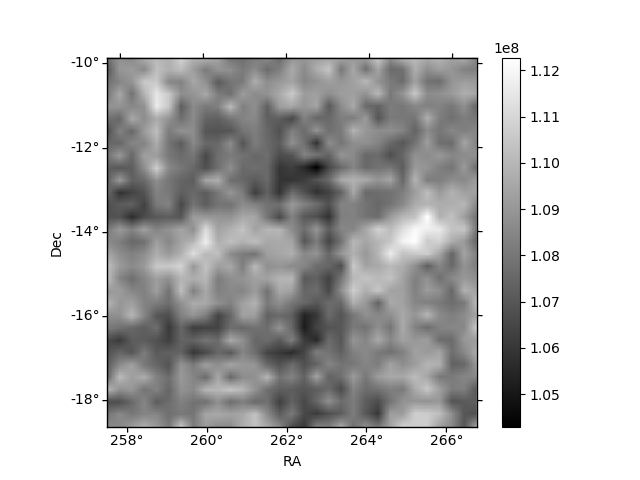
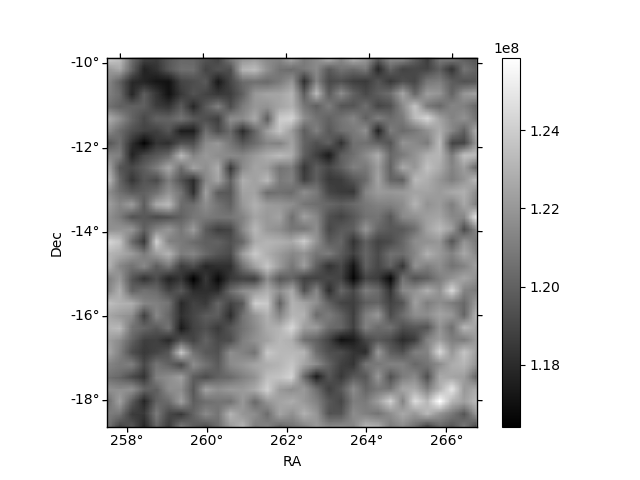
Histogram calculated using DETX and DETY for each event in the final _common_clean file
| Quadrant A | 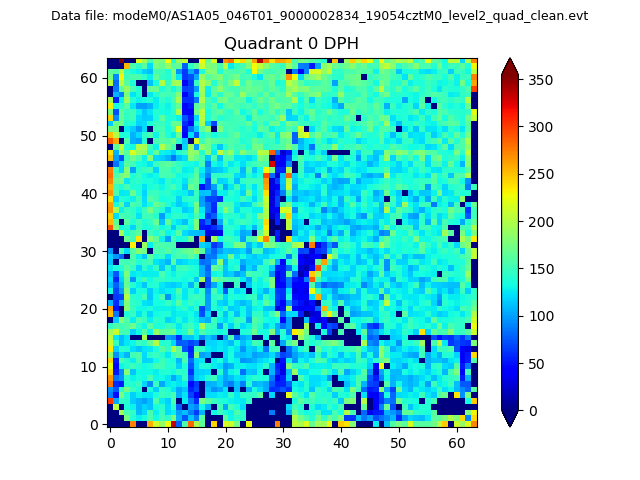 |
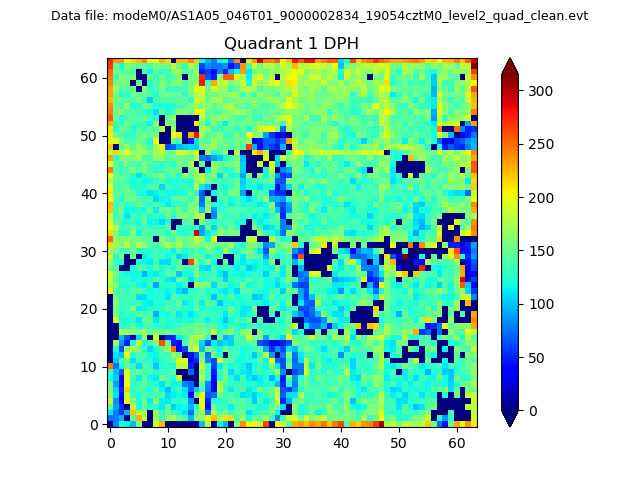 |
Quadrant B |
|---|---|---|---|
| Quadrant D | 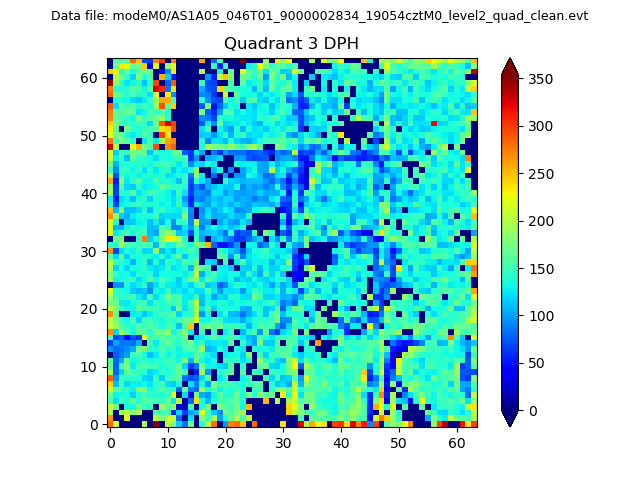 |
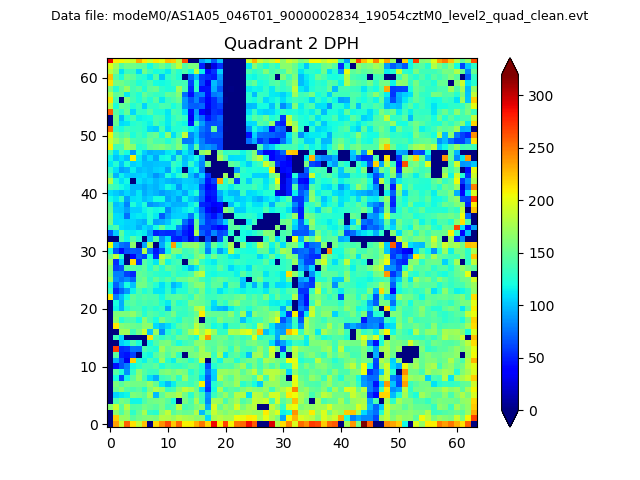 |
Quadrant C |
| Plot type | Count rate plots | Images |
|---|---|---|
| Comparison with Poisson distribution Blue bars denote a histogram of data divided into 1 sec bins. Red curve is a Poisson curve with rate = median count rate of data. |
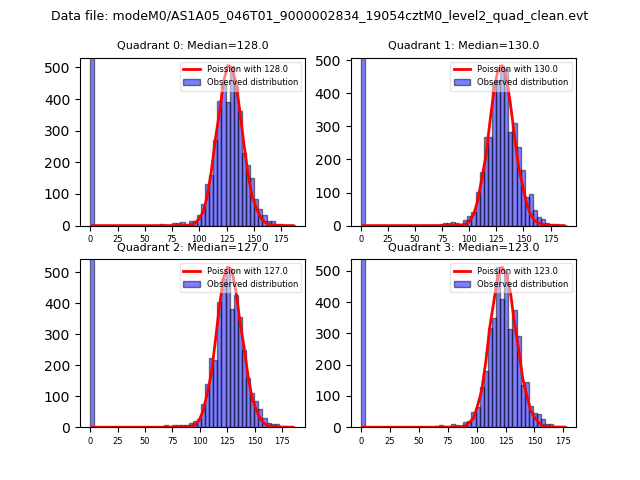 |
 |
| Quadrant-wise count rates Data is divided into 100 sec bins |
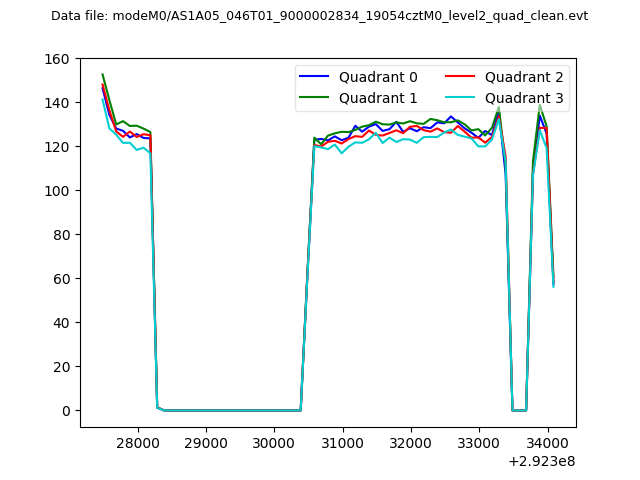 |
|
| Module-wise count rates for Quadrant A Data is divided into 100 sec bins |
 |
 |
| Module-wise count rates for Quadrant B Data is divided into 100 sec bins |
 |
 |
| Module-wise count rates for Quadrant C Data is divided into 100 sec bins |
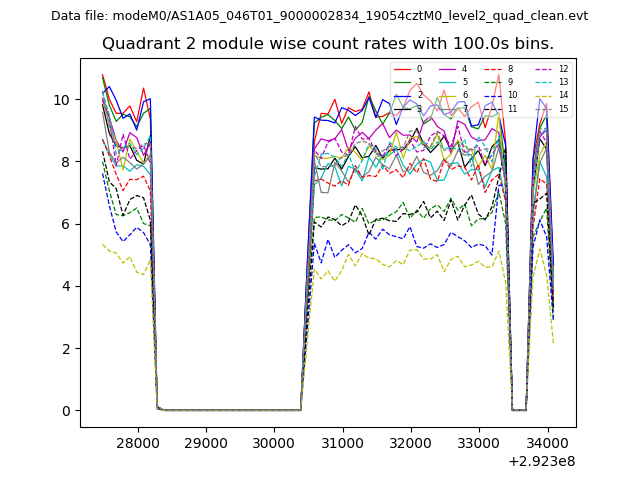 |
 |
| Module-wise count rates for Quadrant D Data is divided into 100 sec bins |
 |
 |
| Parameter | Plot |
|---|---|
| CZT HV Monitor | 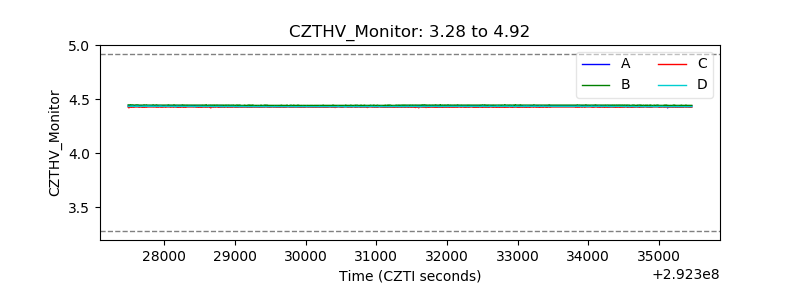 |
| D_VDD | 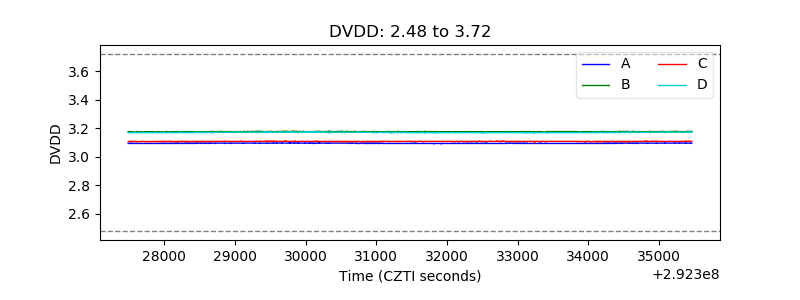 |
| Temperature 1 | 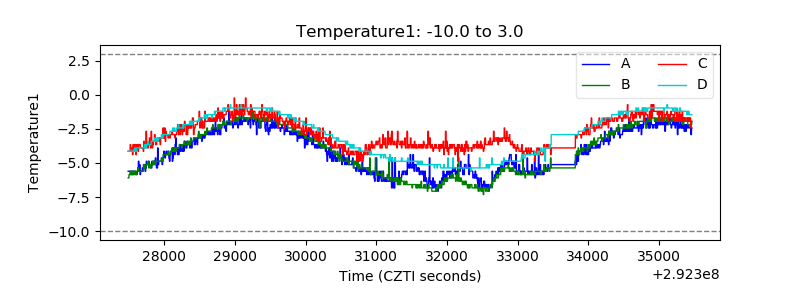 |
| Veto HV Monitor |  |
| Veto LLD | 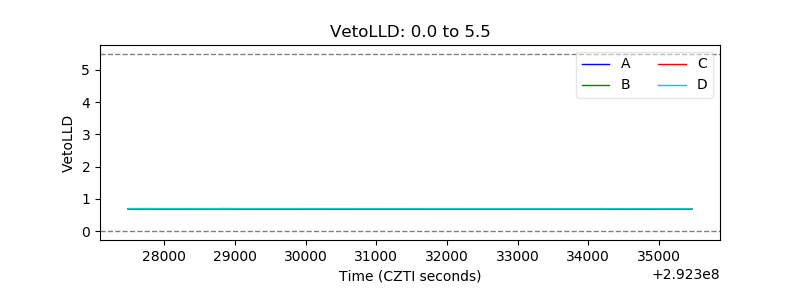 |
| Alpha Counter | 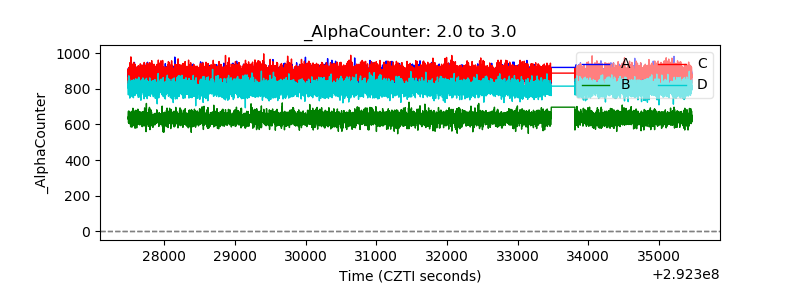 |
| _CPM_Rate | 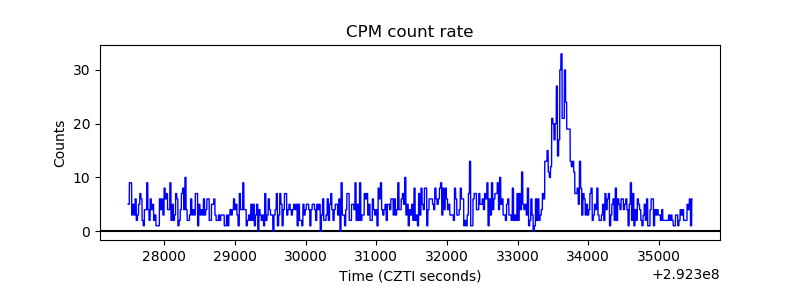 |
| CZT Counter |  |
| +2.5 Volts monitor | 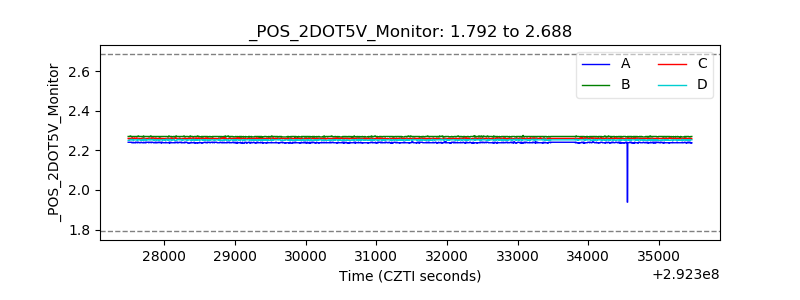 |
| +5 Volts monitor |  |
| _ROLL_ROT | 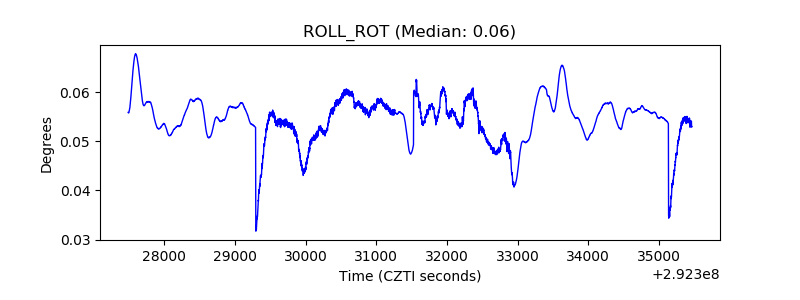 |
| _Roll_DEC | 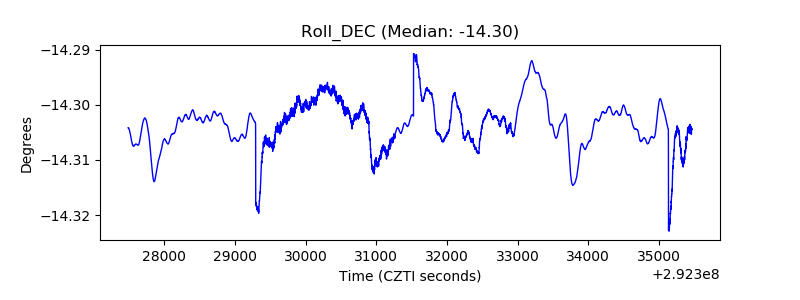 |
| _Roll_RA |  |
| Veto Counter | 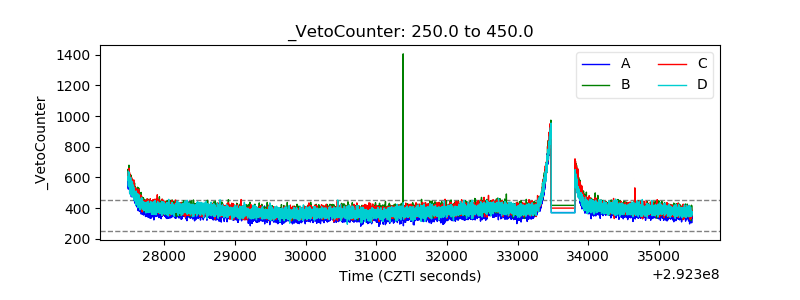 |