| Param | Original file | Final file |
|---|---|---|
| Filename | modeM0/AS1A05_046T01_9000002834_19062cztM0_level2.evt | modeM0/AS1A05_046T01_9000002834_19062cztM0_level2_quad_clean.evt |
| Size (bytes) | 485,127,360 | 106,845,120 |
| Size | 462.7 MB | 101.9 MB |
| Events in quadrant A | 3,160,012 | 701,367 |
| Events in quadrant B | 3,438,006 | 732,876 |
| Events in quadrant C | 3,296,625 | 705,754 |
| Events in quadrant D | 4,376,263 | 662,688 |
| Mode SS | |||
|---|---|---|---|
| Quadrant | BADHDUFLAG | Total packets | Discarded packets |
| A | 0 | 128 | 0 |
| B | 0 | 128 | 0 |
| C | 0 | 128 | 0 |
| D | 0 | 128 | 0 |
| Mode M0 | |||
|---|---|---|---|
| Quadrant | BADHDUFLAG | Total packets | Discarded packets |
| A | 0 | 13227 | 2 |
| B | 0 | 14066 | 2 |
| C | 0 | 13587 | 2 |
| D | 0 | 17039 | 2 |
| Mode M9 | |||
|---|---|---|---|
| Quadrant | BADHDUFLAG | Total packets | Discarded packets |
| A | 0 | 26 | 0 |
| B | 0 | 26 | 0 |
| C | 0 | 26 | 0 |
| D | 0 | 26 | 0 |
| Quadrant | Total seconds | Saturated seconds | Saturation percentage |
|---|---|---|---|
| A | 6208 | 47 | 0.757088% |
| B | 6208 | 136 | 2.190722% |
| C | 6209 | 90 | 1.449509% |
| D | 6208 | 201 | 3.237758% |
Noise dominated data is calculated using 1-second bins in cleaned event files. If a bin has >2000 counts, and if more than 50% of those come from <1% of pixels, then it is considered to be noise-dominated and hence unusable.
| Quadrant | # 1 sec bins | Bins with >0 counts | Bins with >2000 counts | High rate bins dominated by noise | Noise dominated (total time) | Noise dominated (detector-on time) | Marked lightcurve |
|---|---|---|---|---|---|---|---|
| A | 8778 | 6210 | 0 | 0 | 0.00% | 0.00% | 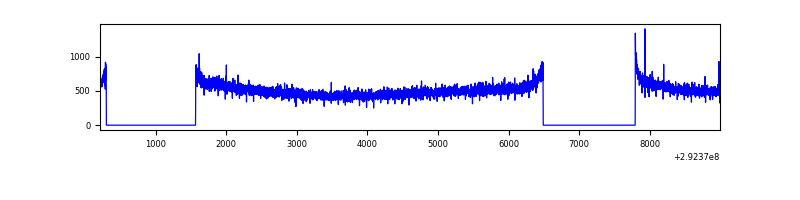 |
| B | 8778 | 6210 | 29 | 29 | 0.33% | 0.47% | 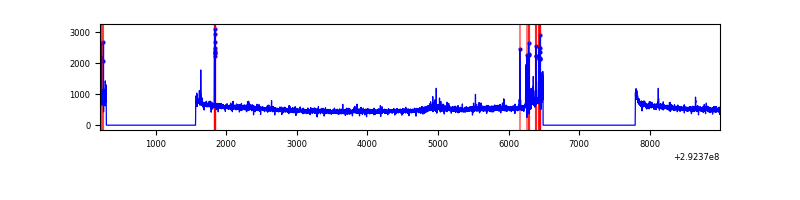 |
| C | 8779 | 6211 | 0 | 0 | 0.00% | 0.00% | 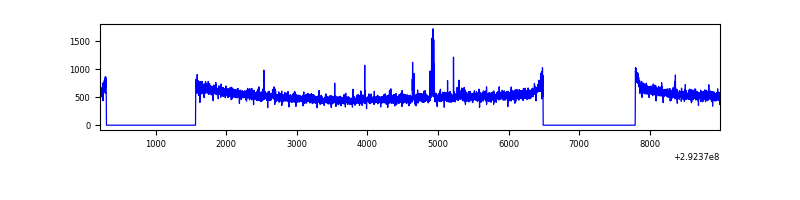 |
| D | 8778 | 6210 | 160 | 160 | 1.82% | 2.58% | 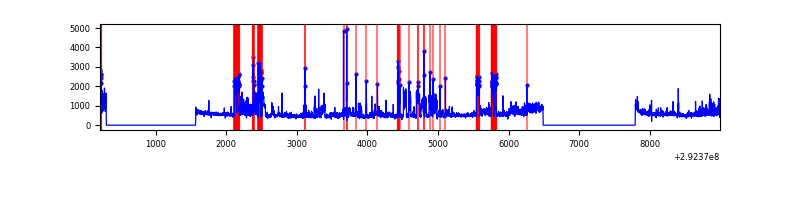 |
Top three noisy pixels from each quadrant. If the there are fewer than three noisy pixels in the level2.evt file, extra rows are filled as -1
| Pixel properties | Quadrant properties | ||||||
|---|---|---|---|---|---|---|---|
| Quadrant | DetID | PixID | Counts | Sigma | Mean | Median | Sigma |
| A | 13 | 254 | 7173 | 38.58 | 820 | 804 | 165.1 |
| A | 0 | 226 | 7026 | 37.69 | 820 | 804 | 165.1 |
| A | 3 | 137 | 6006 | 31.51 | 820 | 804 | 165.1 |
| B | 7 | 220 | 119429 | 771.24 | 826 | 808 | 153.8 |
| B | 3 | 112 | 34403 | 218.42 | 826 | 808 | 153.8 |
| B | 0 | 189 | 29240 | 184.86 | 826 | 808 | 153.8 |
| C | 14 | 238 | 125444 | 667.76 | 803 | 811 | 186.6 |
| C | 3 | 233 | 37533 | 196.75 | 803 | 811 | 186.6 |
| C | 13 | 61 | 5565 | 25.47 | 803 | 811 | 186.6 |
| D | 1 | 20 | 1134829 | 5952.76 | 792 | 772 | 190.5 |
| D | 1 | 52 | 155339 | 811.33 | 792 | 772 | 190.5 |
| D | 10 | 253 | 30956 | 158.44 | 792 | 772 | 190.5 |
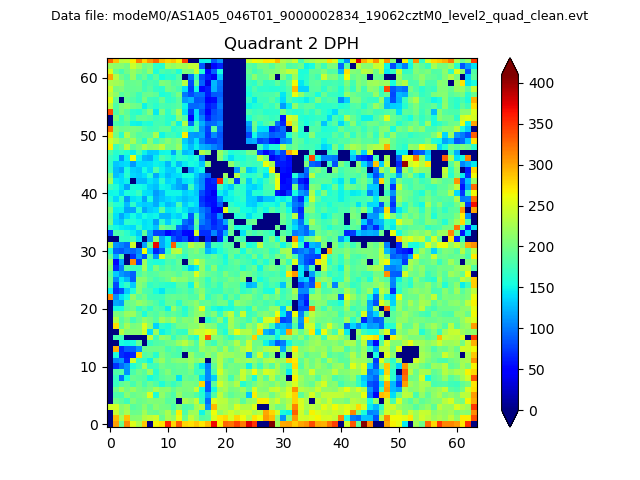
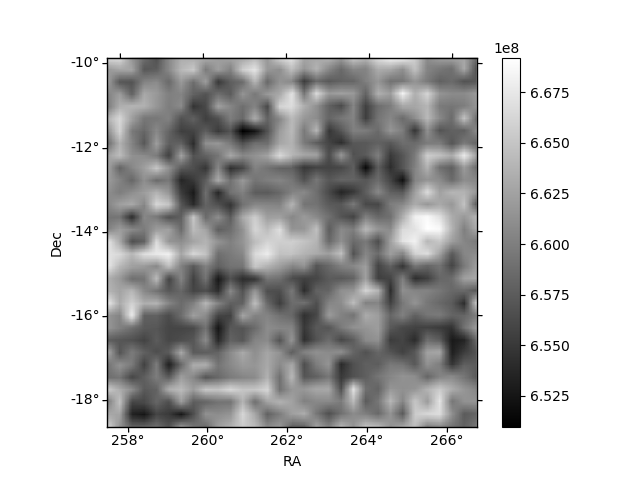
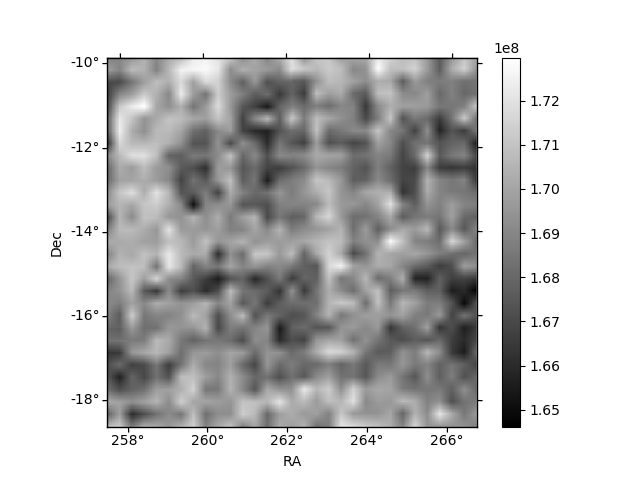
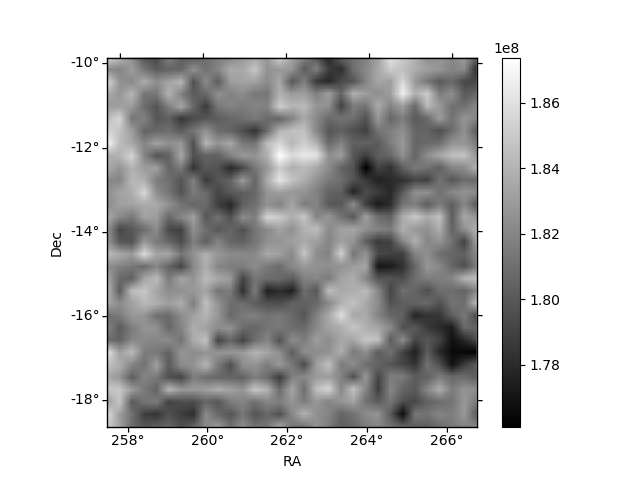
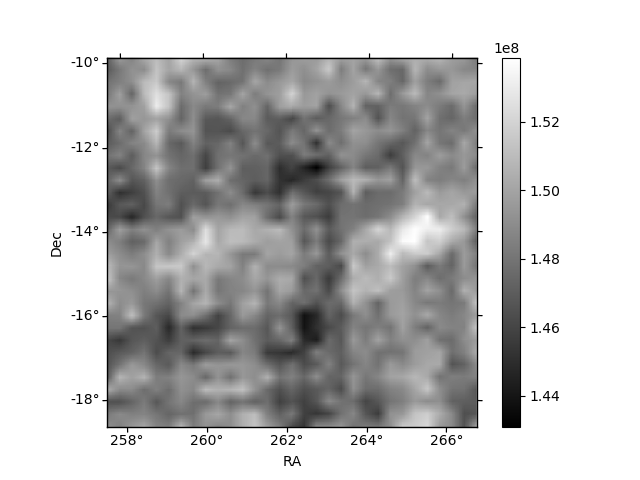
Histogram calculated using DETX and DETY for each event in the final _common_clean file
| Quadrant A | 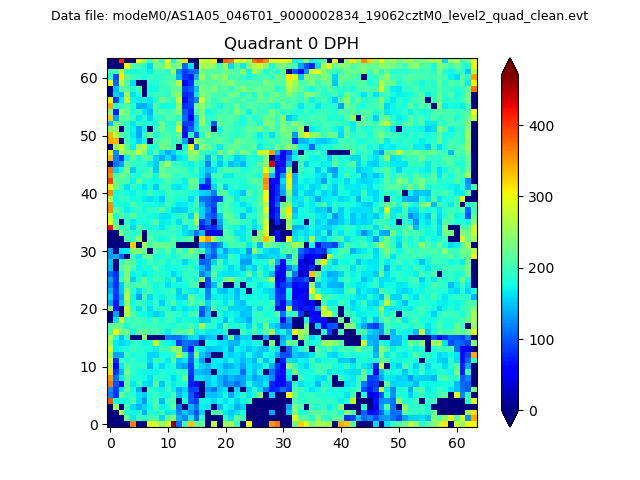 |
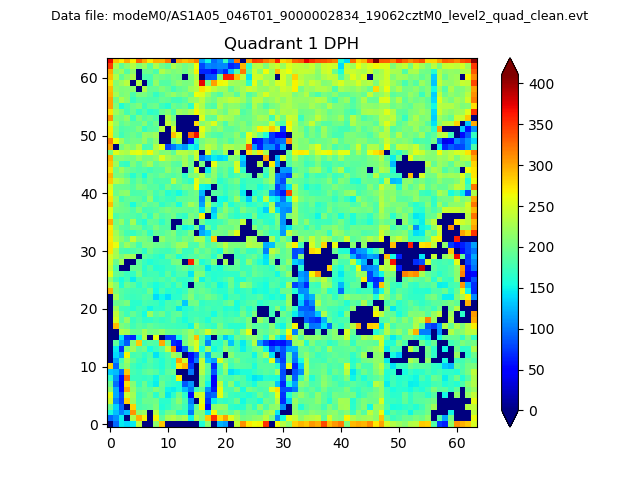 |
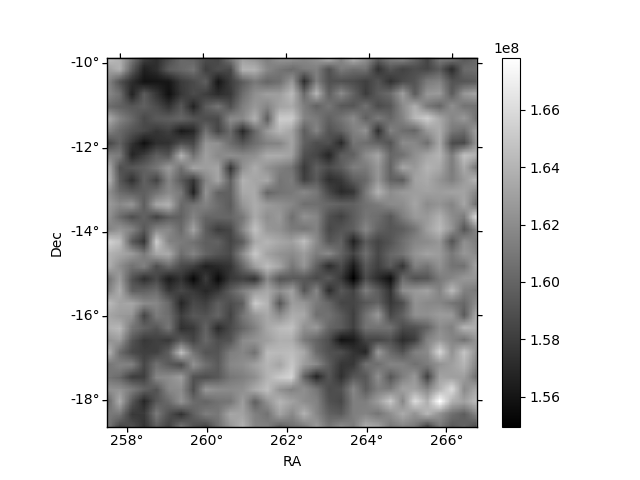
Quadrant B |
|---|---|---|---|
| Quadrant D | 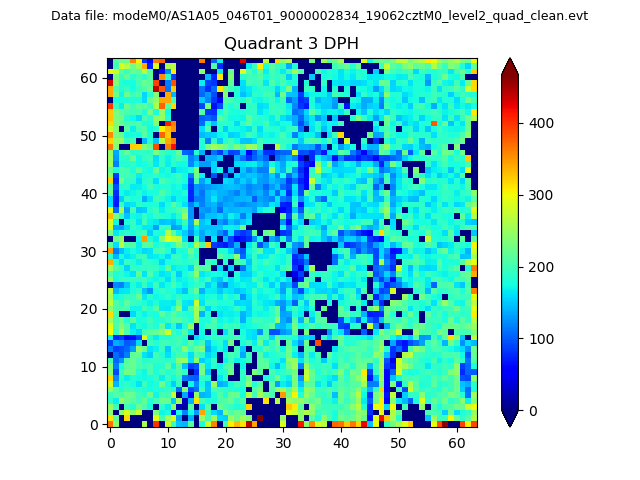 |
 |
Quadrant C |
| Plot type | Count rate plots | Images |
|---|---|---|
| Comparison with Poisson distribution Blue bars denote a histogram of data divided into 1 sec bins. Red curve is a Poisson curve with rate = median count rate of data. |
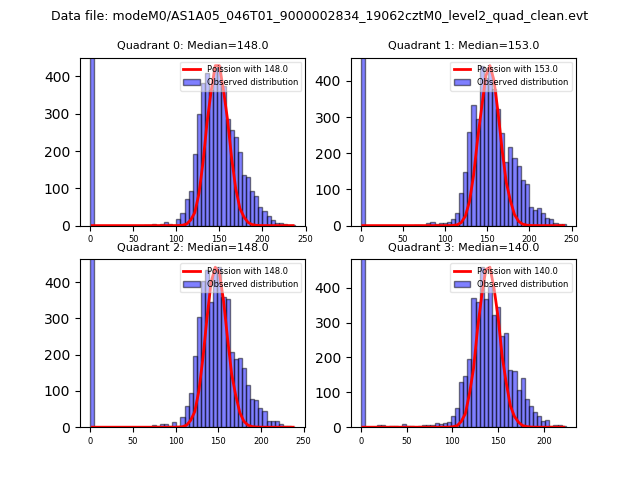 |
 |
| Quadrant-wise count rates Data is divided into 100 sec bins |
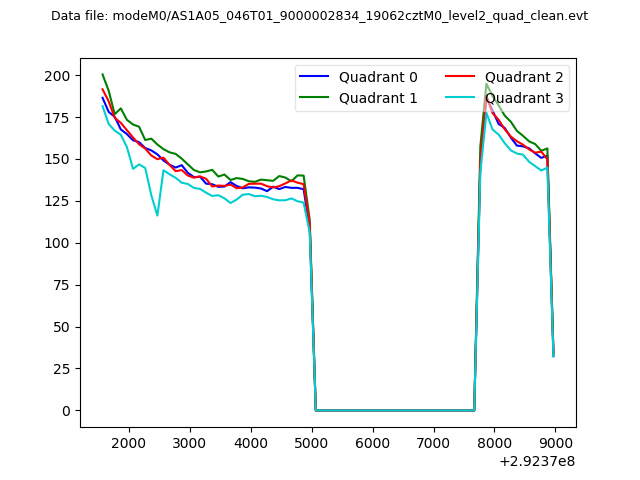 |
|
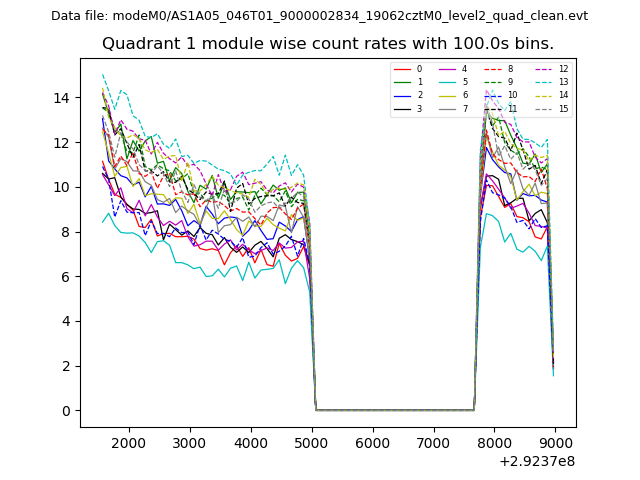
| Module-wise count rates for Quadrant A Data is divided into 100 sec bins |
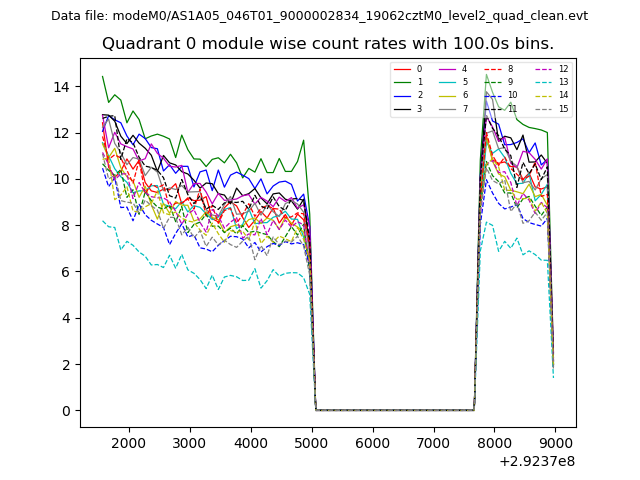 |
 |
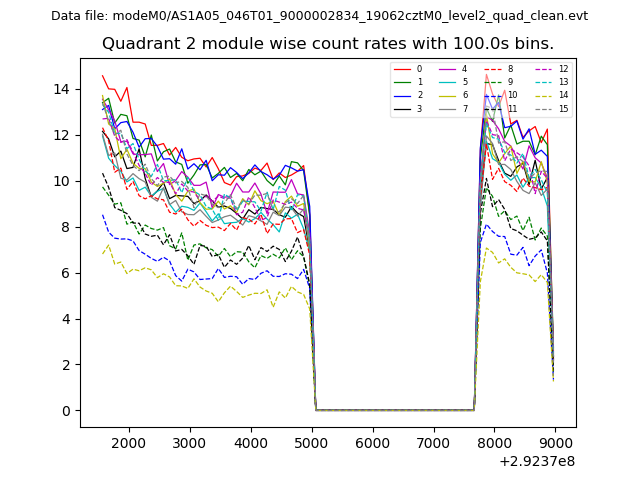
| Module-wise count rates for Quadrant B Data is divided into 100 sec bins |
 |
 |
| Module-wise count rates for Quadrant C Data is divided into 100 sec bins |
 |
 |
| Module-wise count rates for Quadrant D Data is divided into 100 sec bins |
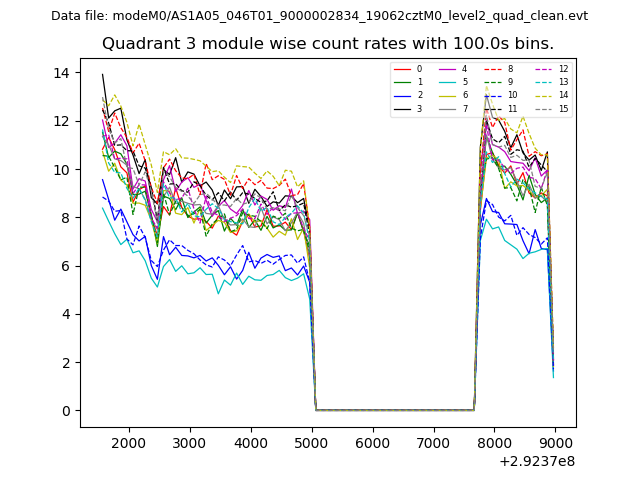 |
 |
| Parameter | Plot |
|---|---|
| CZT HV Monitor | 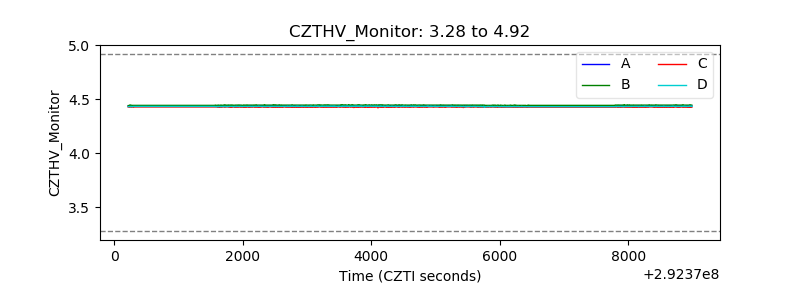 |
| D_VDD | 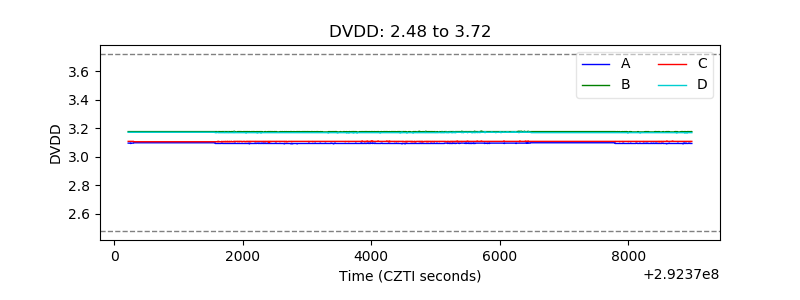 |
| Temperature 1 | 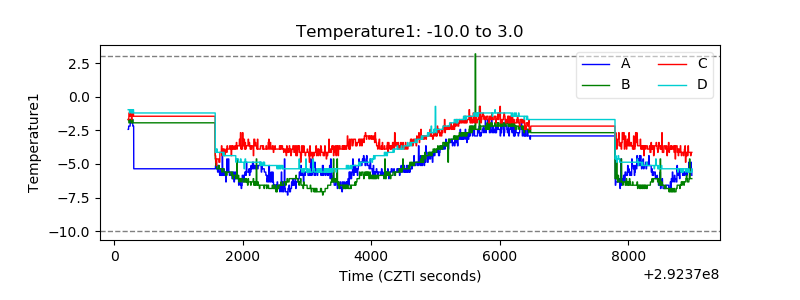 |
| Veto HV Monitor | 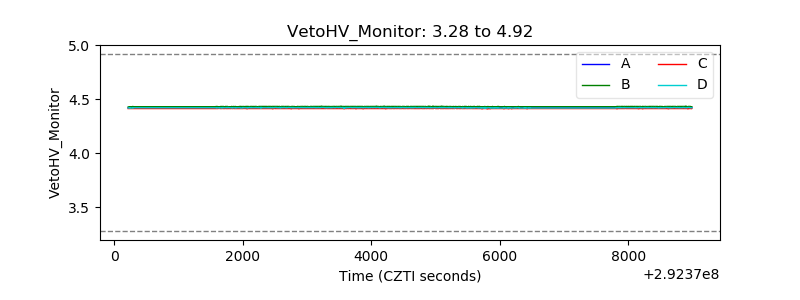 |
| Veto LLD | 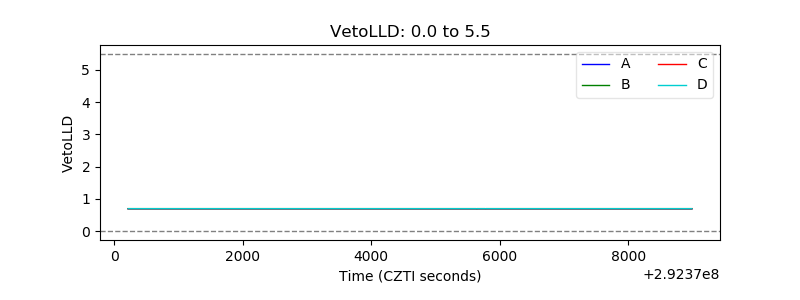 |
| Alpha Counter | 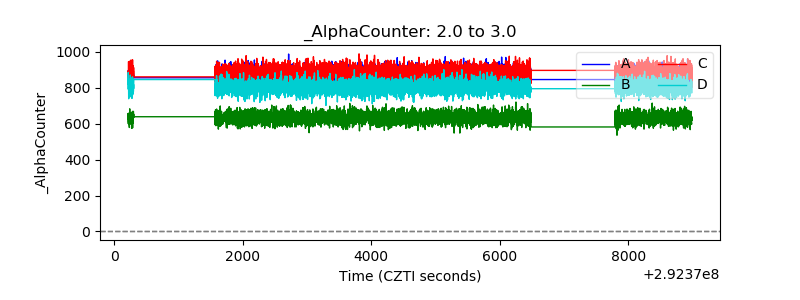 |
| _CPM_Rate | 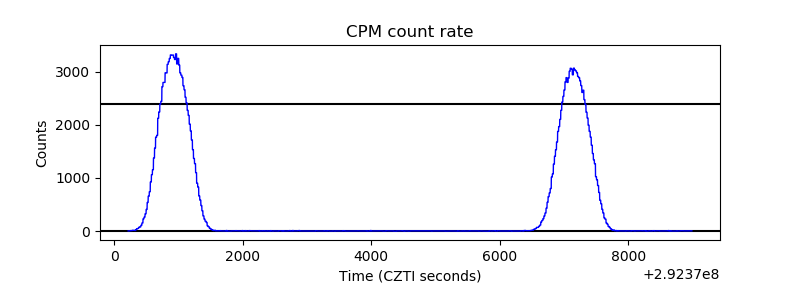 |
| CZT Counter | 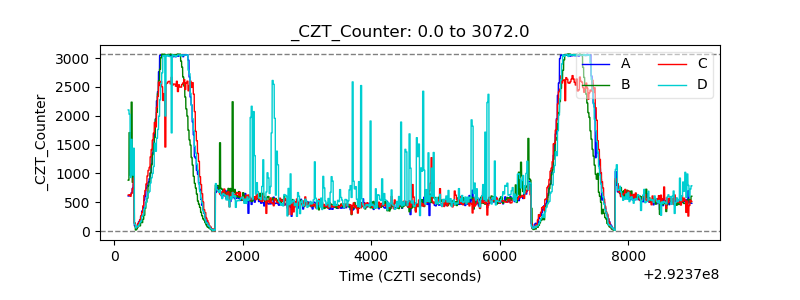 |
| +2.5 Volts monitor |  |
| +5 Volts monitor |  |
| _ROLL_ROT | 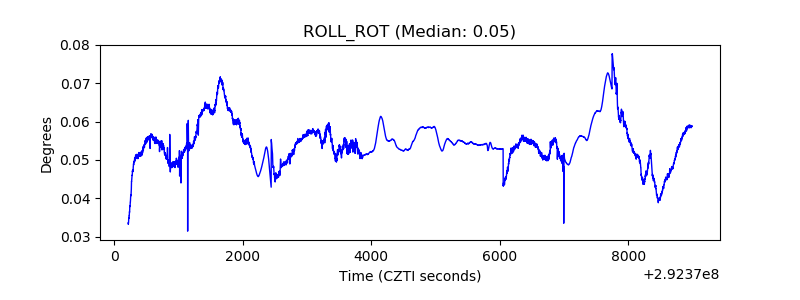 |
| _Roll_DEC | 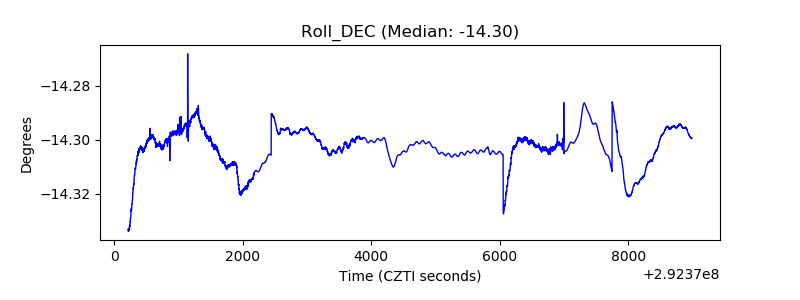 |
| _Roll_RA | 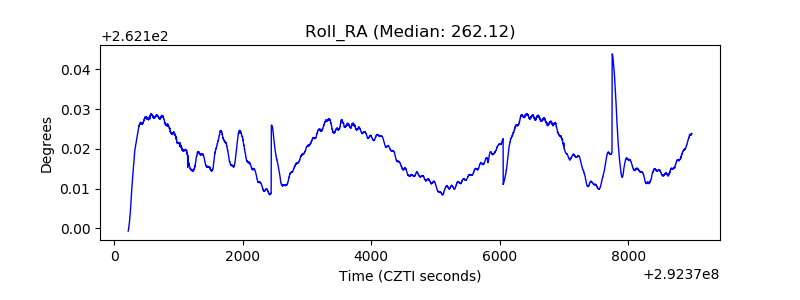 |
| Veto Counter | 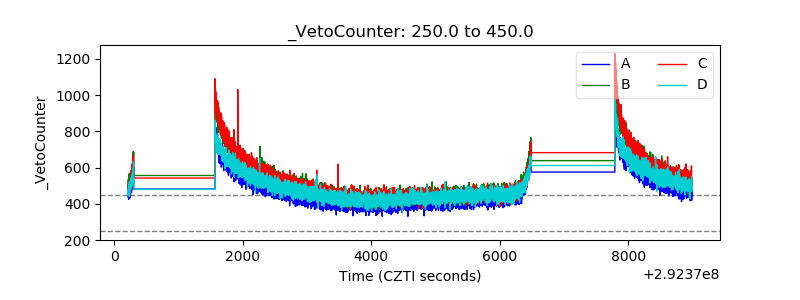 |