| Param | Original file | Final file |
|---|---|---|
| Filename | modeM0/AS1A05_046T01_9000002834_19063cztM0_level2.evt | modeM0/AS1A05_046T01_9000002834_19063cztM0_level2_quad_clean.evt |
| Size (bytes) | 551,903,040 | 108,616,320 |
| Size | 526.3 MB | 103.6 MB |
| Events in quadrant A | 3,326,766 | 715,673 |
| Events in quadrant B | 3,599,593 | 744,264 |
| Events in quadrant C | 3,447,531 | 717,963 |
| Events in quadrant D | 5,892,658 | 650,654 |
| Mode SS | |||
|---|---|---|---|
| Quadrant | BADHDUFLAG | Total packets | Discarded packets |
| A | 0 | 136 | 0 |
| B | 0 | 136 | 0 |
| C | 0 | 136 | 0 |
| D | 0 | 136 | 0 |
| Mode M0 | |||
|---|---|---|---|
| Quadrant | BADHDUFLAG | Total packets | Discarded packets |
| A | 0 | 13897 | 2 |
| B | 0 | 14773 | 2 |
| C | 0 | 14175 | 2 |
| D | 0 | 22178 | 2 |
| Mode M9 | |||
|---|---|---|---|
| Quadrant | BADHDUFLAG | Total packets | Discarded packets |
| A | 0 | 27 | 0 |
| B | 0 | 27 | 0 |
| C | 0 | 27 | 0 |
| D | 0 | 27 | 0 |
| Quadrant | Total seconds | Saturated seconds | Saturation percentage |
|---|---|---|---|
| A | 6610 | 34 | 0.514372% |
| B | 6610 | 87 | 1.316188% |
| C | 6611 | 71 | 1.073968% |
| D | 6611 | 494 | 7.472394% |
Noise dominated data is calculated using 1-second bins in cleaned event files. If a bin has >2000 counts, and if more than 50% of those come from <1% of pixels, then it is considered to be noise-dominated and hence unusable.
| Quadrant | # 1 sec bins | Bins with >0 counts | Bins with >2000 counts | High rate bins dominated by noise | Noise dominated (total time) | Noise dominated (detector-on time) | Marked lightcurve |
|---|---|---|---|---|---|---|---|
| A | 9255 | 6612 | 1 | 1 | 0.01% | 0.02% | 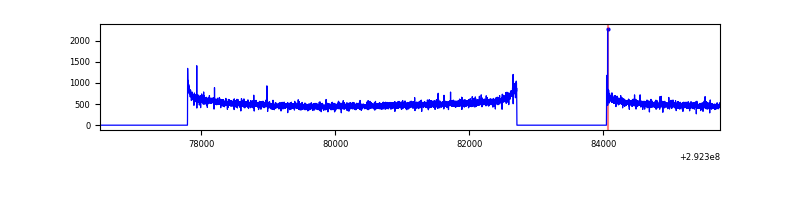 |
| B | 9255 | 6612 | 6 | 6 | 0.06% | 0.09% | 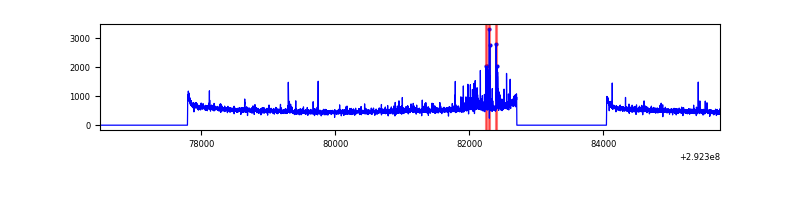 |
| C | 9256 | 6613 | 0 | 0 | 0.00% | 0.00% |  |
| D | 9256 | 6613 | 500 | 500 | 5.40% | 7.56% | 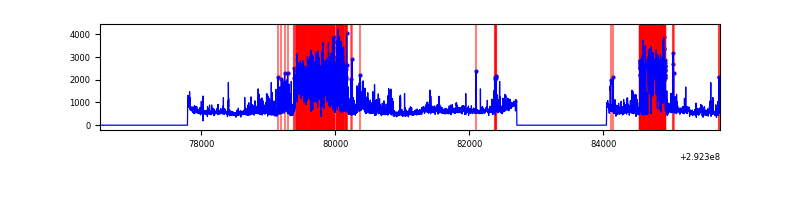 |
Top three noisy pixels from each quadrant. If the there are fewer than three noisy pixels in the level2.evt file, extra rows are filled as -1
| Pixel properties | Quadrant properties | ||||||
|---|---|---|---|---|---|---|---|
| Quadrant | DetID | PixID | Counts | Sigma | Mean | Median | Sigma |
| A | 13 | 254 | 7681 | 39.58 | 863 | 848 | 172.6 |
| A | 0 | 226 | 7434 | 38.15 | 863 | 848 | 172.6 |
| A | 3 | 137 | 6268 | 31.4 | 863 | 848 | 172.6 |
| B | 7 | 220 | 86084 | 522.04 | 870 | 851 | 163.3 |
| B | 3 | 112 | 75692 | 458.39 | 870 | 851 | 163.3 |
| B | 0 | 189 | 19981 | 117.17 | 870 | 851 | 163.3 |
| C | 14 | 238 | 132164 | 668.23 | 844 | 854 | 196.5 |
| C | 3 | 233 | 17031 | 82.32 | 844 | 854 | 196.5 |
| C | 9 | 54 | 7051 | 31.54 | 844 | 854 | 196.5 |
| D | 1 | 20 | 2621681 | 13261.11 | 823 | 804 | 197.6 |
| D | 1 | 52 | 93513 | 469.09 | 823 | 804 | 197.6 |
| D | 7 | 238 | 32545 | 160.6 | 823 | 804 | 197.6 |
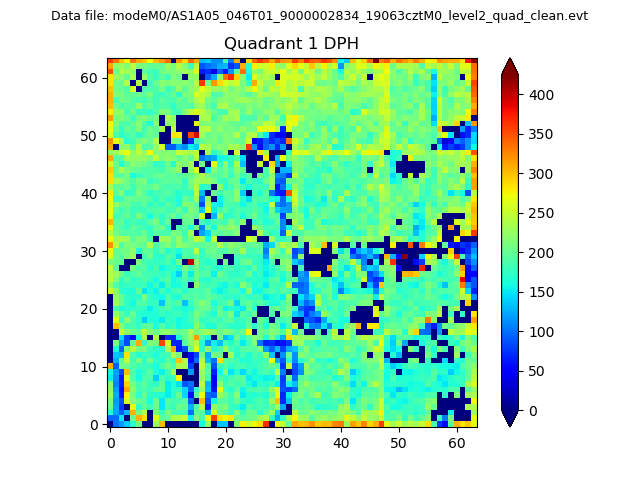
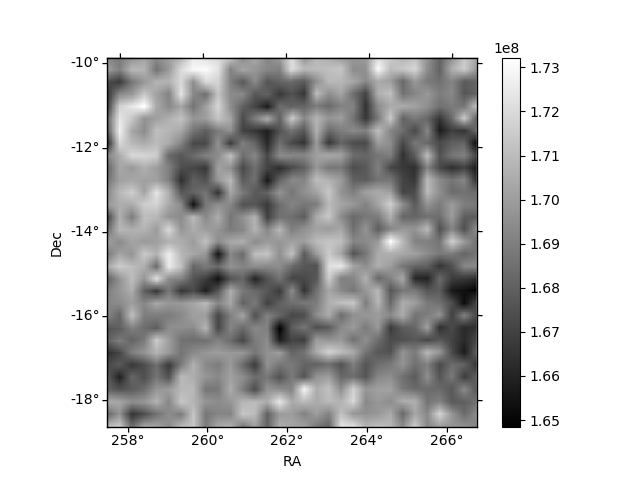
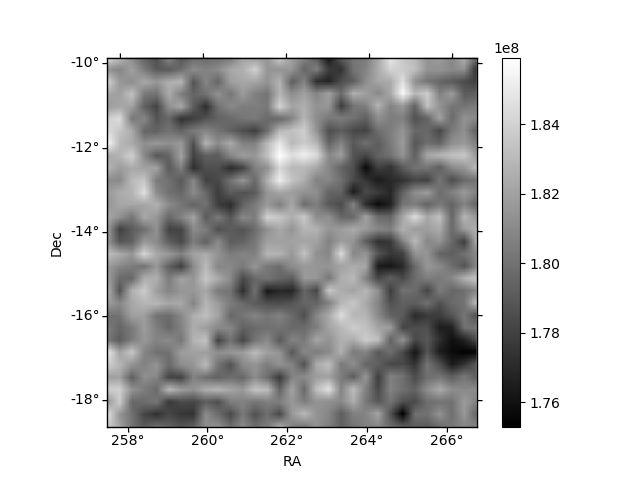
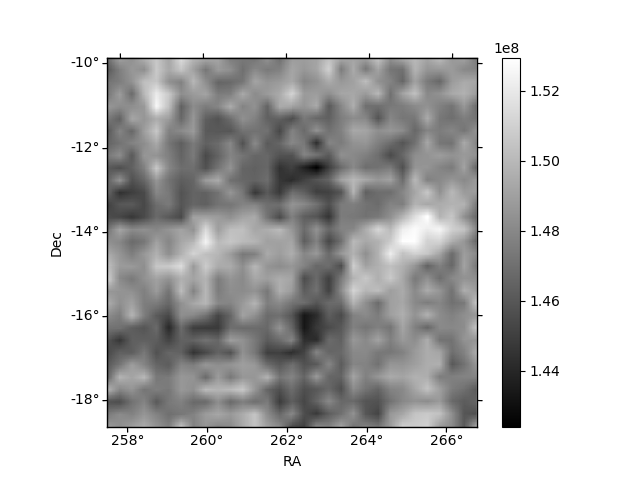
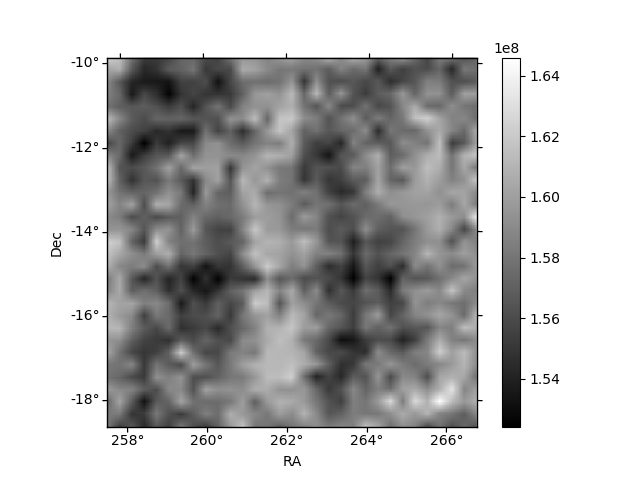
Histogram calculated using DETX and DETY for each event in the final _common_clean file
| Quadrant A | 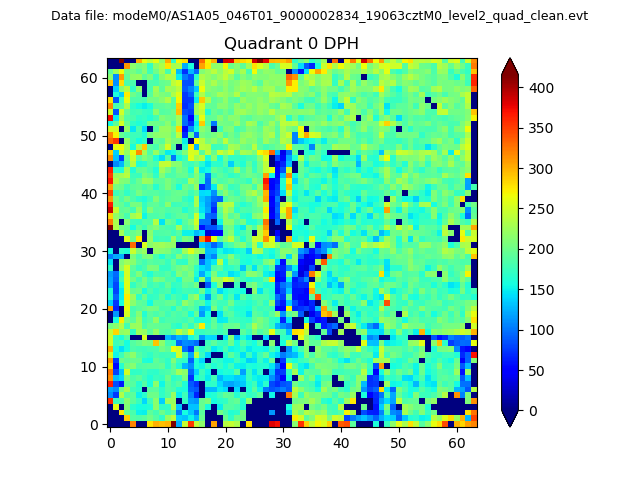 |
 |
Quadrant B |
|---|---|---|---|
| Quadrant D | 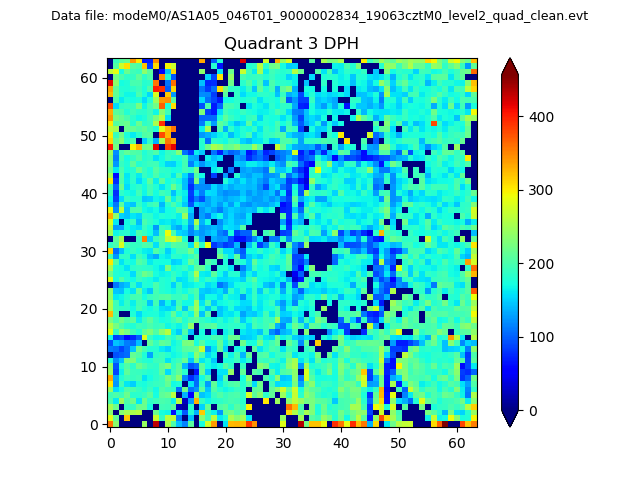 |
 |
Quadrant C |
| Plot type | Count rate plots | Images |
|---|---|---|
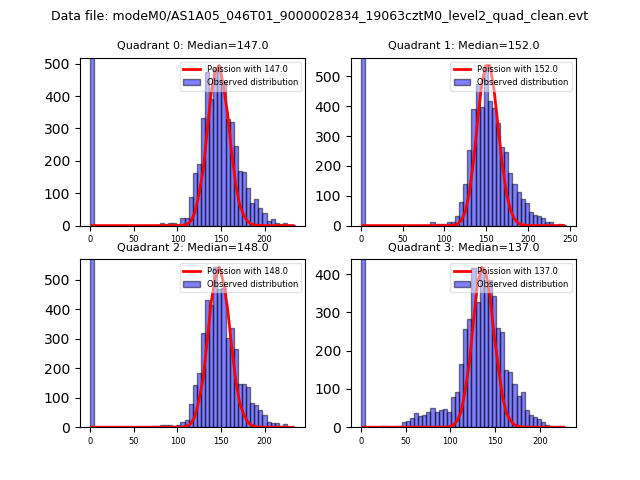
| Comparison with Poisson distribution Blue bars denote a histogram of data divided into 1 sec bins. Red curve is a Poisson curve with rate = median count rate of data. |
 |
 |
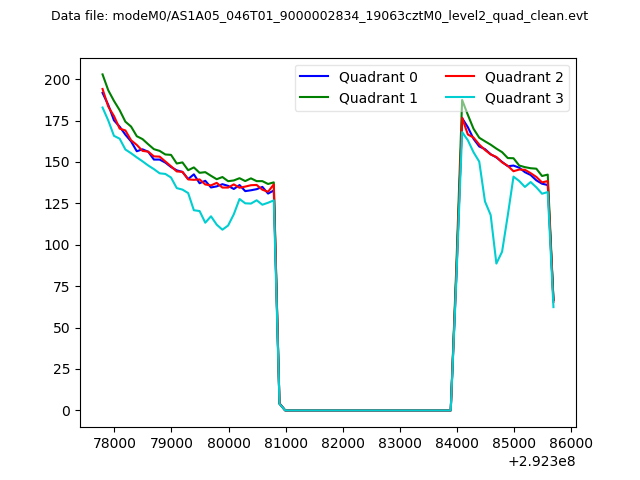
| Quadrant-wise count rates Data is divided into 100 sec bins |
 |
|
| Module-wise count rates for Quadrant A Data is divided into 100 sec bins |
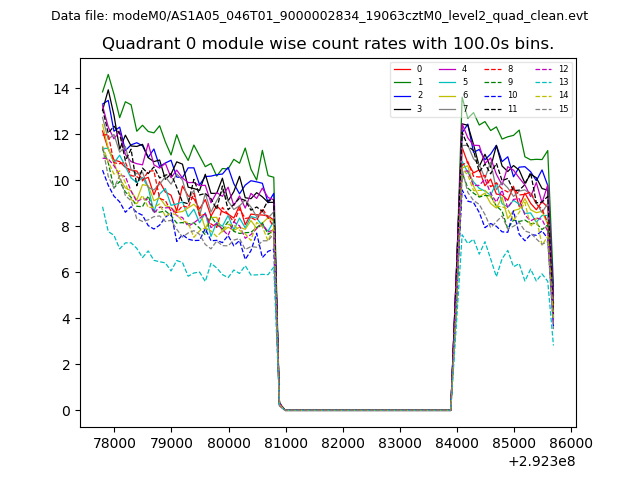 |
 |
| Module-wise count rates for Quadrant B Data is divided into 100 sec bins |
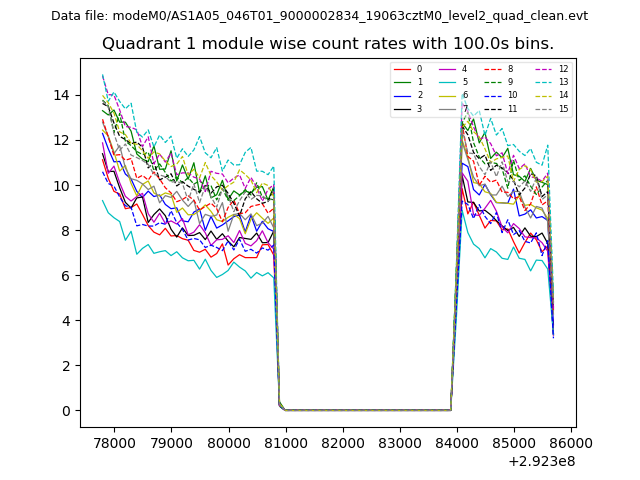 |
 |
| Module-wise count rates for Quadrant C Data is divided into 100 sec bins |
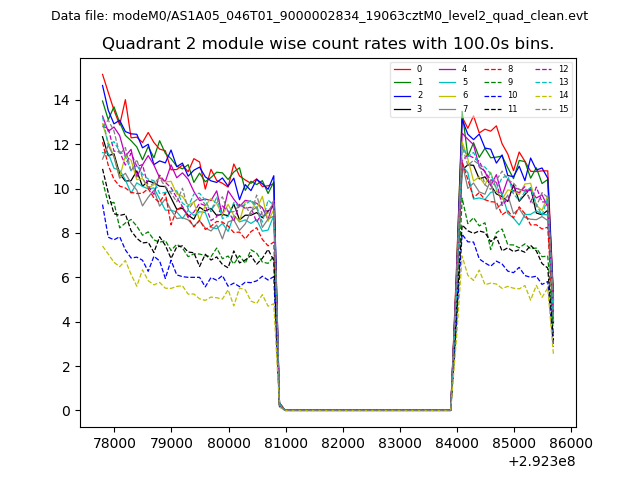 |
 |
| Module-wise count rates for Quadrant D Data is divided into 100 sec bins |
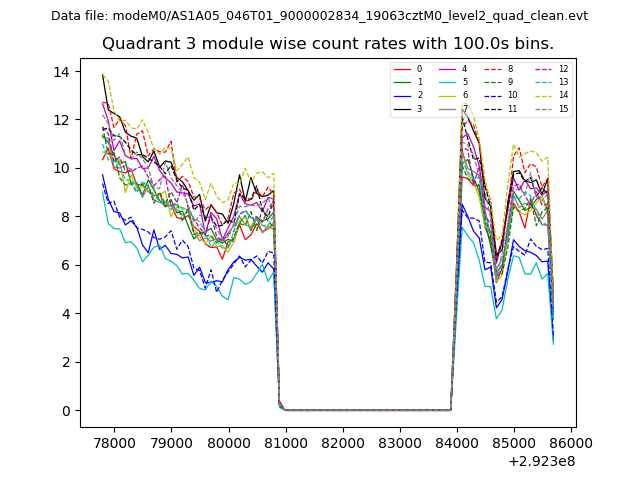 |
 |
| Parameter | Plot |
|---|---|
| CZT HV Monitor | 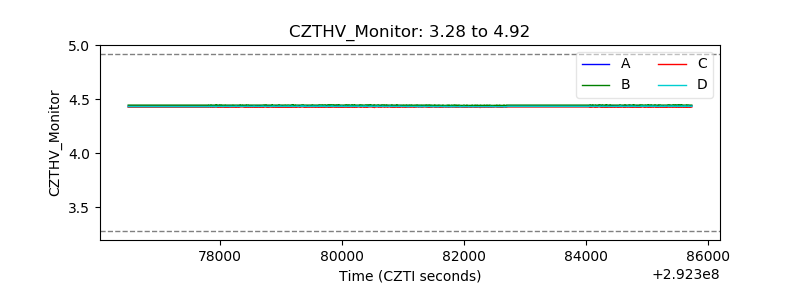 |
| D_VDD | 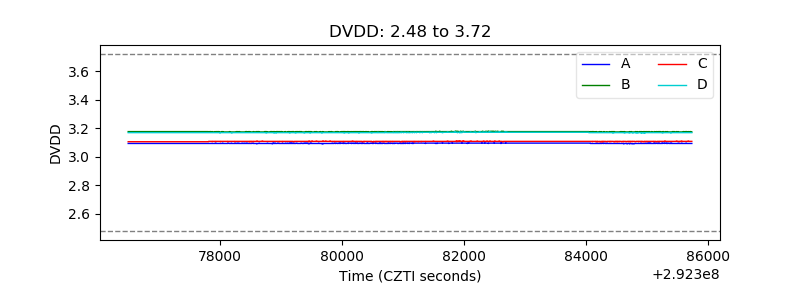 |
| Temperature 1 | 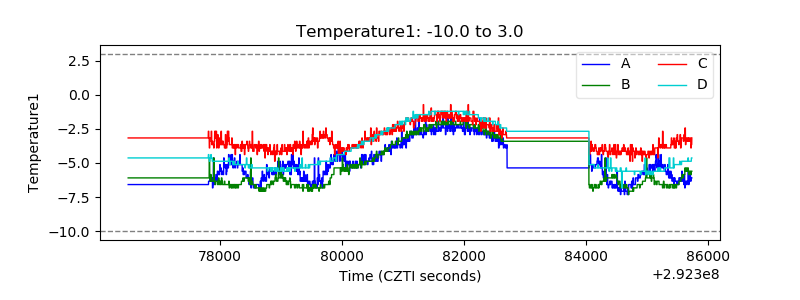 |
| Veto HV Monitor |  |
| Veto LLD | 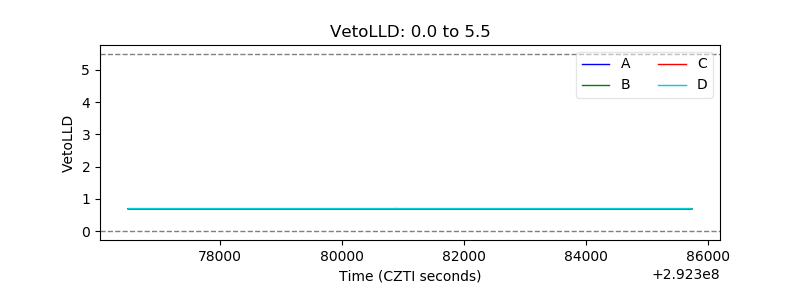 |
| Alpha Counter | 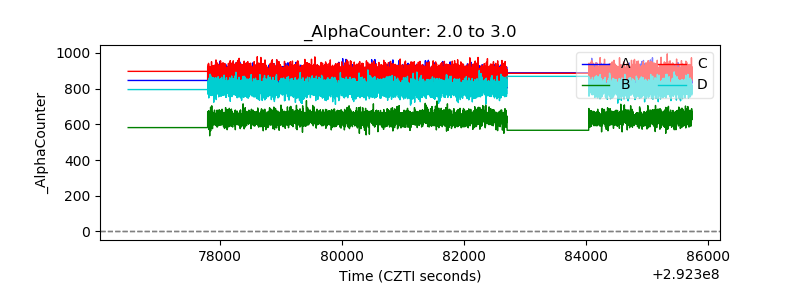 |
| _CPM_Rate | 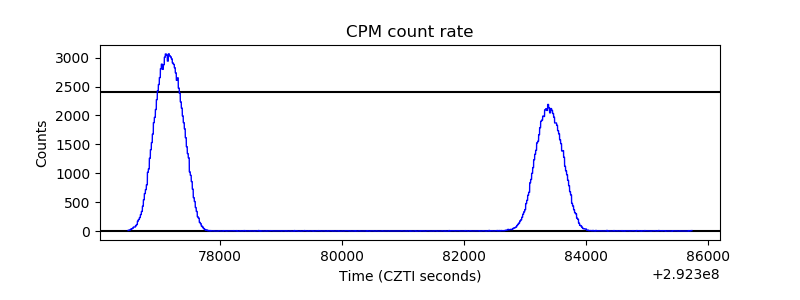 |
| CZT Counter |  |
| +2.5 Volts monitor |  |
| +5 Volts monitor | 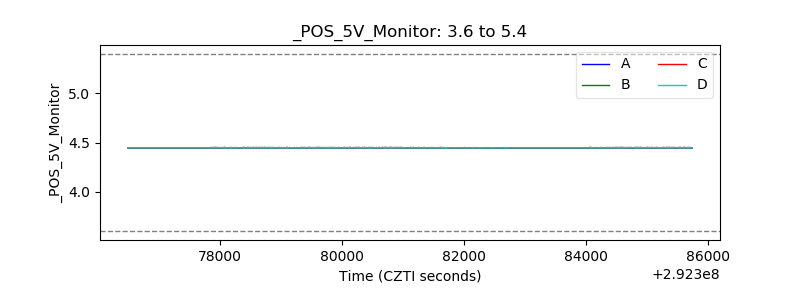 |
| _ROLL_ROT | 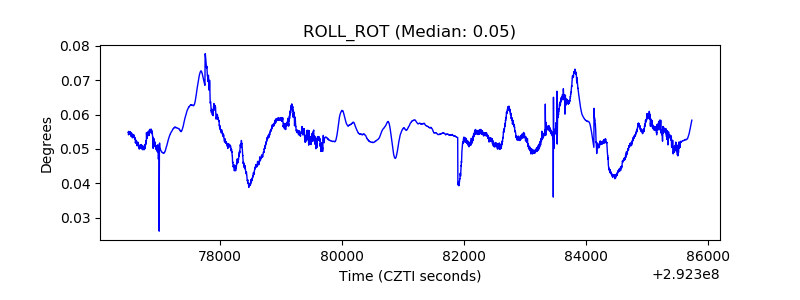 |
| _Roll_DEC | 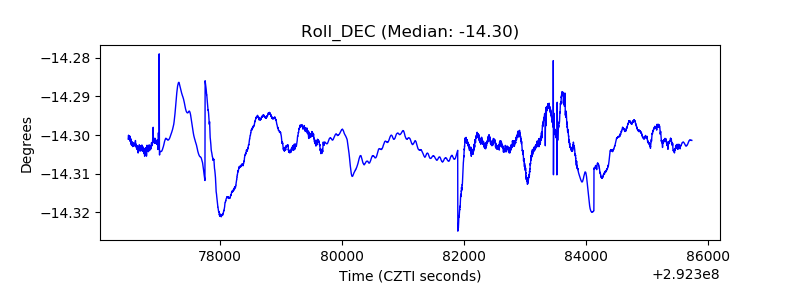 |
| _Roll_RA |  |
| Veto Counter | 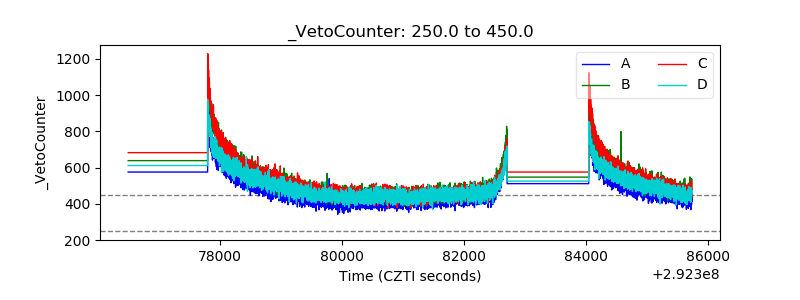 |