| Param | Original file | Final file |
|---|---|---|
| Filename | modeM0/AS1A05_046T01_9000002834_19064cztM0_level2.evt | modeM0/AS1A05_046T01_9000002834_19064cztM0_level2_quad_clean.evt |
| Size (bytes) | 554,999,040 | 98,591,040 |
| Size | 529.3 MB | 94.0 MB |
| Events in quadrant A | 3,316,503 | 639,529 |
| Events in quadrant B | 3,650,008 | 656,452 |
| Events in quadrant C | 3,400,697 | 638,528 |
| Events in quadrant D | 5,987,828 | 585,159 |
| Mode SS | |||
|---|---|---|---|
| Quadrant | BADHDUFLAG | Total packets | Discarded packets |
| A | 0 | 134 | 0 |
| B | 0 | 134 | 0 |
| C | 0 | 134 | 0 |
| D | 0 | 134 | 0 |
| Mode M0 | |||
|---|---|---|---|
| Quadrant | BADHDUFLAG | Total packets | Discarded packets |
| A | 0 | 13994 | 3 |
| B | 0 | 15000 | 2 |
| C | 0 | 14109 | 2 |
| D | 0 | 22373 | 2 |
| Mode M9 | |||
|---|---|---|---|
| Quadrant | BADHDUFLAG | Total packets | Discarded packets |
| A | 0 | 17 | 0 |
| B | 0 | 17 | 0 |
| C | 0 | 18 | 0 |
| D | 0 | 18 | 0 |
| Quadrant | Total seconds | Saturated seconds | Saturation percentage |
|---|---|---|---|
| A | 6691 | 58 | 0.866836% |
| B | 6691 | 136 | 2.032581% |
| C | 6691 | 75 | 1.120909% |
| D | 6691 | 491 | 7.338216% |
Noise dominated data is calculated using 1-second bins in cleaned event files. If a bin has >2000 counts, and if more than 50% of those come from <1% of pixels, then it is considered to be noise-dominated and hence unusable.
| Quadrant | # 1 sec bins | Bins with >0 counts | Bins with >2000 counts | High rate bins dominated by noise | Noise dominated (total time) | Noise dominated (detector-on time) | Marked lightcurve |
|---|---|---|---|---|---|---|---|
| A | 7931 | 6692 | 1 | 1 | 0.01% | 0.01% | 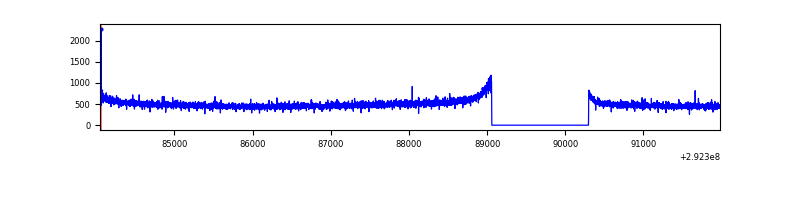 |
| B | 7931 | 6692 | 18 | 18 | 0.23% | 0.27% | 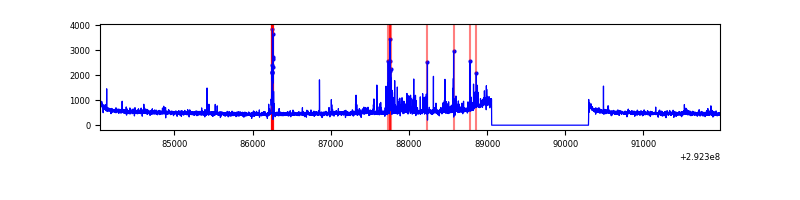 |
| C | 7931 | 6692 | 0 | 0 | 0.00% | 0.00% | 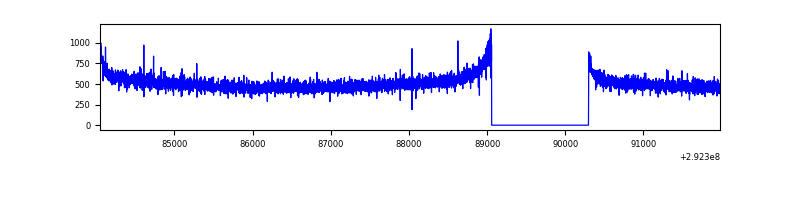 |
| D | 7931 | 6692 | 437 | 437 | 5.51% | 6.53% | 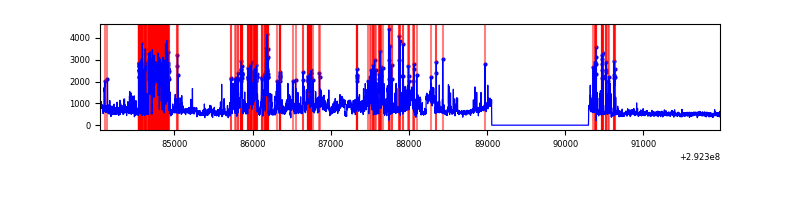 |
Top three noisy pixels from each quadrant. If the there are fewer than three noisy pixels in the level2.evt file, extra rows are filled as -1
| Pixel properties | Quadrant properties | ||||||
|---|---|---|---|---|---|---|---|
| Quadrant | DetID | PixID | Counts | Sigma | Mean | Median | Sigma |
| A | 13 | 254 | 8764 | 45.5 | 861 | 846 | 174.0 |
| A | 0 | 226 | 7369 | 37.48 | 861 | 846 | 174.0 |
| A | 3 | 137 | 6212 | 30.84 | 861 | 846 | 174.0 |
| B | 7 | 220 | 105983 | 645.99 | 860 | 839 | 162.8 |
| B | 3 | 112 | 97262 | 592.41 | 860 | 839 | 162.8 |
| B | 0 | 197 | 20975 | 123.71 | 860 | 839 | 162.8 |
| C | 14 | 238 | 129917 | 659.41 | 837 | 848 | 195.7 |
| C | 13 | 61 | 5875 | 25.68 | 837 | 848 | 195.7 |
| C | 3 | 233 | 4181 | 17.03 | 837 | 848 | 195.7 |
| D | 1 | 20 | 2026730 | 10133.58 | 821 | 801 | 199.9 |
| D | 7 | 238 | 420121 | 2097.41 | 821 | 801 | 199.9 |
| D | 1 | 52 | 221301 | 1102.93 | 821 | 801 | 199.9 |
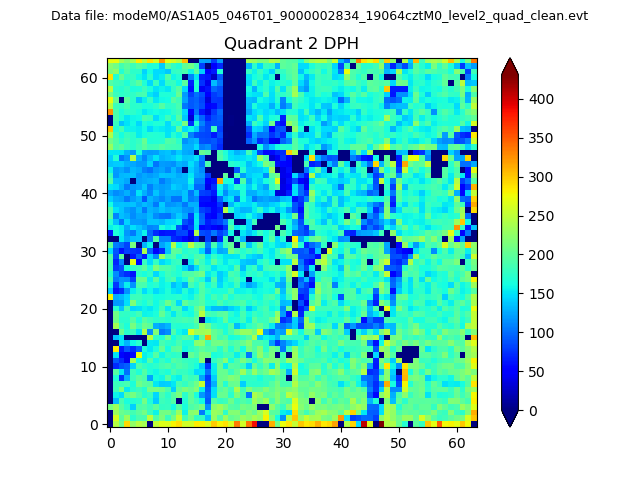
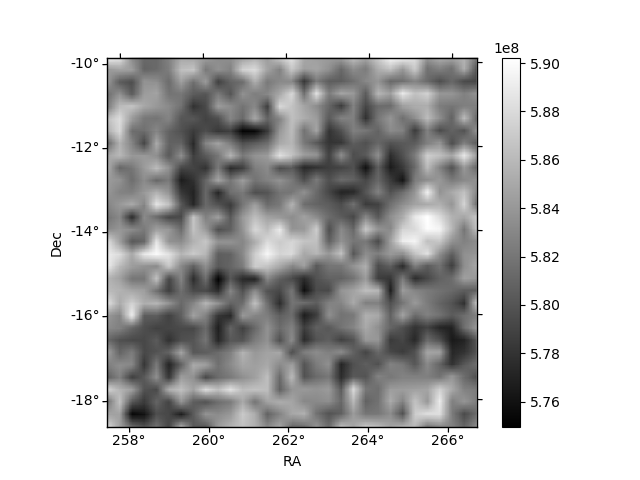
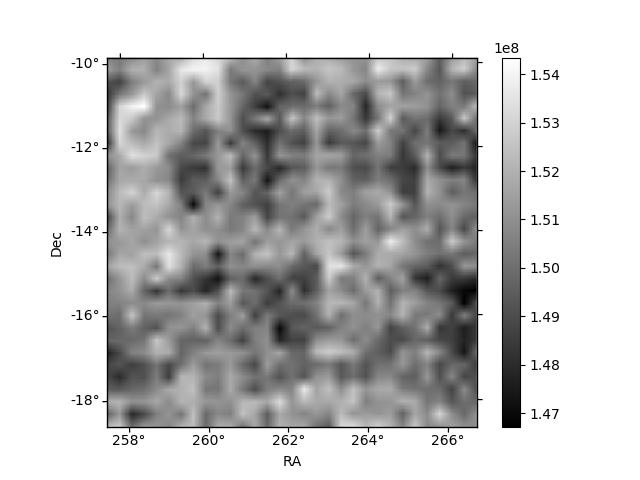
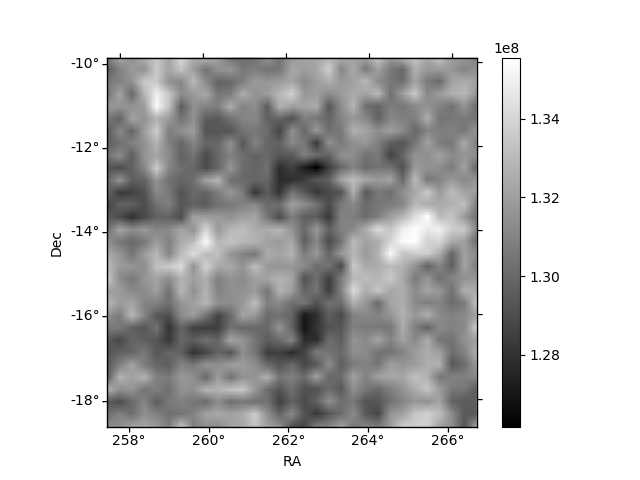
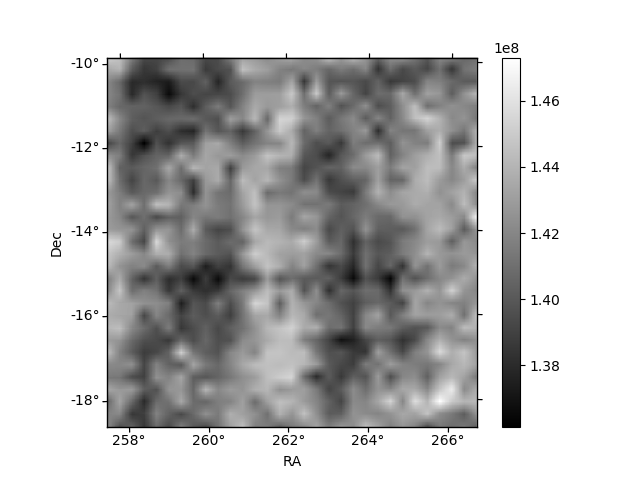
Histogram calculated using DETX and DETY for each event in the final _common_clean file
| Quadrant A | 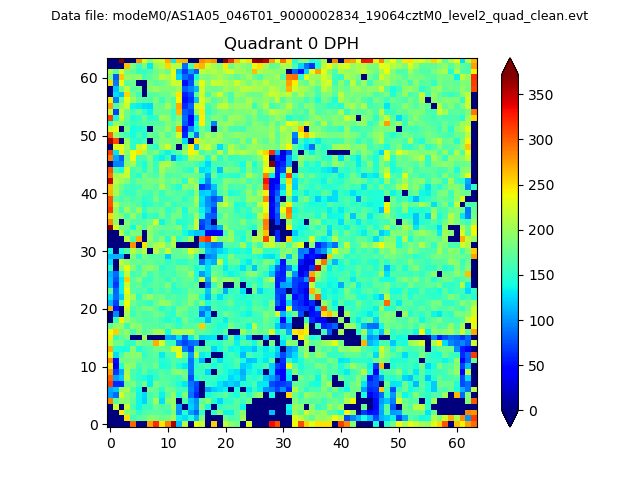 |
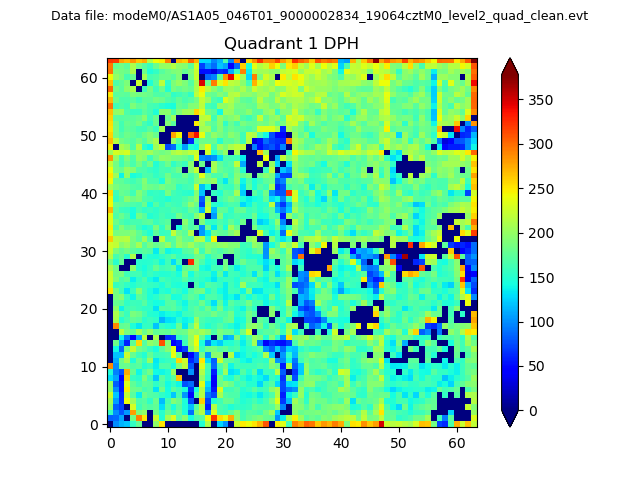 |
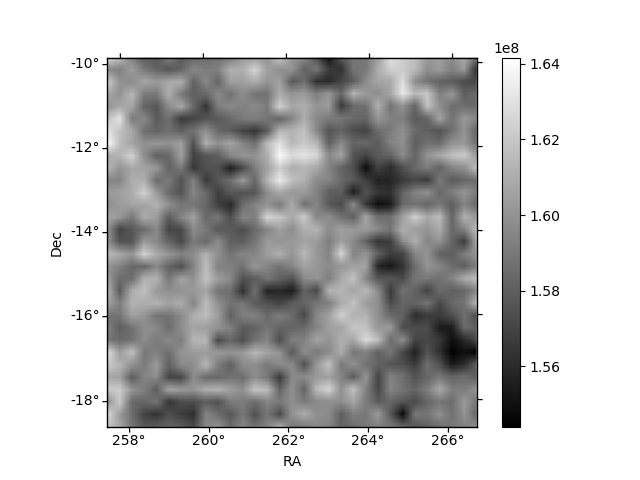
Quadrant B |
|---|---|---|---|
| Quadrant D | 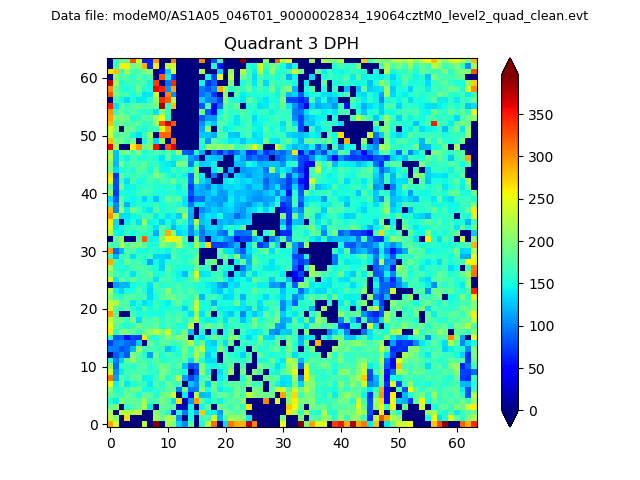 |
 |
Quadrant C |
| Plot type | Count rate plots | Images |
|---|---|---|
| Comparison with Poisson distribution Blue bars denote a histogram of data divided into 1 sec bins. Red curve is a Poisson curve with rate = median count rate of data. |
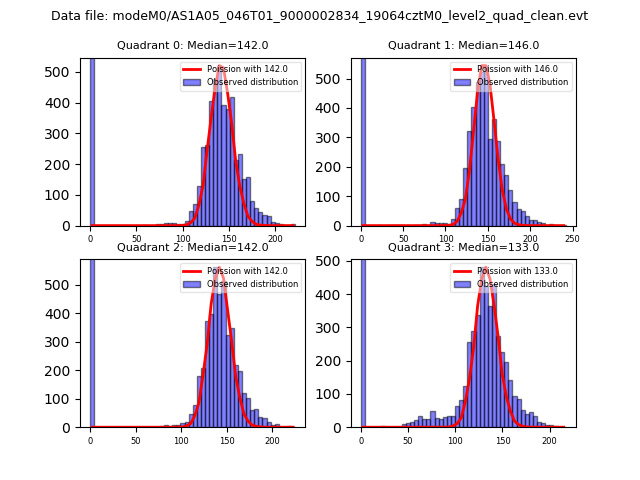 |
 |
| Quadrant-wise count rates Data is divided into 100 sec bins |
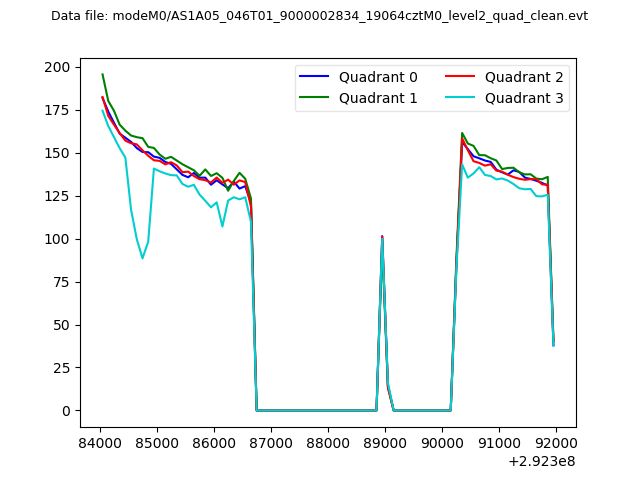 |
|
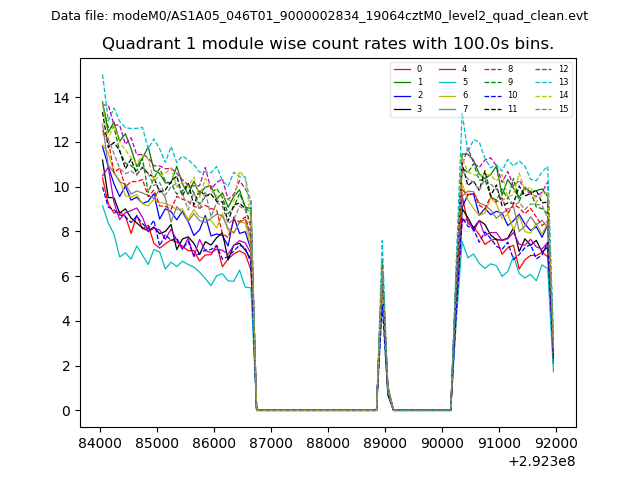
| Module-wise count rates for Quadrant A Data is divided into 100 sec bins |
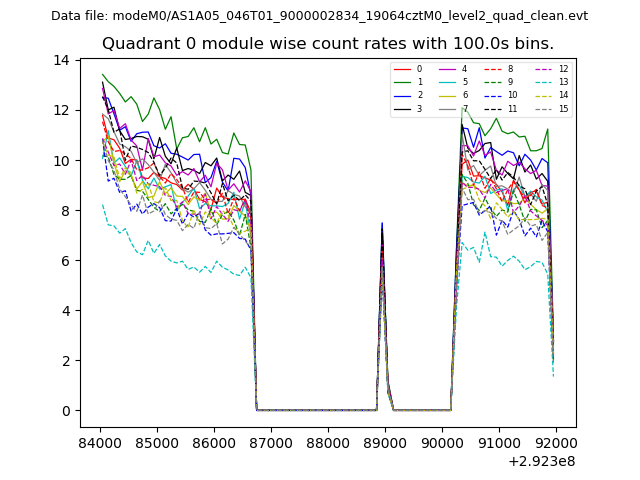 |
 |
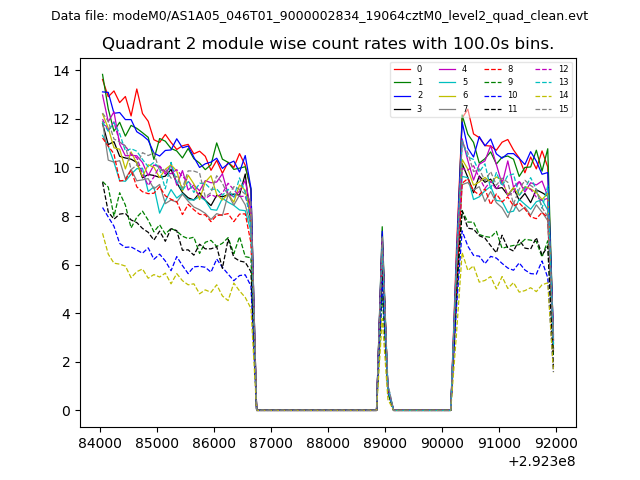
| Module-wise count rates for Quadrant B Data is divided into 100 sec bins |
 |
 |
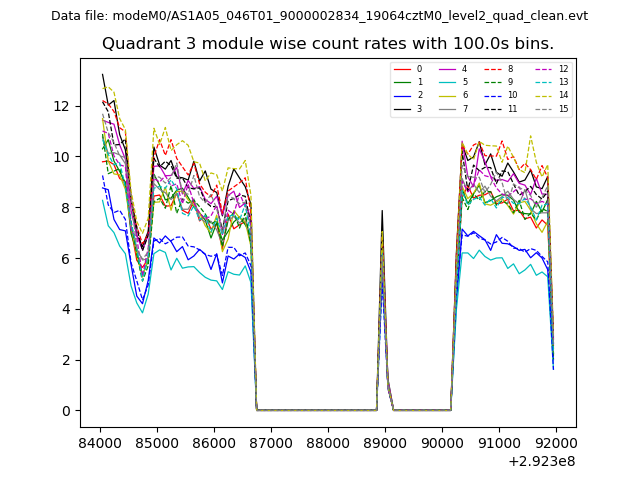
| Module-wise count rates for Quadrant C Data is divided into 100 sec bins |
 |
 |
| Module-wise count rates for Quadrant D Data is divided into 100 sec bins |
 |
 |
| Parameter | Plot |
|---|---|
| CZT HV Monitor | 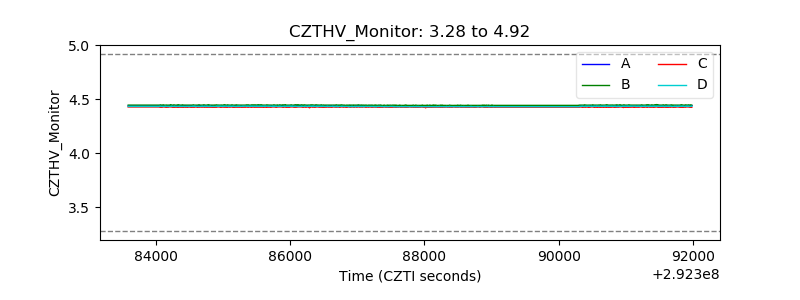 |
| D_VDD | 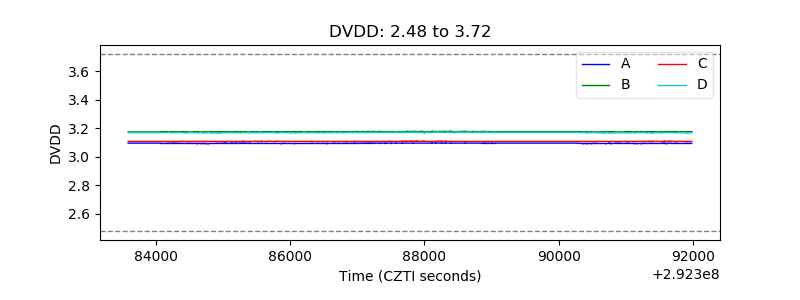 |
| Temperature 1 | 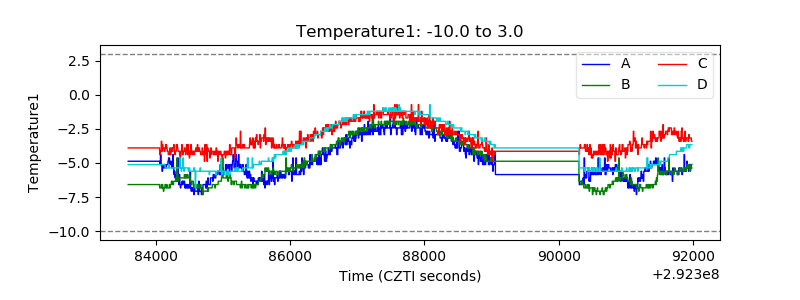 |
| Veto HV Monitor | 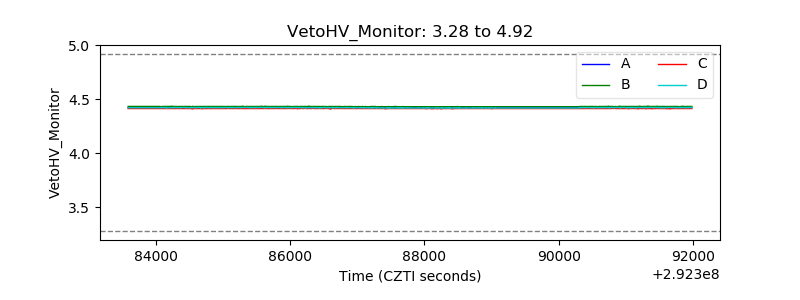 |
| Veto LLD | 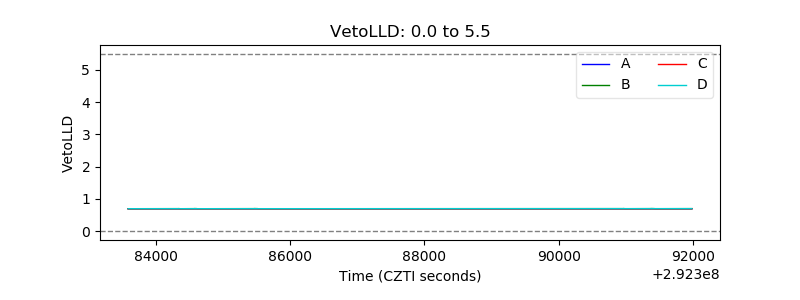 |
| Alpha Counter | 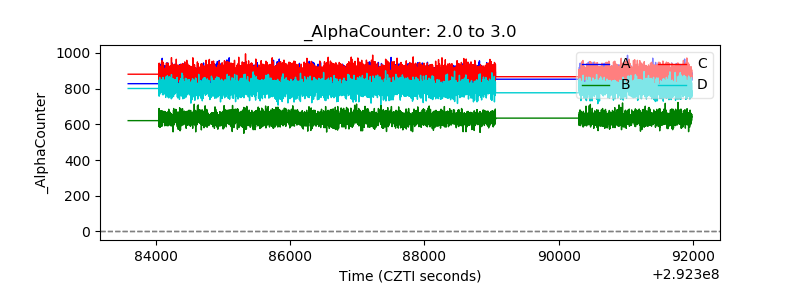 |
| _CPM_Rate | 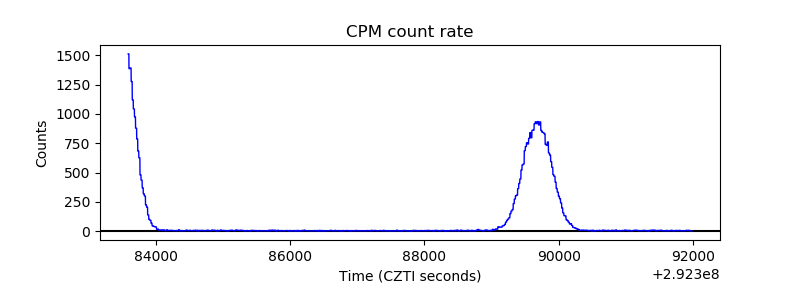 |
| CZT Counter | 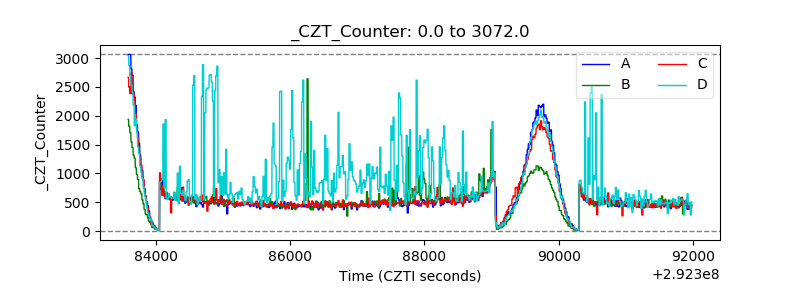 |
| +2.5 Volts monitor |  |
| +5 Volts monitor | 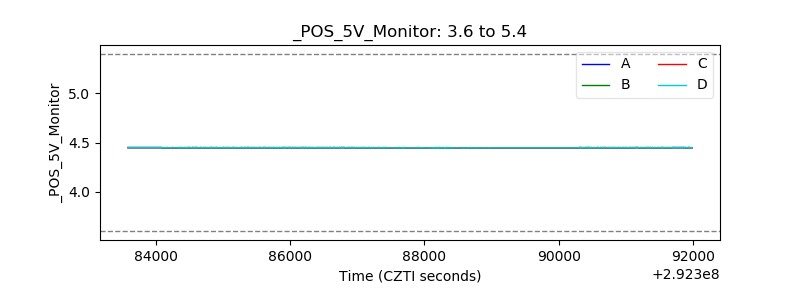 |
| _ROLL_ROT | 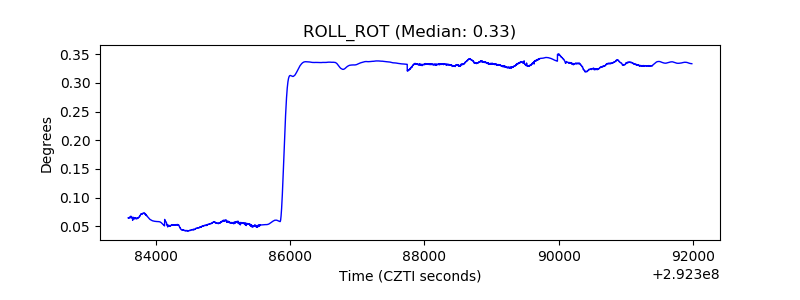 |
| _Roll_DEC | 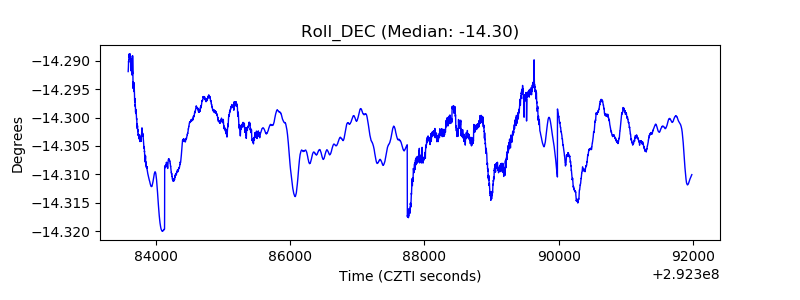 |
| _Roll_RA | 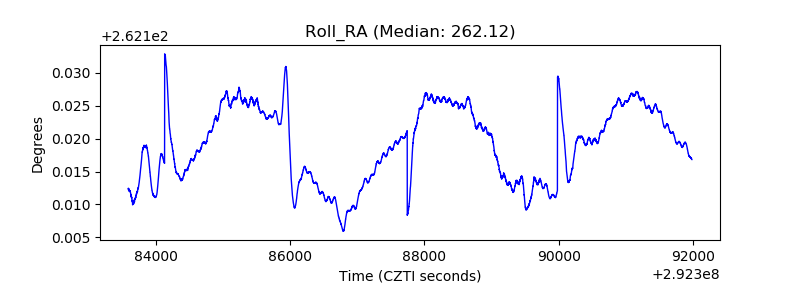 |
| Veto Counter | 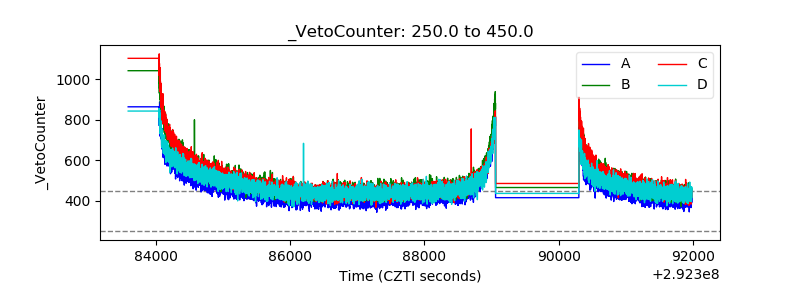 |