| Param | Original file | Final file |
|---|---|---|
| Filename | modeM0/AS1A05_046T01_9000002834_19065cztM0_level2.evt | modeM0/AS1A05_046T01_9000002834_19065cztM0_level2_quad_clean.evt |
| Size (bytes) | 485,481,600 | 84,769,920 |
| Size | 463.0 MB | 80.8 MB |
| Events in quadrant A | 2,999,237 | 540,421 |
| Events in quadrant B | 3,385,161 | 553,399 |
| Events in quadrant C | 3,169,479 | 538,492 |
| Events in quadrant D | 4,721,908 | 495,457 |
| Mode SS | |||
|---|---|---|---|
| Quadrant | BADHDUFLAG | Total packets | Discarded packets |
| A | 0 | 128 | 0 |
| B | 0 | 128 | 0 |
| C | 0 | 128 | 0 |
| D | 0 | 128 | 0 |
| Mode M0 | |||
|---|---|---|---|
| Quadrant | BADHDUFLAG | Total packets | Discarded packets |
| A | 0 | 12907 | 1 |
| B | 0 | 14118 | 1 |
| C | 0 | 13259 | 1 |
| D | 0 | 18116 | 1 |
| Mode M9 | |||
|---|---|---|---|
| Quadrant | BADHDUFLAG | Total packets | Discarded packets |
| A | 0 | 10 | 0 |
| B | 0 | 10 | 0 |
| C | 0 | 10 | 0 |
| D | 0 | 10 | 0 |
| Quadrant | Total seconds | Saturated seconds | Saturation percentage |
|---|---|---|---|
| A | 6288 | 44 | 0.699746% |
| B | 6289 | 98 | 1.558276% |
| C | 6289 | 89 | 1.415169% |
| D | 6289 | 364 | 5.787884% |
Noise dominated data is calculated using 1-second bins in cleaned event files. If a bin has >2000 counts, and if more than 50% of those come from <1% of pixels, then it is considered to be noise-dominated and hence unusable.
| Quadrant | # 1 sec bins | Bins with >0 counts | Bins with >2000 counts | High rate bins dominated by noise | Noise dominated (total time) | Noise dominated (detector-on time) | Marked lightcurve |
|---|---|---|---|---|---|---|---|
| A | 7273 | 6289 | 0 | 0 | 0.00% | 0.00% | 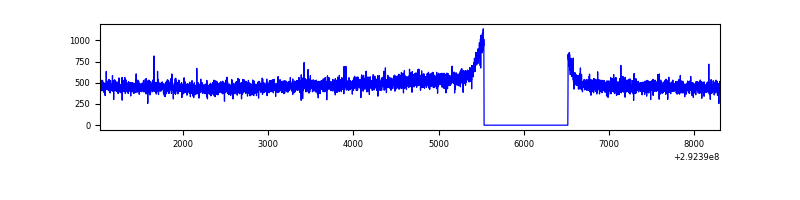 |
| B | 7274 | 6290 | 20 | 20 | 0.27% | 0.32% | 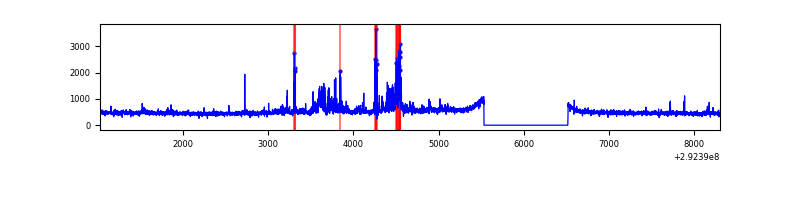 |
| C | 7274 | 6290 | 14 | 14 | 0.19% | 0.22% | 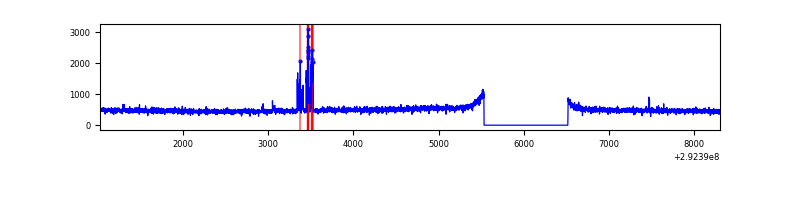 |
| D | 7274 | 6290 | 257 | 257 | 3.53% | 4.09% | 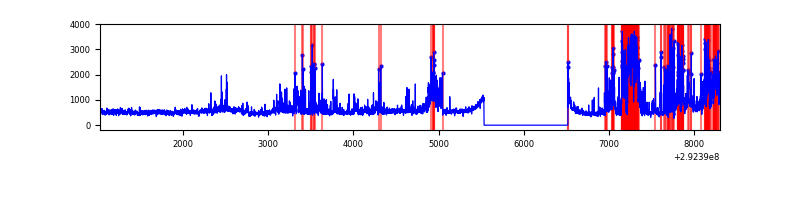 |
Top three noisy pixels from each quadrant. If the there are fewer than three noisy pixels in the level2.evt file, extra rows are filled as -1
| Pixel properties | Quadrant properties | ||||||
|---|---|---|---|---|---|---|---|
| Quadrant | DetID | PixID | Counts | Sigma | Mean | Median | Sigma |
| A | 13 | 254 | 7270 | 40.98 | 778 | 761 | 158.8 |
| A | 0 | 226 | 6815 | 38.12 | 778 | 761 | 158.8 |
| A | 3 | 137 | 5828 | 31.9 | 778 | 761 | 158.8 |
| B | 7 | 220 | 111878 | 754.68 | 775 | 757 | 147.2 |
| B | 6 | 36 | 98649 | 664.84 | 775 | 757 | 147.2 |
| B | 4 | 216 | 40422 | 269.39 | 775 | 757 | 147.2 |
| C | 14 | 238 | 116395 | 651.06 | 754 | 760 | 177.6 |
| C | 3 | 233 | 112299 | 628.0 | 754 | 760 | 177.6 |
| C | 13 | 61 | 5260 | 25.33 | 754 | 760 | 177.6 |
| D | 12 | 218 | 1067017 | 5820.18 | 751 | 731 | 183.2 |
| D | 1 | 20 | 517775 | 2822.22 | 751 | 731 | 183.2 |
| D | 1 | 52 | 108874 | 590.28 | 751 | 731 | 183.2 |
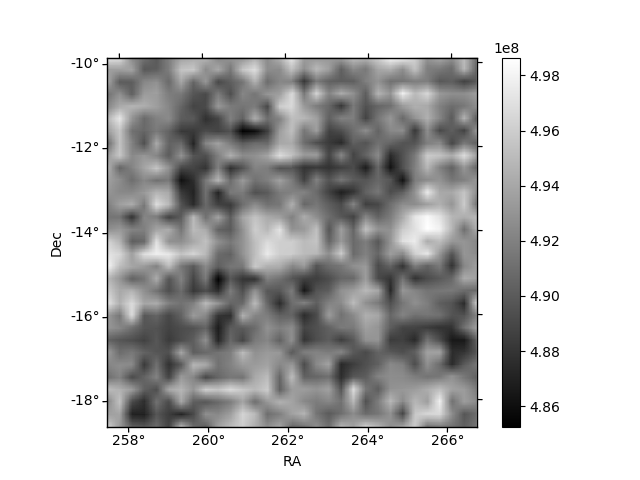
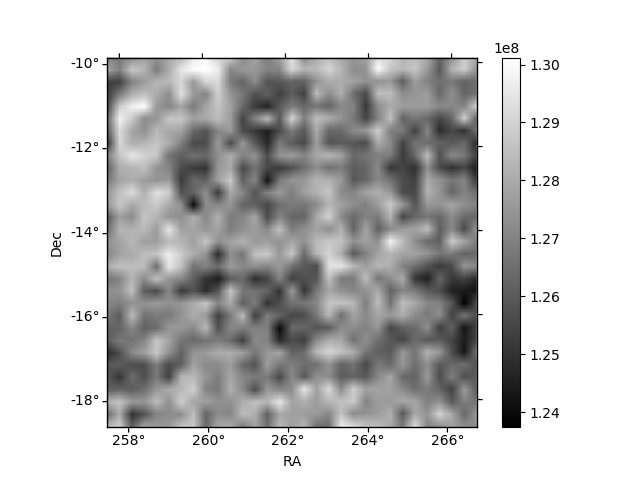
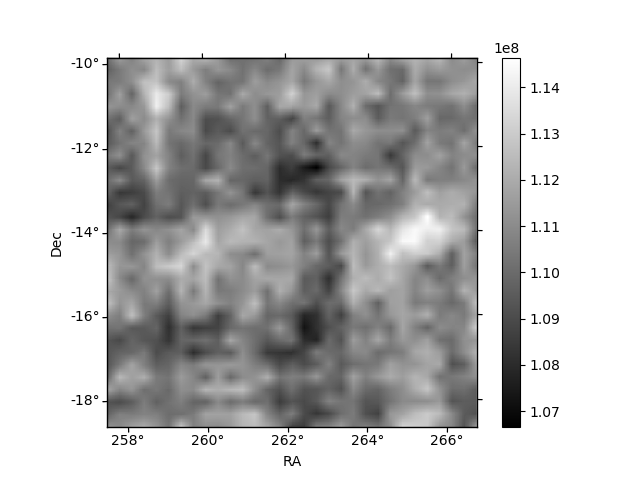
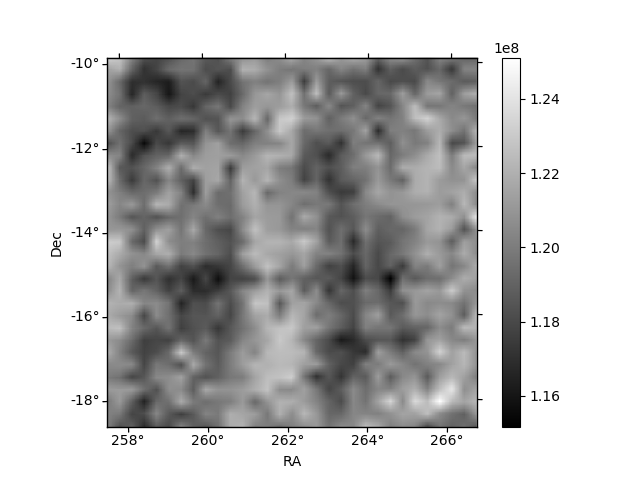
Histogram calculated using DETX and DETY for each event in the final _common_clean file
| Quadrant A | 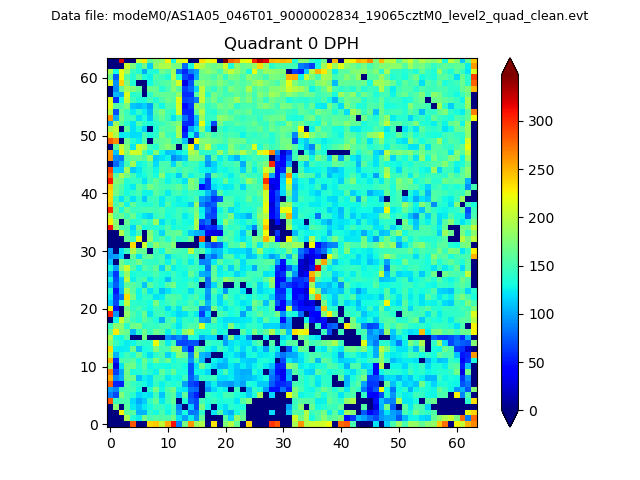 |
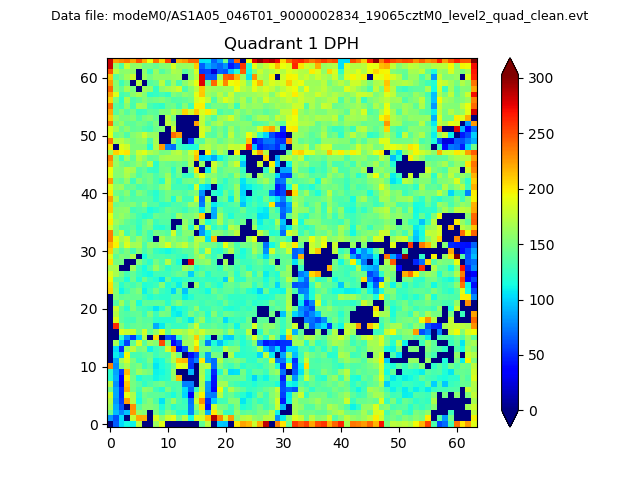 |
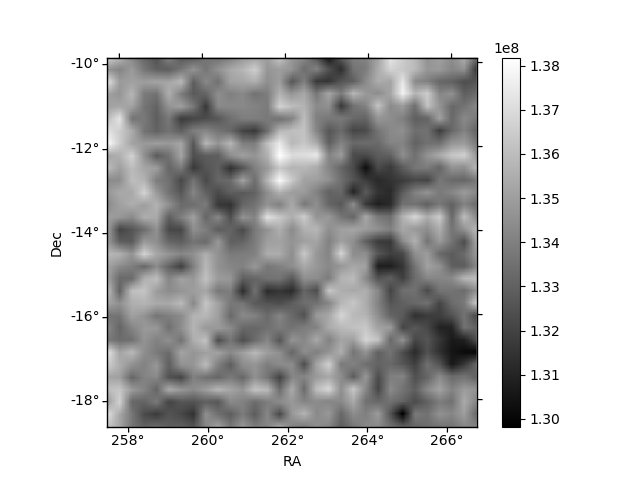
Quadrant B |
|---|---|---|---|
| Quadrant D | 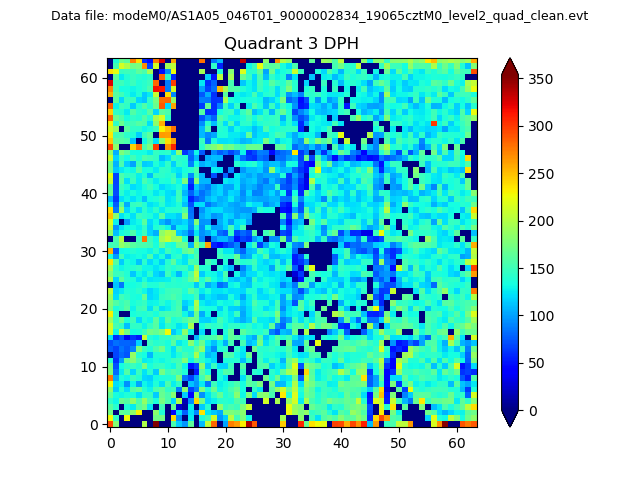 |
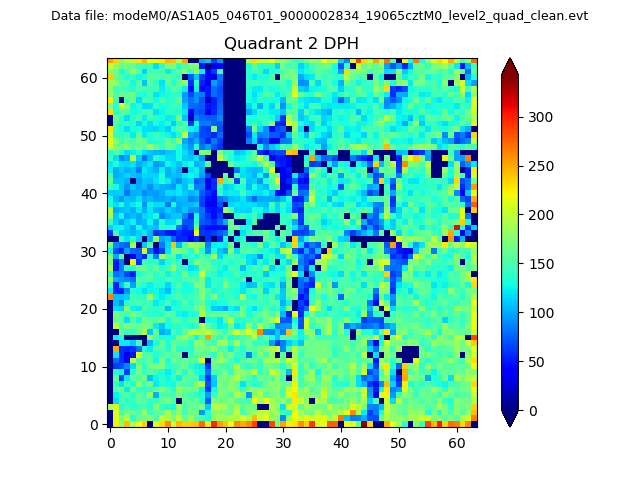 |
Quadrant C |
| Plot type | Count rate plots | Images |
|---|---|---|
| Comparison with Poisson distribution Blue bars denote a histogram of data divided into 1 sec bins. Red curve is a Poisson curve with rate = median count rate of data. |
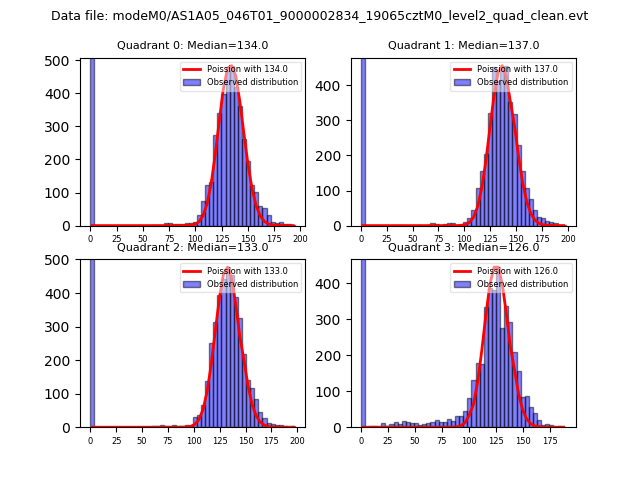 |
 |
| Quadrant-wise count rates Data is divided into 100 sec bins |
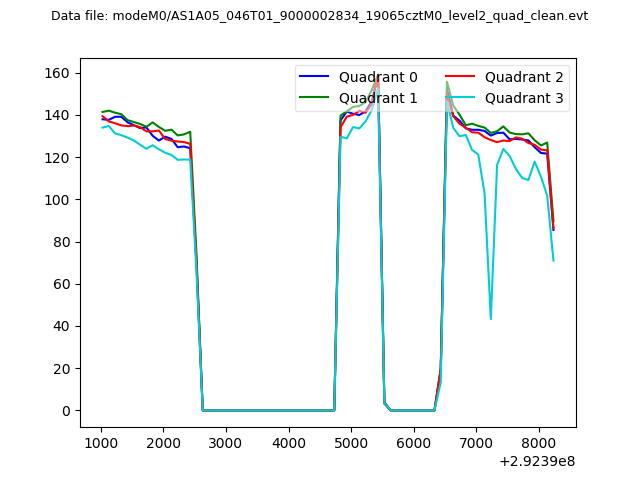 |
|
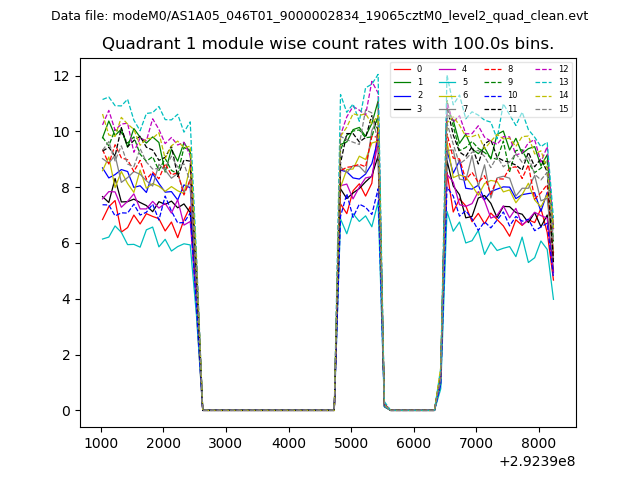
| Module-wise count rates for Quadrant A Data is divided into 100 sec bins |
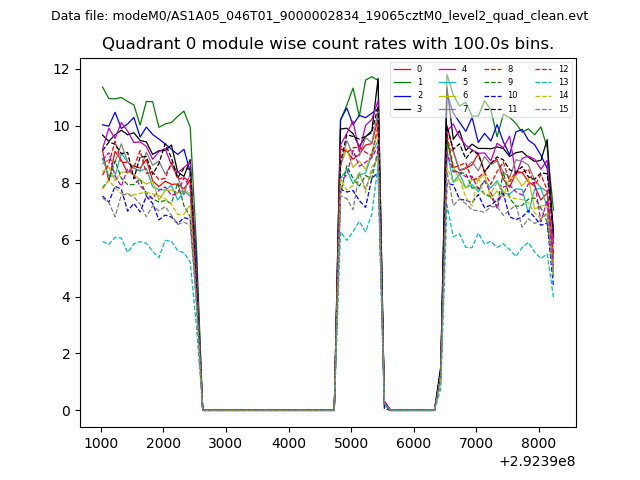 |
 |
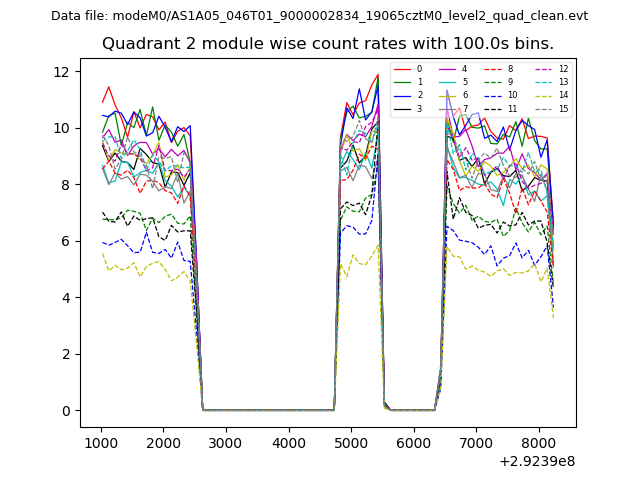
| Module-wise count rates for Quadrant B Data is divided into 100 sec bins |
 |
 |
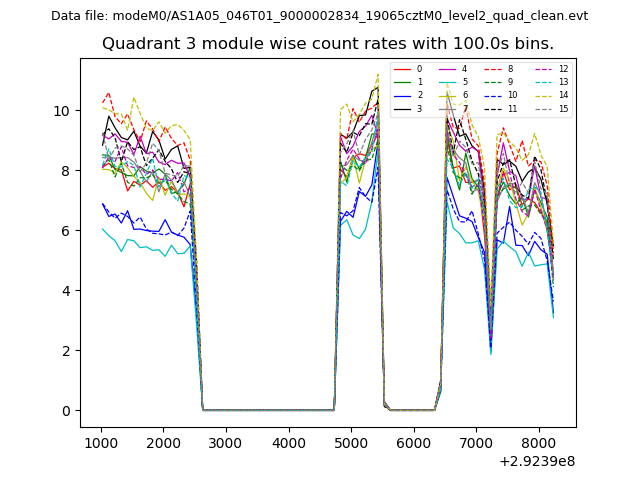
| Module-wise count rates for Quadrant C Data is divided into 100 sec bins |
 |
 |
| Module-wise count rates for Quadrant D Data is divided into 100 sec bins |
 |
 |
| Parameter | Plot |
|---|---|
| CZT HV Monitor | 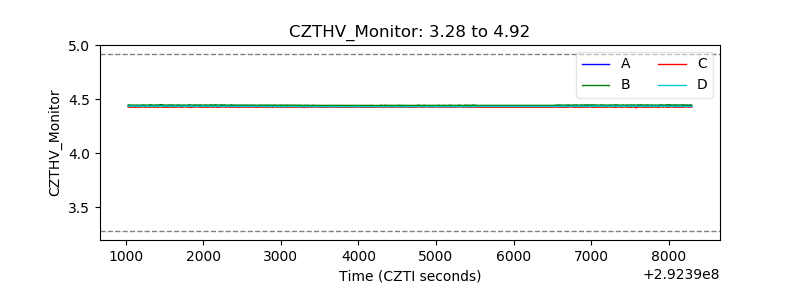 |
| D_VDD | 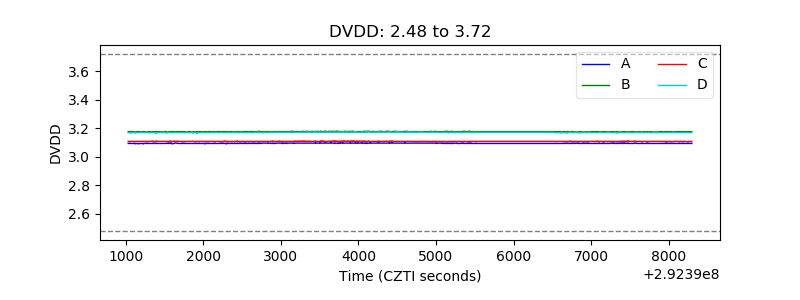 |
| Temperature 1 | 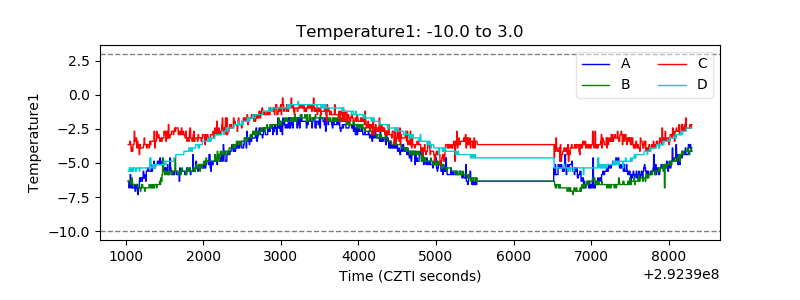 |
| Veto HV Monitor | 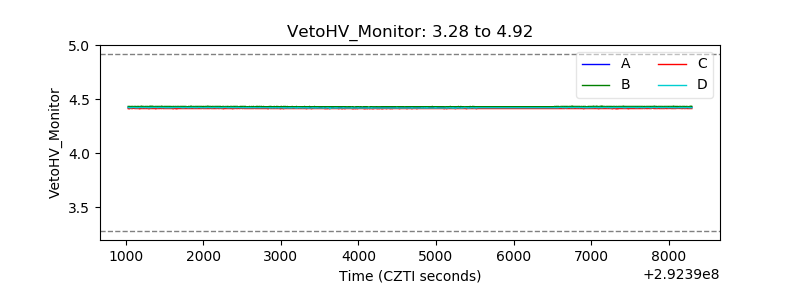 |
| Veto LLD | 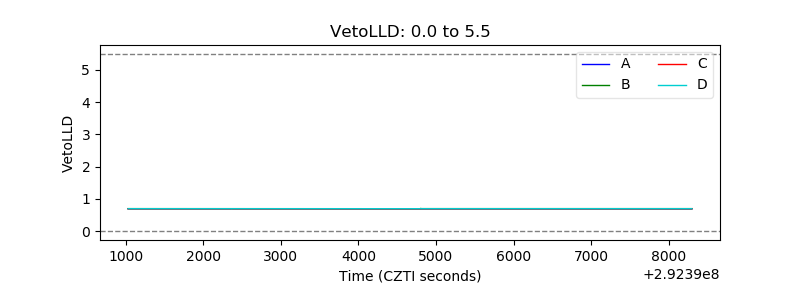 |
| Alpha Counter | 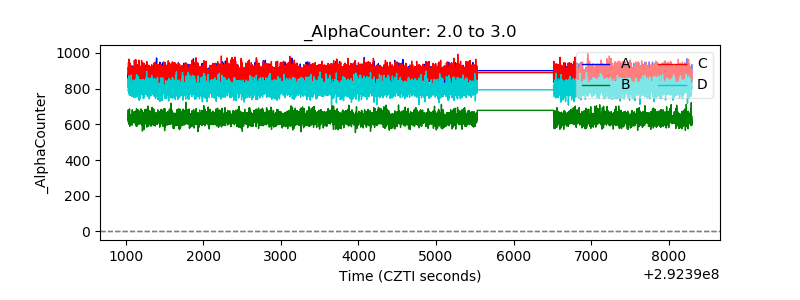 |
| _CPM_Rate | 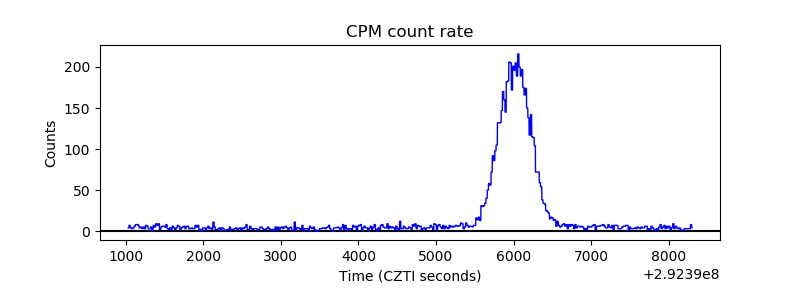 |
| CZT Counter | 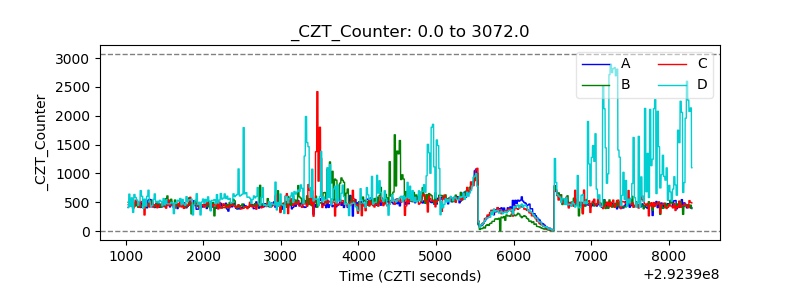 |
| +2.5 Volts monitor |  |
| +5 Volts monitor |  |
| _ROLL_ROT | 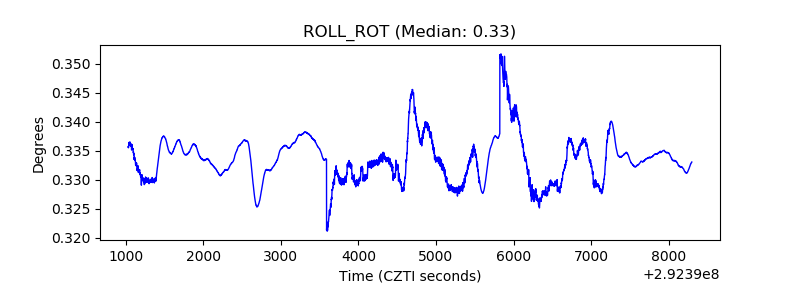 |
| _Roll_DEC | 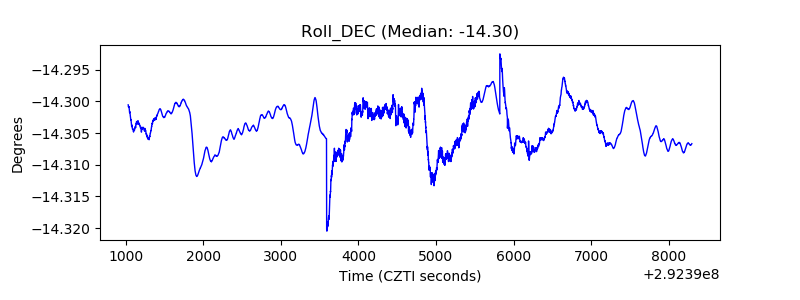 |
| _Roll_RA | 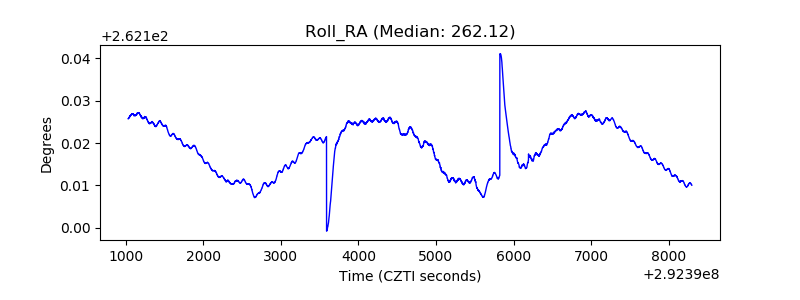 |
| Veto Counter | 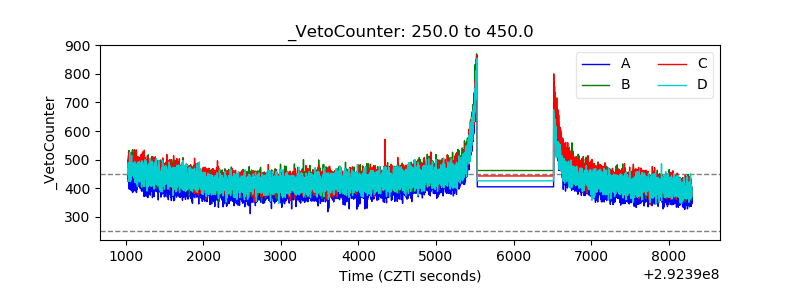 |