| Param | Original file | Final file |
|---|---|---|
| Filename | modeM0/AS1A05_046T01_9000002834_19066cztM0_level2.evt | modeM0/AS1A05_046T01_9000002834_19066cztM0_level2_quad_clean.evt |
| Size (bytes) | 475,623,360 | 73,408,320 |
| Size | 453.6 MB | 70.0 MB |
| Events in quadrant A | 2,745,838 | 462,072 |
| Events in quadrant B | 3,078,913 | 470,181 |
| Events in quadrant C | 2,876,781 | 460,013 |
| Events in quadrant D | 5,309,576 | 425,974 |
| Mode SS | |||
|---|---|---|---|
| Quadrant | BADHDUFLAG | Total packets | Discarded packets |
| A | 0 | 124 | 6 |
| B | 0 | 124 | 6 |
| C | 0 | 124 | 6 |
| D | 0 | 124 | 8 |
| Mode M0 | |||
|---|---|---|---|
| Quadrant | BADHDUFLAG | Total packets | Discarded packets |
| A | 0 | 12530 | 645 |
| B | 0 | 13414 | 705 |
| C | 0 | 12717 | 642 |
| D | 0 | 21050 | 1457 |
| Mode M9 | |||
|---|---|---|---|
| Quadrant | BADHDUFLAG | Total packets | Discarded packets |
| A | 0 | 6 | 0 |
| B | 0 | 6 | 0 |
| C | 0 | 6 | 0 |
| D | 0 | 6 | 0 |
| Quadrant | Total seconds | Saturated seconds | Saturation percentage |
|---|---|---|---|
| A | 5796 | 121 | 2.087647% |
| B | 5781 | 158 | 2.733091% |
| C | 5796 | 145 | 2.501725% |
| D | 5760 | 823 | 14.288194% |
Noise dominated data is calculated using 1-second bins in cleaned event files. If a bin has >2000 counts, and if more than 50% of those come from <1% of pixels, then it is considered to be noise-dominated and hence unusable.
| Quadrant | # 1 sec bins | Bins with >0 counts | Bins with >2000 counts | High rate bins dominated by noise | Noise dominated (total time) | Noise dominated (detector-on time) | Marked lightcurve |
|---|---|---|---|---|---|---|---|
| A | 6575 | 5901 | 0 | 0 | 0.00% | 0.00% | 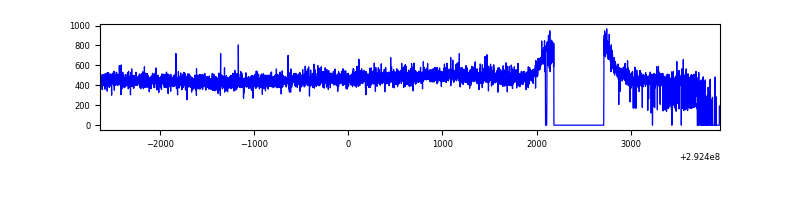 |
| B | 6562 | 5874 | 16 | 16 | 0.24% | 0.27% | 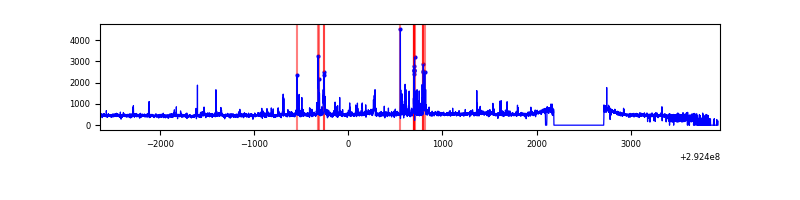 |
| C | 6581 | 5890 | 0 | 0 | 0.00% | 0.00% | 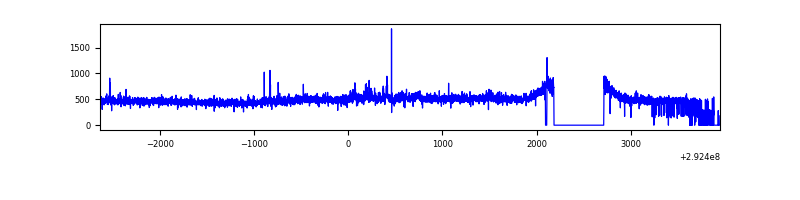 |
| D | 6467 | 5841 | 389 | 389 | 6.02% | 6.66% |  |
Top three noisy pixels from each quadrant. If the there are fewer than three noisy pixels in the level2.evt file, extra rows are filled as -1
| Pixel properties | Quadrant properties | ||||||
|---|---|---|---|---|---|---|---|
| Quadrant | DetID | PixID | Counts | Sigma | Mean | Median | Sigma |
| A | 13 | 254 | 6873 | 42.73 | 711 | 695 | 144.6 |
| A | 0 | 226 | 6141 | 37.67 | 711 | 695 | 144.6 |
| A | 3 | 137 | 5572 | 33.73 | 711 | 695 | 144.6 |
| B | 7 | 220 | 90075 | 654.72 | 705 | 688 | 136.5 |
| B | 3 | 112 | 71180 | 516.32 | 705 | 688 | 136.5 |
| B | 4 | 216 | 51862 | 374.83 | 705 | 688 | 136.5 |
| C | 14 | 238 | 106211 | 654.42 | 688 | 695 | 161.2 |
| C | 3 | 233 | 86745 | 533.69 | 688 | 695 | 161.2 |
| C | 13 | 61 | 4814 | 25.55 | 688 | 695 | 161.2 |
| D | 1 | 20 | 1493327 | 9214.74 | 663 | 644 | 162.0 |
| D | 12 | 218 | 993664 | 6130.18 | 663 | 644 | 162.0 |
| D | 1 | 52 | 159301 | 979.43 | 663 | 644 | 162.0 |
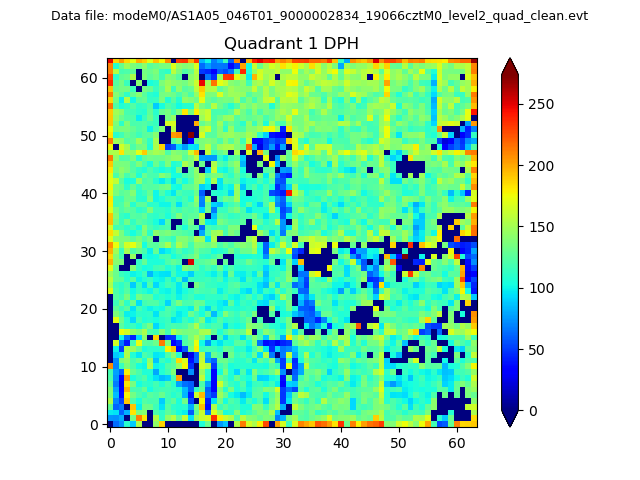
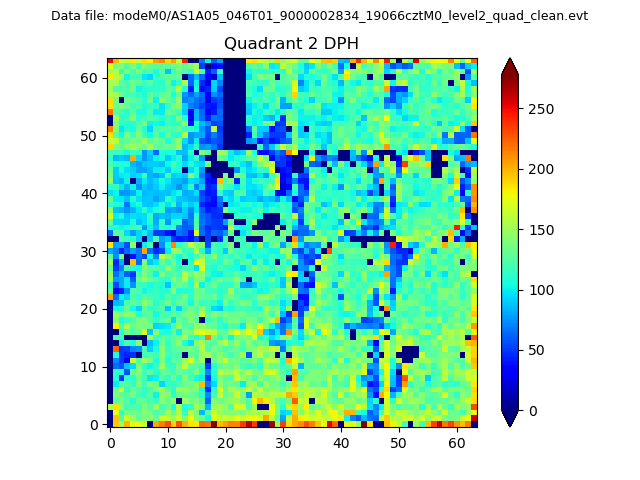
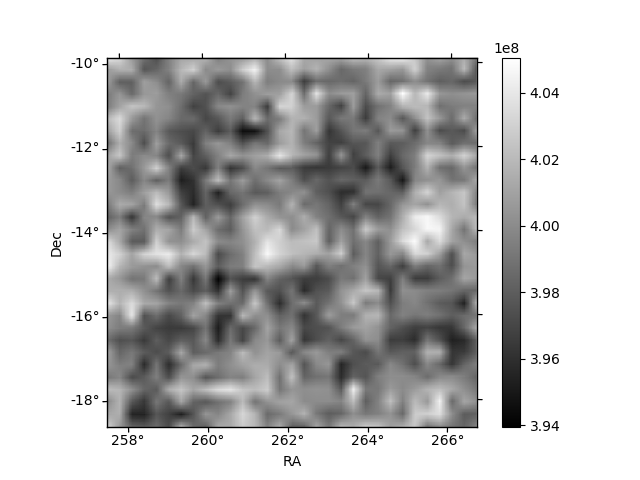
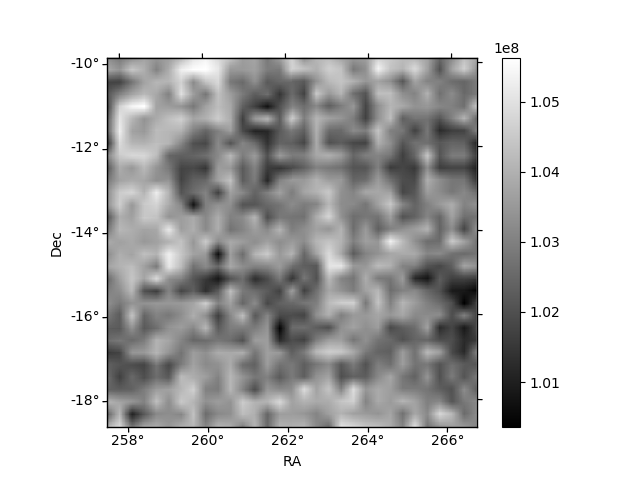
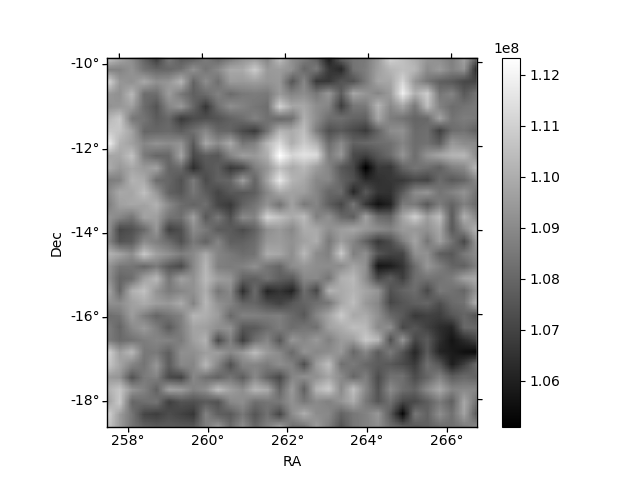
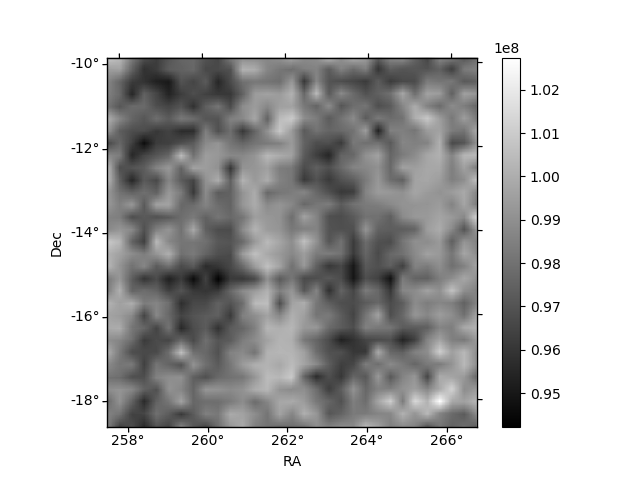
Histogram calculated using DETX and DETY for each event in the final _common_clean file
| Quadrant A | 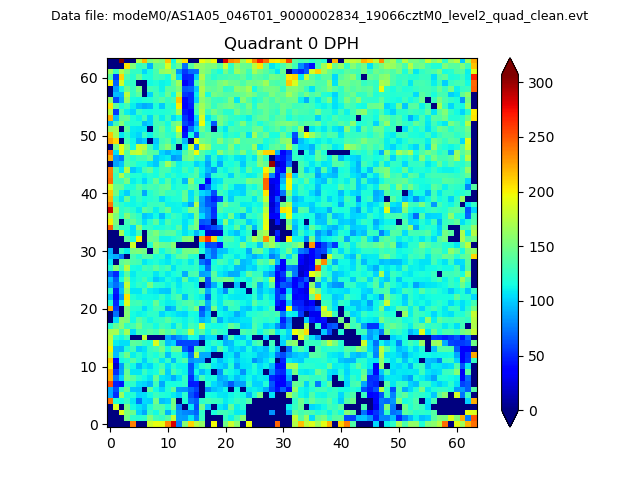 |
 |
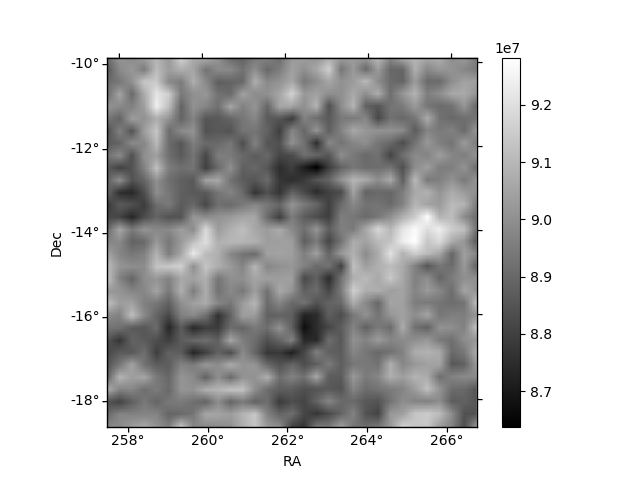
Quadrant B |
|---|---|---|---|
| Quadrant D | 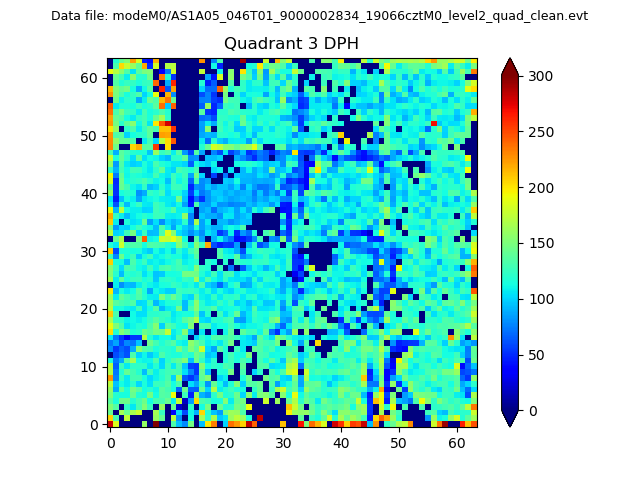 |
 |
Quadrant C |
| Plot type | Count rate plots | Images |
|---|---|---|
| Comparison with Poisson distribution Blue bars denote a histogram of data divided into 1 sec bins. Red curve is a Poisson curve with rate = median count rate of data. |
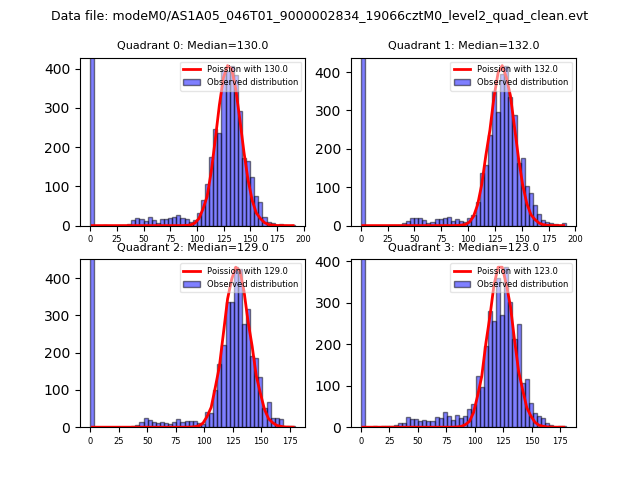 |
 |
| Quadrant-wise count rates Data is divided into 100 sec bins |
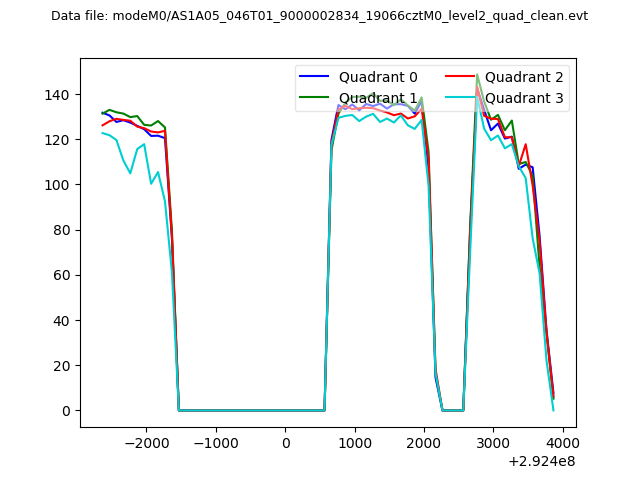 |
|
| Module-wise count rates for Quadrant A Data is divided into 100 sec bins |
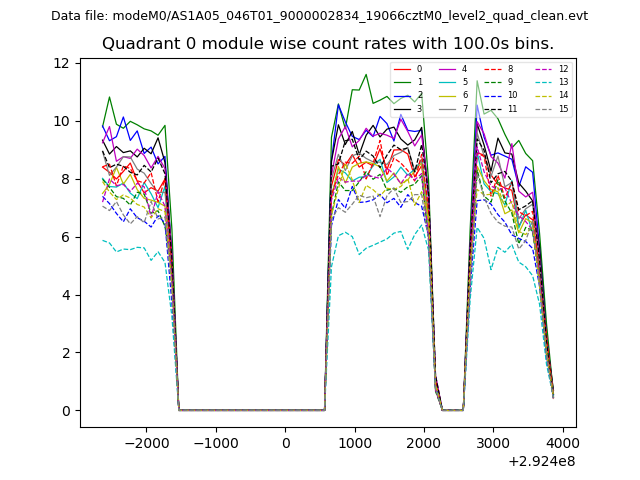 |
 |
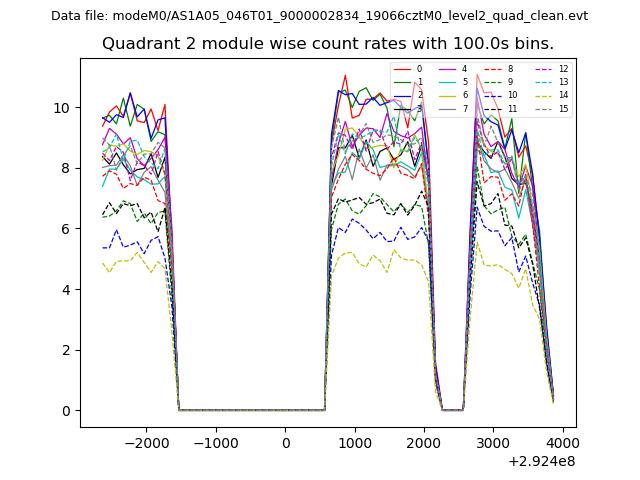
| Module-wise count rates for Quadrant B Data is divided into 100 sec bins |
 |
 |
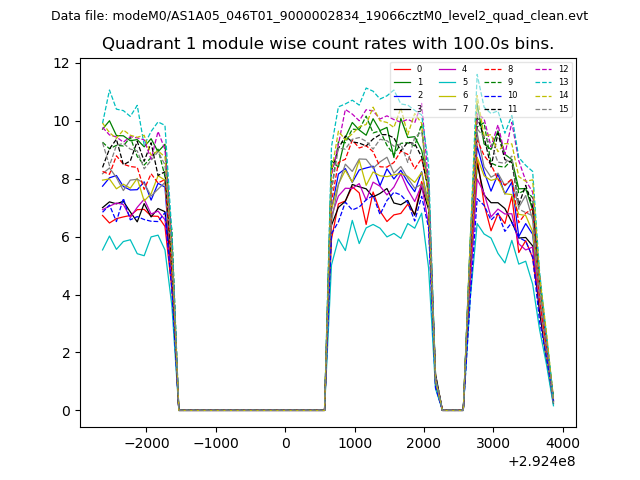
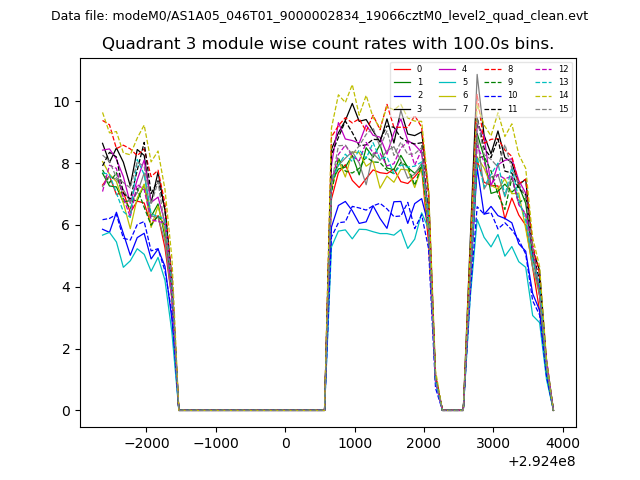
| Module-wise count rates for Quadrant C Data is divided into 100 sec bins |
 |
 |
| Module-wise count rates for Quadrant D Data is divided into 100 sec bins |
 |
 |
| Parameter | Plot |
|---|---|
| CZT HV Monitor | 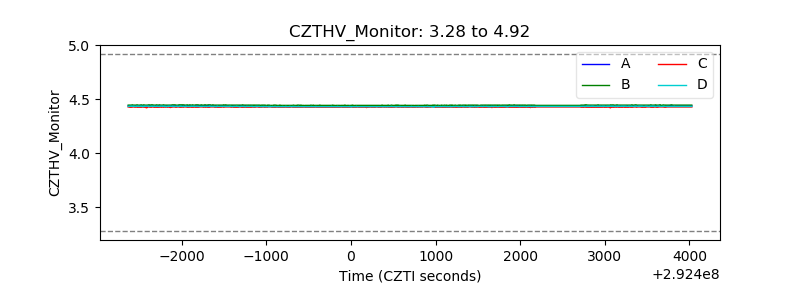 |
| D_VDD | 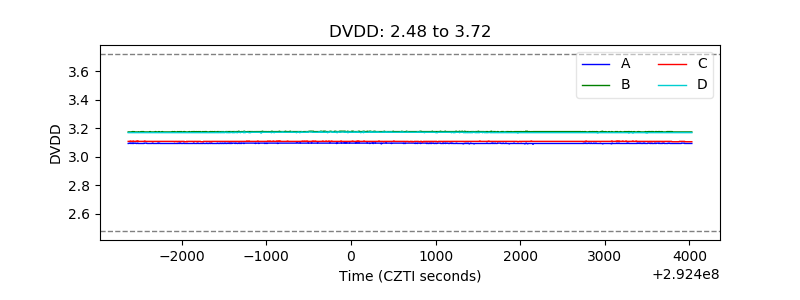 |
| Temperature 1 | 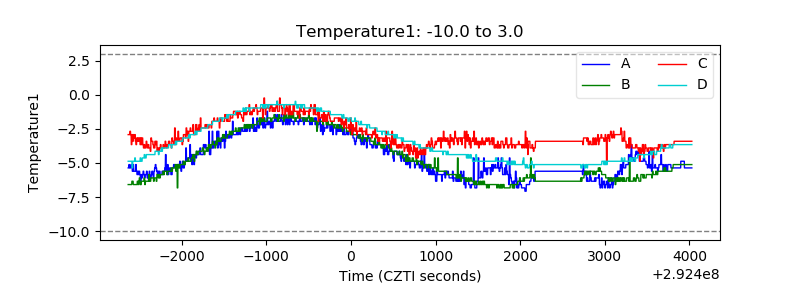 |
| Veto HV Monitor | 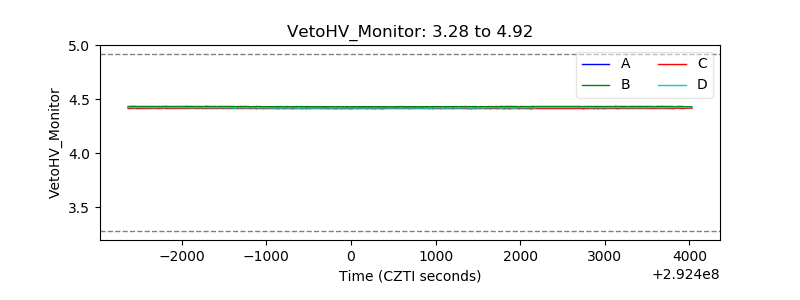 |
| Veto LLD | 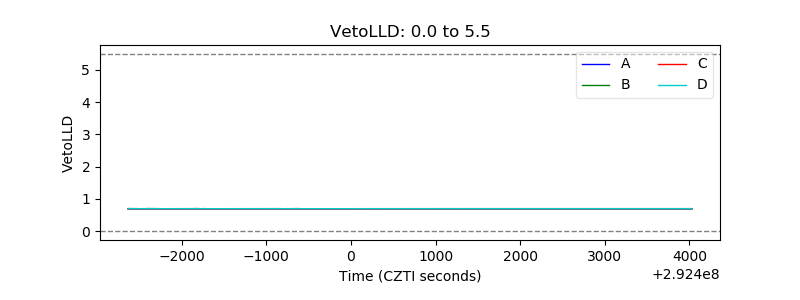 |
| Alpha Counter | 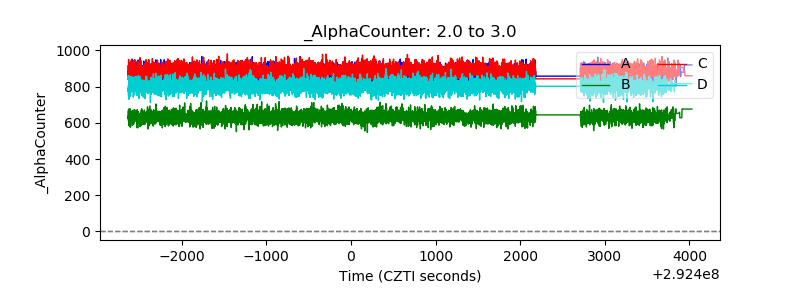 |
| _CPM_Rate | 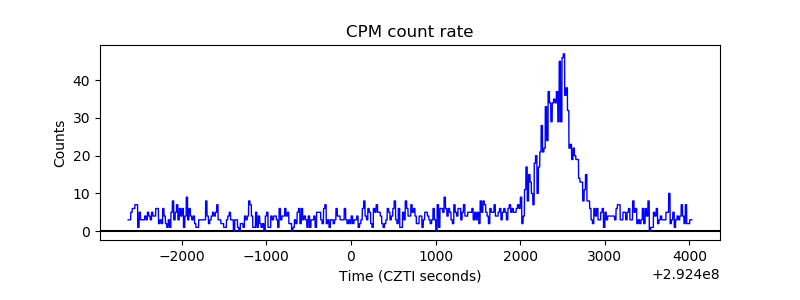 |
| CZT Counter | 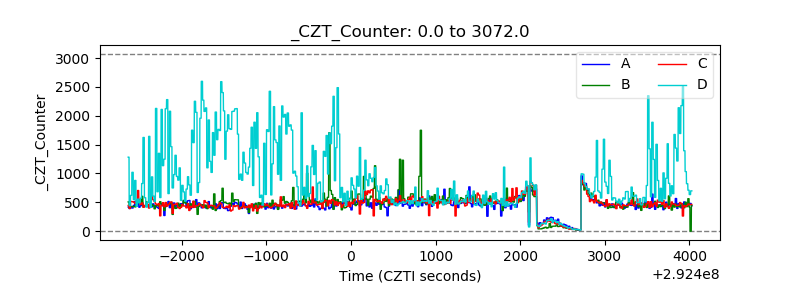 |
| +2.5 Volts monitor |  |
| +5 Volts monitor | 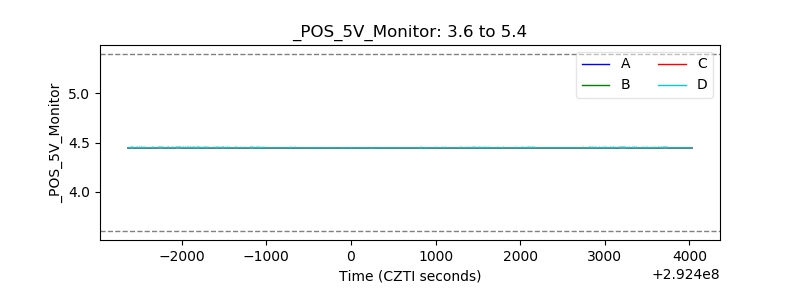 |
| _ROLL_ROT | 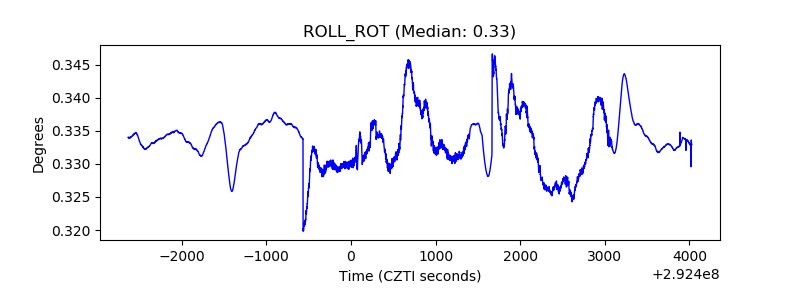 |
| _Roll_DEC | 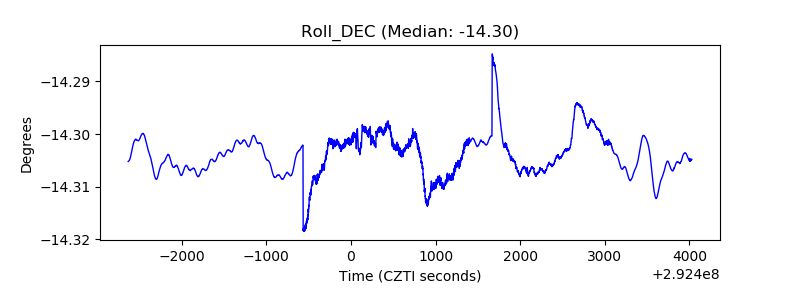 |
| _Roll_RA | 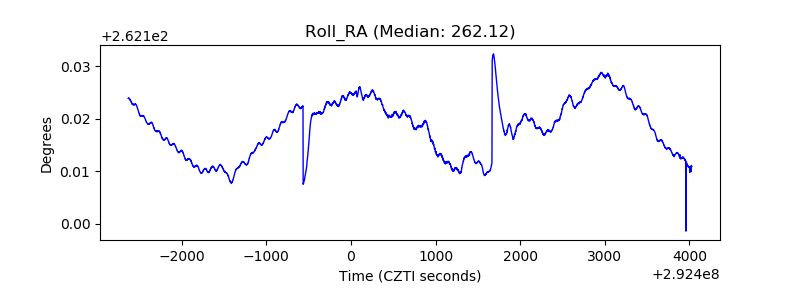 |
| Veto Counter | 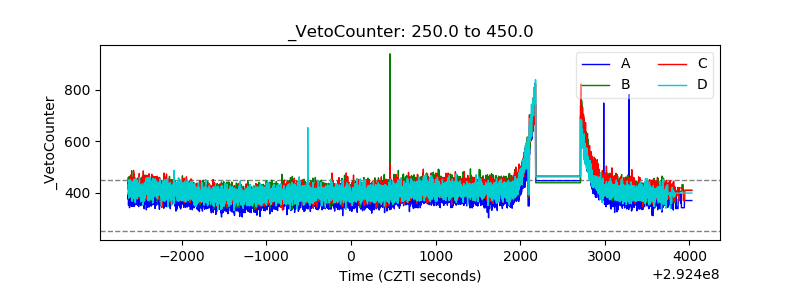 |