| Param | Original file | Final file |
|---|---|---|
| Filename | modeM0/AS1A05_046T01_9000002834_19067cztM0_level2.evt | modeM0/AS1A05_046T01_9000002834_19067cztM0_level2_quad_clean.evt |
| Size (bytes) | 514,088,640 | 78,246,720 |
| Size | 490.3 MB | 74.6 MB |
| Events in quadrant A | 2,929,526 | 502,933 |
| Events in quadrant B | 3,409,368 | 511,462 |
| Events in quadrant C | 2,994,335 | 499,547 |
| Events in quadrant D | 5,820,089 | 427,531 |
| Mode SS | |||
|---|---|---|---|
| Quadrant | BADHDUFLAG | Total packets | Discarded packets |
| A | 0 | 132 | 10 |
| B | 0 | 132 | 6 |
| C | 0 | 132 | 4 |
| D | 0 | 132 | 8 |
| Mode M0 | |||
|---|---|---|---|
| Quadrant | BADHDUFLAG | Total packets | Discarded packets |
| A | 0 | 13355 | 603 |
| B | 0 | 14576 | 596 |
| C | 0 | 13371 | 584 |
| D | 0 | 24793 | 3400 |
| Mode M9 | |||
|---|---|---|---|
| Quadrant | BADHDUFLAG | Total packets | Discarded packets |
| A | 0 | 1 | 0 |
| B | 0 | 1 | 0 |
| C | 0 | 1 | 0 |
| D | 0 | 1 | 0 |
| Quadrant | Total seconds | Saturated seconds | Saturation percentage |
|---|---|---|---|
| A | 6162 | 211 | 3.424213% |
| B | 6171 | 358 | 5.801329% |
| C | 6169 | 220 | 3.566218% |
| D | 5977 | 782 | 13.083487% |
Noise dominated data is calculated using 1-second bins in cleaned event files. If a bin has >2000 counts, and if more than 50% of those come from <1% of pixels, then it is considered to be noise-dominated and hence unusable.
| Quadrant | # 1 sec bins | Bins with >0 counts | Bins with >2000 counts | High rate bins dominated by noise | Noise dominated (total time) | Noise dominated (detector-on time) | Marked lightcurve |
|---|---|---|---|---|---|---|---|
| A | 6543 | 6279 | 0 | 0 | 0.00% | 0.00% |  |
| B | 6515 | 6289 | 97 | 97 | 1.49% | 1.54% |  |
| C | 6550 | 6282 | 0 | 0 | 0.00% | 0.00% |  |
| D | 6467 | 6100 | 416 | 416 | 6.43% | 6.82% |  |
Top three noisy pixels from each quadrant. If the there are fewer than three noisy pixels in the level2.evt file, extra rows are filled as -1
| Pixel properties | Quadrant properties | ||||||
|---|---|---|---|---|---|---|---|
| Quadrant | DetID | PixID | Counts | Sigma | Mean | Median | Sigma |
| A | 13 | 254 | 7534 | 43.19 | 760 | 741 | 157.3 |
| A | 0 | 226 | 6466 | 36.4 | 760 | 741 | 157.3 |
| A | 3 | 137 | 6007 | 33.48 | 760 | 741 | 157.3 |
| B | 7 | 220 | 325277 | 2222.42 | 748 | 726 | 146.0 |
| B | 4 | 216 | 87714 | 595.66 | 748 | 726 | 146.0 |
| B | 3 | 112 | 29077 | 194.14 | 748 | 726 | 146.0 |
| C | 14 | 238 | 111828 | 635.6 | 735 | 739 | 174.8 |
| C | 3 | 233 | 12066 | 64.81 | 735 | 739 | 174.8 |
| C | 13 | 61 | 5194 | 25.49 | 735 | 739 | 174.8 |
| D | 1 | 52 | 1587049 | 9414.99 | 689 | 668 | 168.5 |
| D | 1 | 20 | 777823 | 4612.33 | 689 | 668 | 168.5 |
| D | 12 | 218 | 393120 | 2329.16 | 689 | 668 | 168.5 |
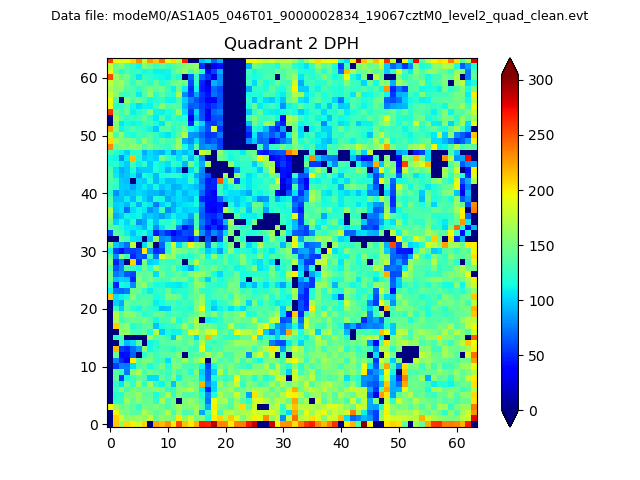
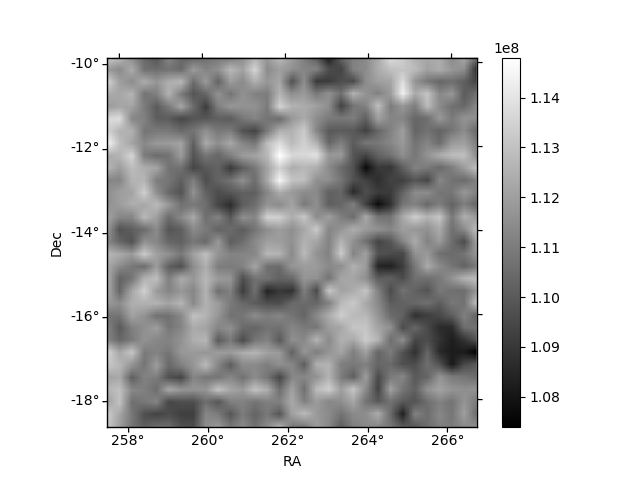
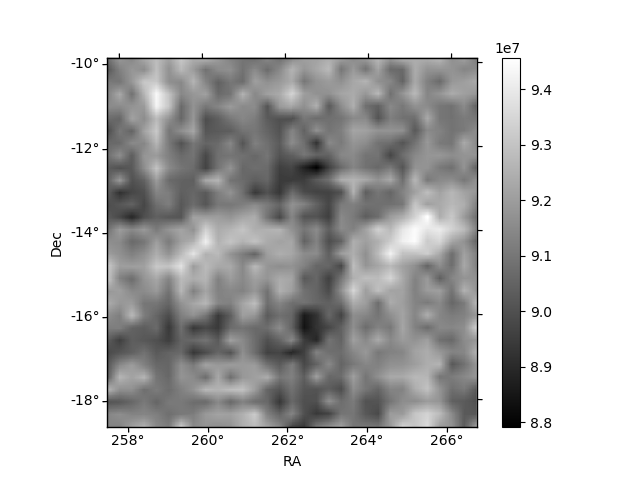
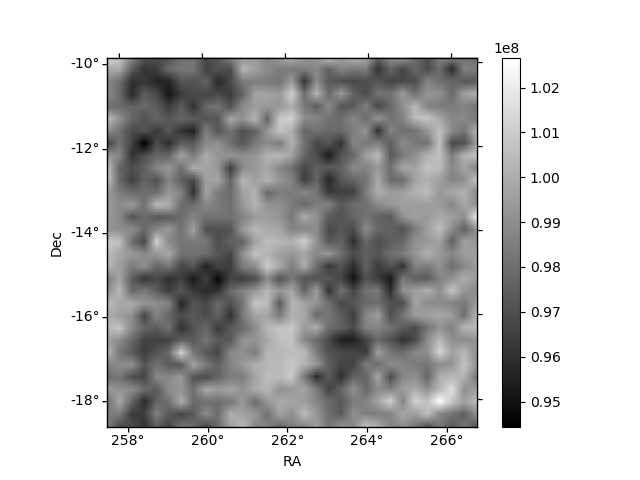
Histogram calculated using DETX and DETY for each event in the final _common_clean file
| Quadrant A | 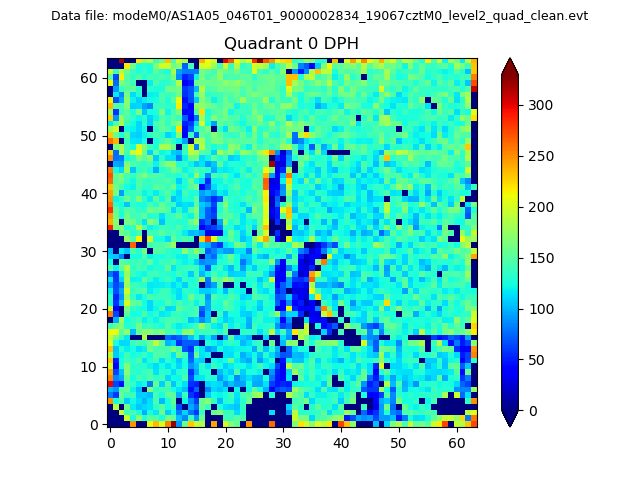 |
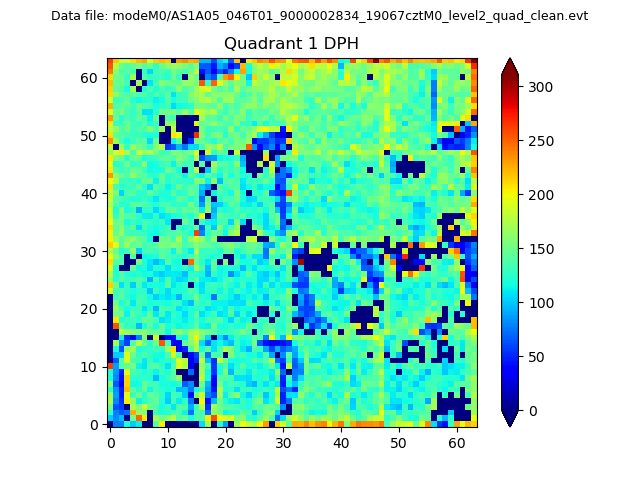 |
Quadrant B |
|---|---|---|---|
| Quadrant D | 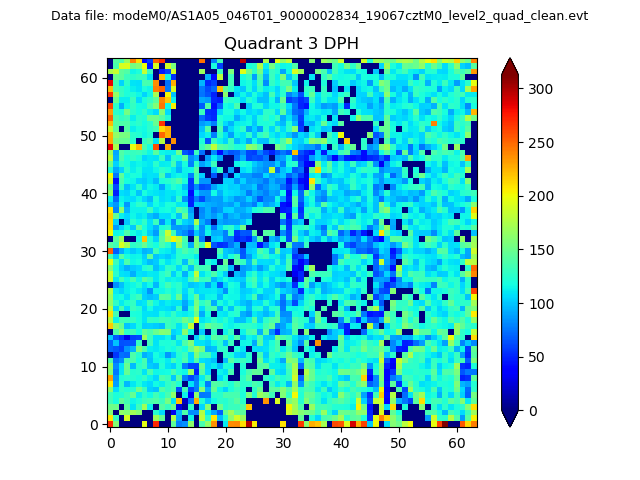 |
 |
Quadrant C |
| Plot type | Count rate plots | Images |
|---|---|---|
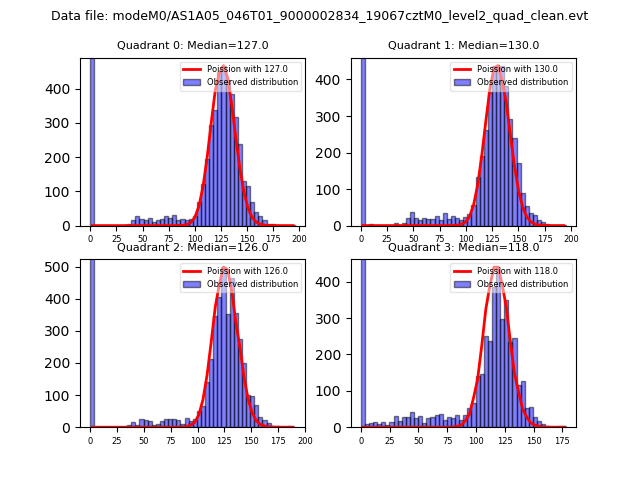
| Comparison with Poisson distribution Blue bars denote a histogram of data divided into 1 sec bins. Red curve is a Poisson curve with rate = median count rate of data. |
 |
 |
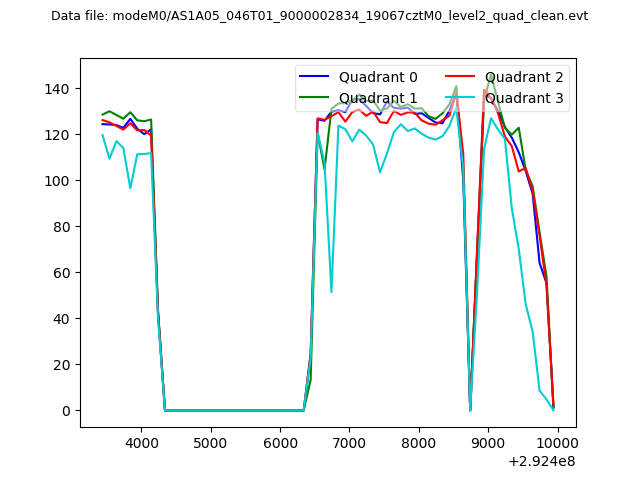
| Quadrant-wise count rates Data is divided into 100 sec bins |
 |
|
| Module-wise count rates for Quadrant A Data is divided into 100 sec bins |
 |
 |
| Module-wise count rates for Quadrant B Data is divided into 100 sec bins |
 |
 |
| Module-wise count rates for Quadrant C Data is divided into 100 sec bins |
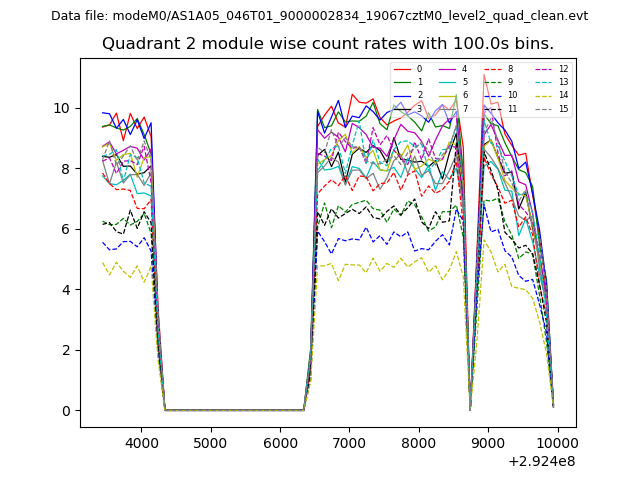 |
 |
| Module-wise count rates for Quadrant D Data is divided into 100 sec bins |
 |
 |
| Parameter | Plot |
|---|---|
| CZT HV Monitor |  |
| D_VDD | 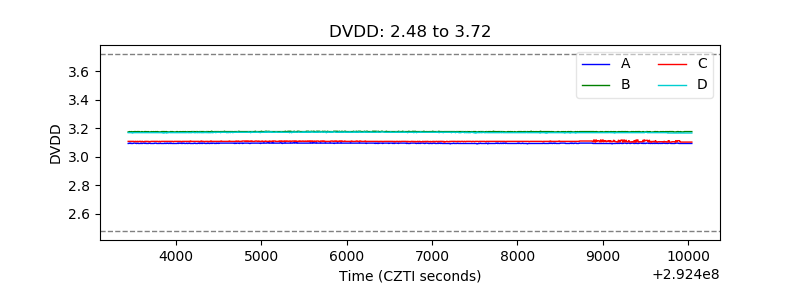 |
| Temperature 1 | 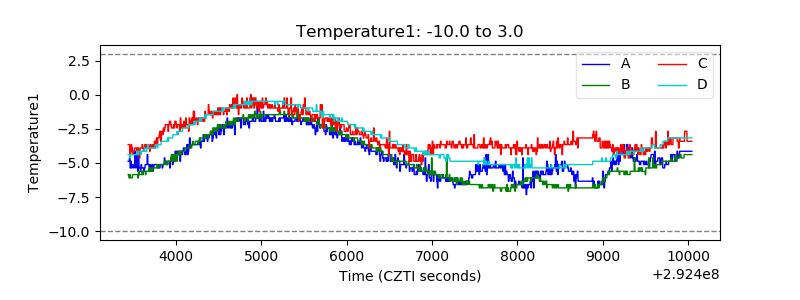 |
| Veto HV Monitor | 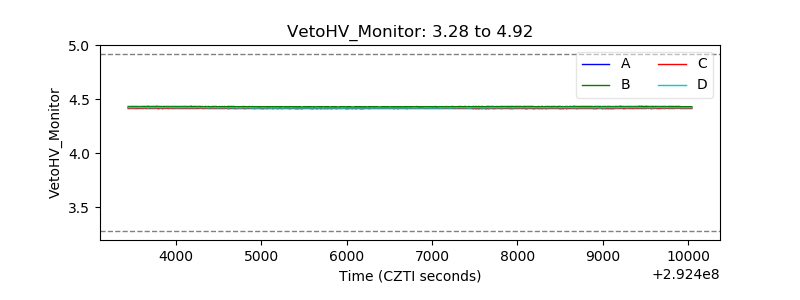 |
| Veto LLD | 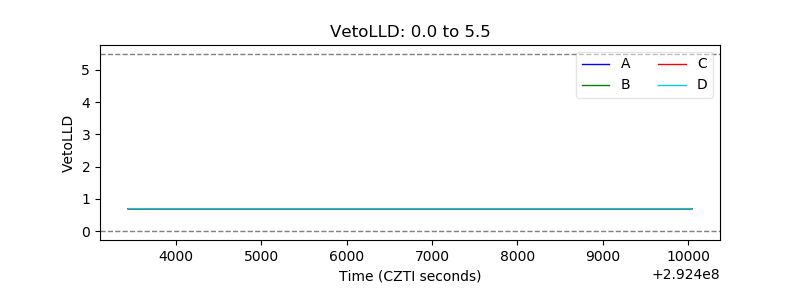 |
| Alpha Counter | 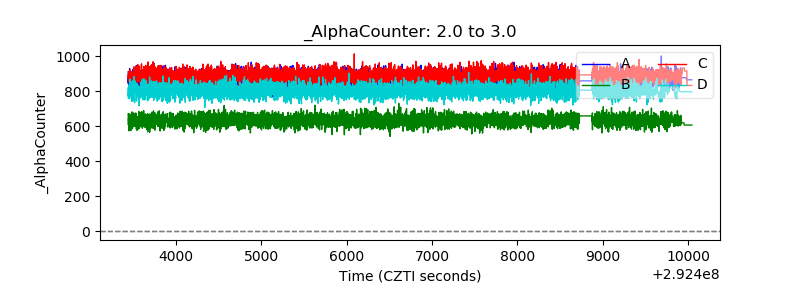 |
| _CPM_Rate | 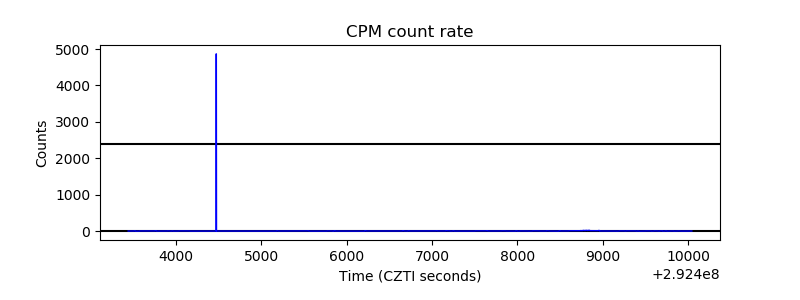 |
| CZT Counter | 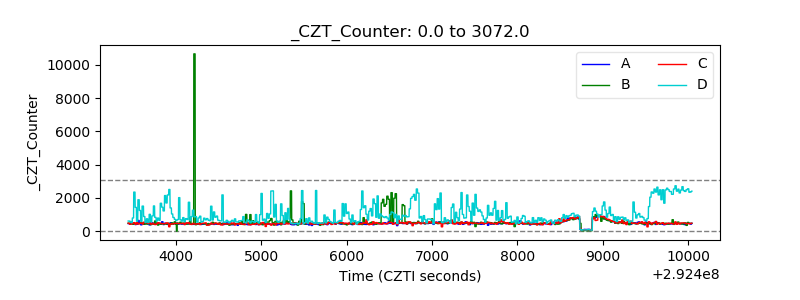 |
| +2.5 Volts monitor |  |
| +5 Volts monitor |  |
| _ROLL_ROT | 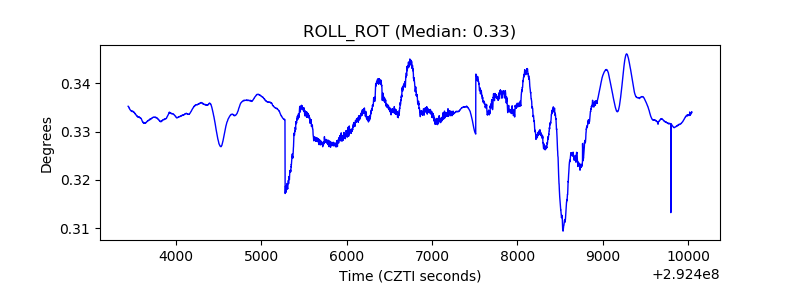 |
| _Roll_DEC | 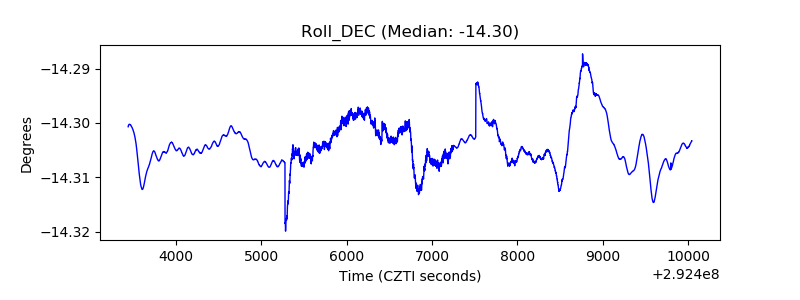 |
| _Roll_RA | 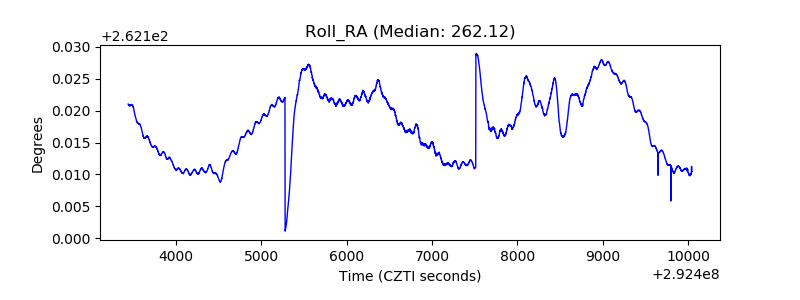 |
| Veto Counter | 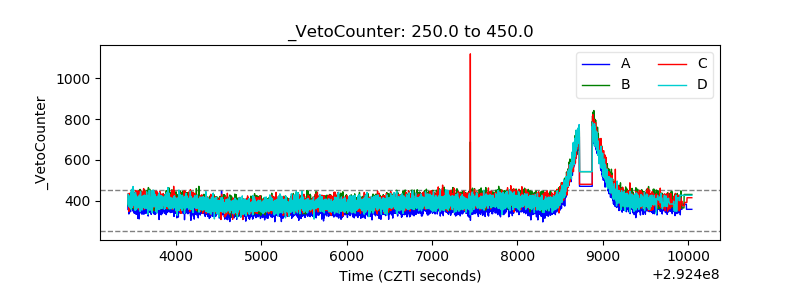 |