| Param | Original file | Final file |
|---|---|---|
| Filename | modeM0/AS1A05_046T01_9000002834_19068cztM0_level2.evt | modeM0/AS1A05_046T01_9000002834_19068cztM0_level2_quad_clean.evt |
| Size (bytes) | 512,688,960 | 53,902,080 |
| Size | 488.9 MB | 51.4 MB |
| Events in quadrant A | 2,321,058 | 351,162 |
| Events in quadrant B | 2,776,282 | 356,338 |
| Events in quadrant C | 2,388,377 | 348,443 |
| Events in quadrant D | 7,710,850 | 234,561 |
| Mode SS | |||
|---|---|---|---|
| Quadrant | BADHDUFLAG | Total packets | Discarded packets |
| A | 0 | 146 | 40 |
| B | 0 | 144 | 42 |
| C | 0 | 144 | 38 |
| D | 0 | 145 | 43 |
| Mode M0 | |||
|---|---|---|---|
| Quadrant | BADHDUFLAG | Total packets | Discarded packets |
| A | 0 | 14977 | 4790 |
| B | 0 | 16222 | 4882 |
| C | 0 | 14955 | 4712 |
| D | 0 | 40691 | 14691 |
| Mode M9 | |||
|---|---|---|---|
| Quadrant | BADHDUFLAG | Total packets | Discarded packets |
| A | 0 | 2 | 0 |
| B | 0 | 2 | 0 |
| C | 0 | 3 | 1 |
| D | 0 | 2 | 1 |
| Quadrant | Total seconds | Saturated seconds | Saturation percentage |
|---|---|---|---|
| A | 4948 | 134 | 2.708165% |
| B | 4925 | 214 | 4.345178% |
| C | 4969 | 146 | 2.938217% |
| D | 4464 | 2230 | 49.955197% |
Noise dominated data is calculated using 1-second bins in cleaned event files. If a bin has >2000 counts, and if more than 50% of those come from <1% of pixels, then it is considered to be noise-dominated and hence unusable.
| Quadrant | # 1 sec bins | Bins with >0 counts | Bins with >2000 counts | High rate bins dominated by noise | Noise dominated (total time) | Noise dominated (detector-on time) | Marked lightcurve |
|---|---|---|---|---|---|---|---|
| A | 6887 | 5414 | 0 | 0 | 0.00% | 0.00% | 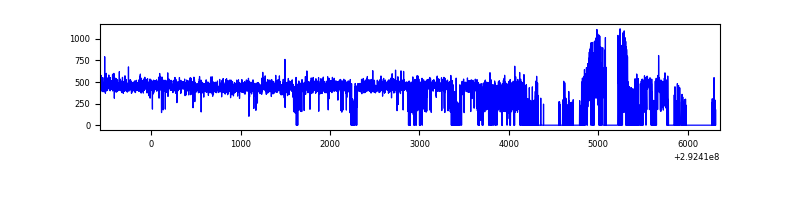 |
| B | 6934 | 5386 | 46 | 46 | 0.66% | 0.85% | 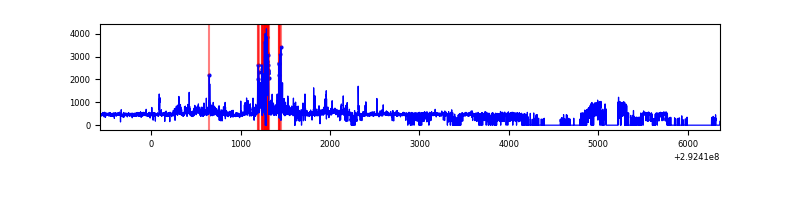 |
| C | 6902 | 5452 | 0 | 0 | 0.00% | 0.00% | 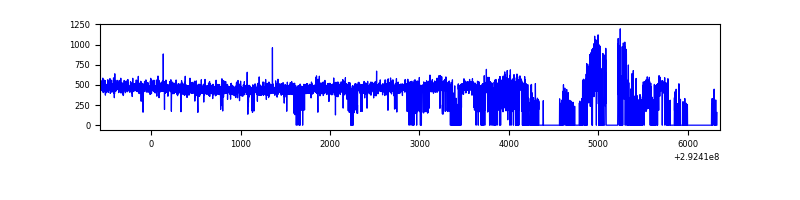 |
| D | 6916 | 4972 | 1566 | 1566 | 22.64% | 31.50% | 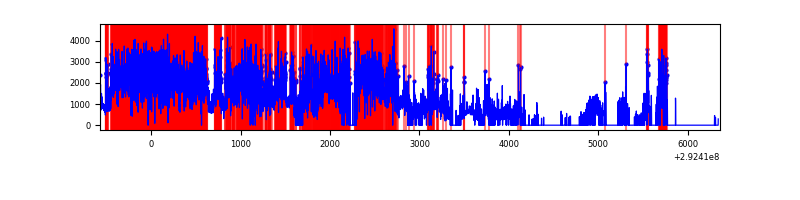 |
Top three noisy pixels from each quadrant. If the there are fewer than three noisy pixels in the level2.evt file, extra rows are filled as -1
| Pixel properties | Quadrant properties | ||||||
|---|---|---|---|---|---|---|---|
| Quadrant | DetID | PixID | Counts | Sigma | Mean | Median | Sigma |
| A | 13 | 254 | 6435 | 47.01 | 601 | 586 | 124.4 |
| A | 0 | 226 | 5196 | 37.05 | 601 | 586 | 124.4 |
| A | 3 | 137 | 4884 | 34.54 | 601 | 586 | 124.4 |
| B | 0 | 189 | 123267 | 1043.49 | 593 | 576 | 117.6 |
| B | 7 | 220 | 122023 | 1032.91 | 593 | 576 | 117.6 |
| B | 4 | 216 | 104223 | 881.52 | 593 | 576 | 117.6 |
| C | 14 | 238 | 89754 | 643.67 | 581 | 584 | 138.5 |
| C | 3 | 233 | 15928 | 110.76 | 581 | 584 | 138.5 |
| C | 8 | 128 | 10124 | 68.86 | 581 | 584 | 138.5 |
| D | 7 | 238 | 4500582 | 41380.49 | 435 | 421 | 108.8 |
| D | 1 | 20 | 1053455 | 9683.0 | 435 | 421 | 108.8 |
| D | 1 | 52 | 255616 | 2346.6 | 435 | 421 | 108.8 |
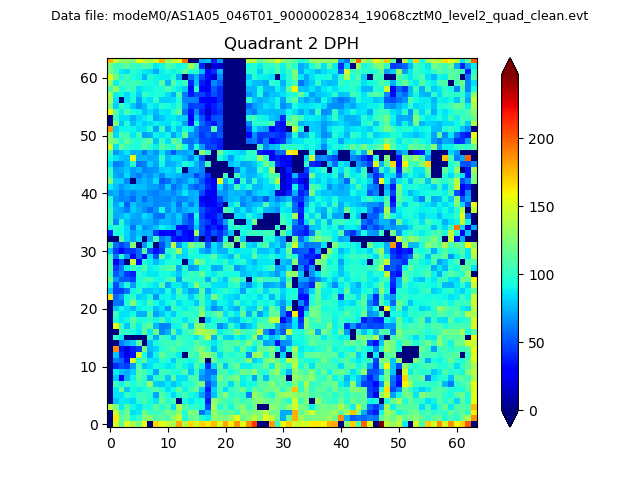
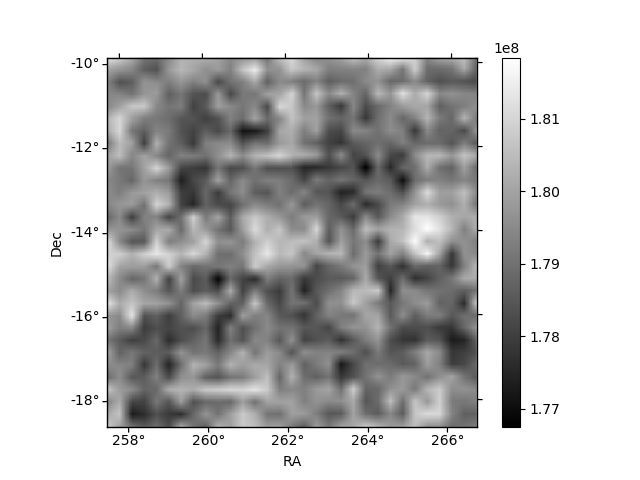
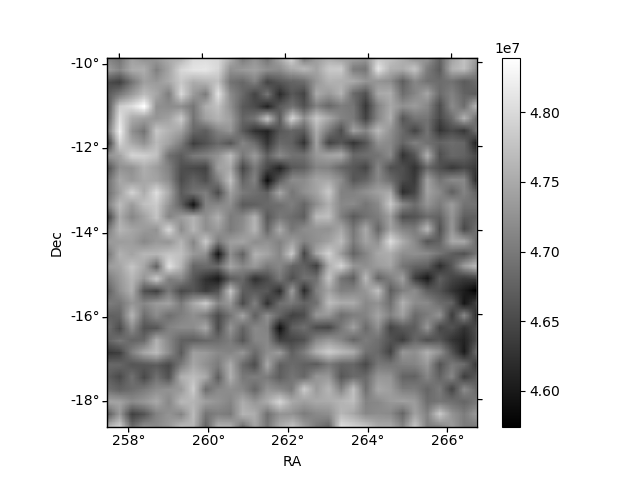
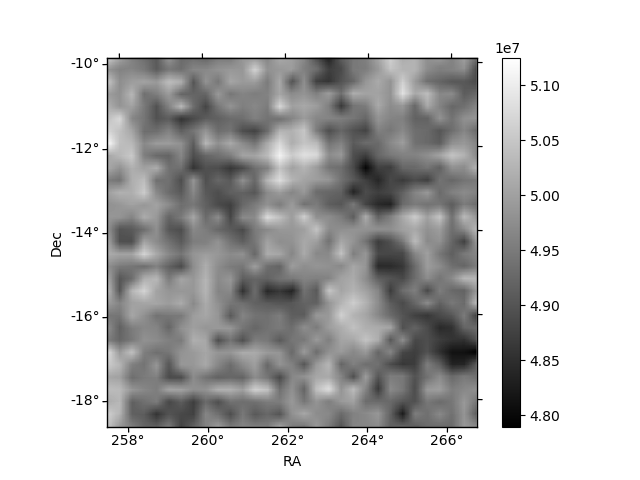
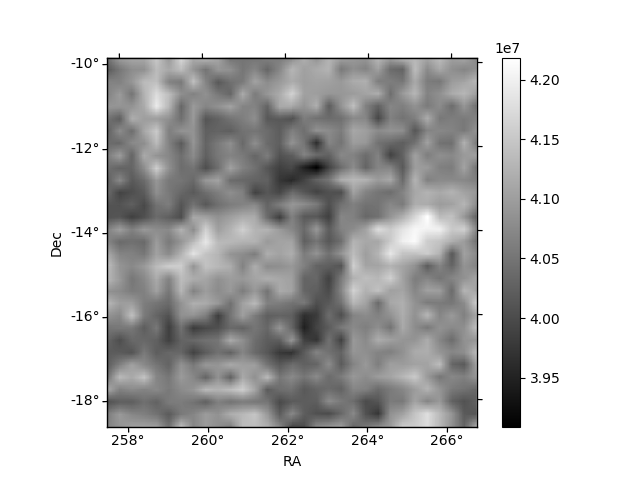
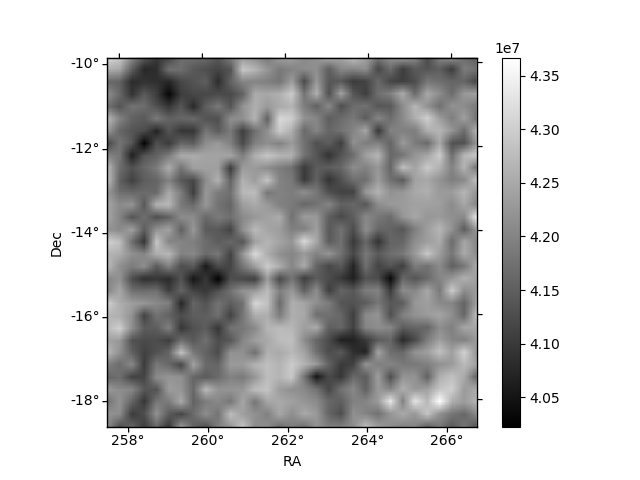
Histogram calculated using DETX and DETY for each event in the final _common_clean file
| Quadrant A | 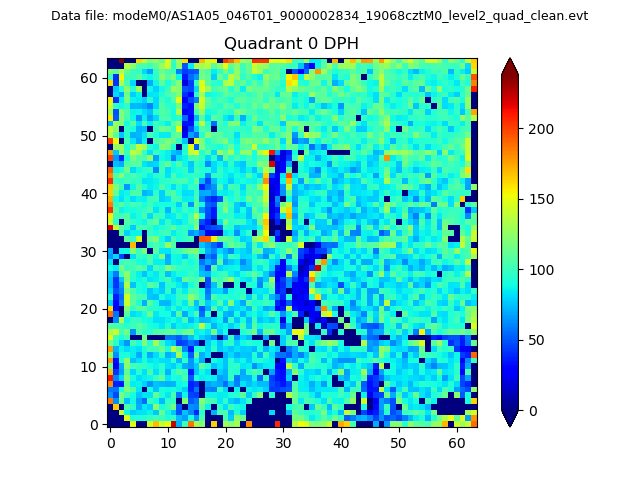 |
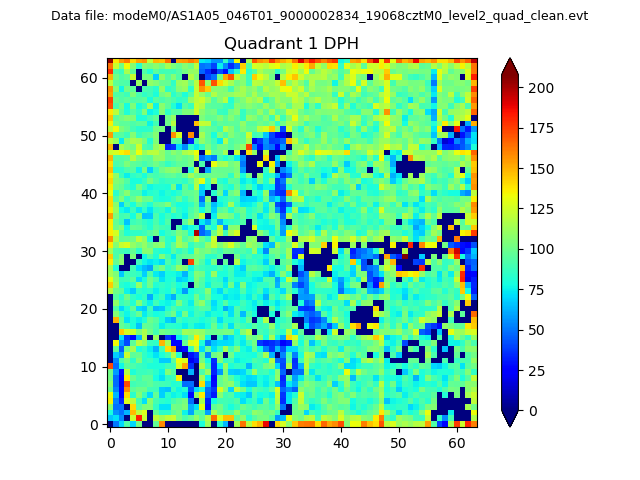 |
Quadrant B |
|---|---|---|---|
| Quadrant D | 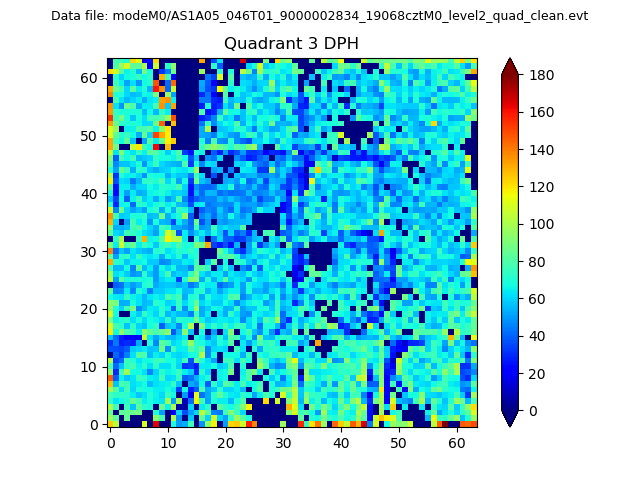 |
 |
Quadrant C |
| Plot type | Count rate plots | Images |
|---|---|---|
| Comparison with Poisson distribution Blue bars denote a histogram of data divided into 1 sec bins. Red curve is a Poisson curve with rate = median count rate of data. |
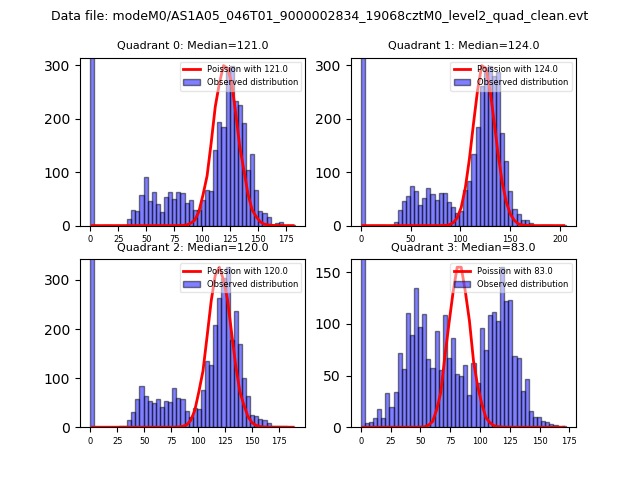 |
 |
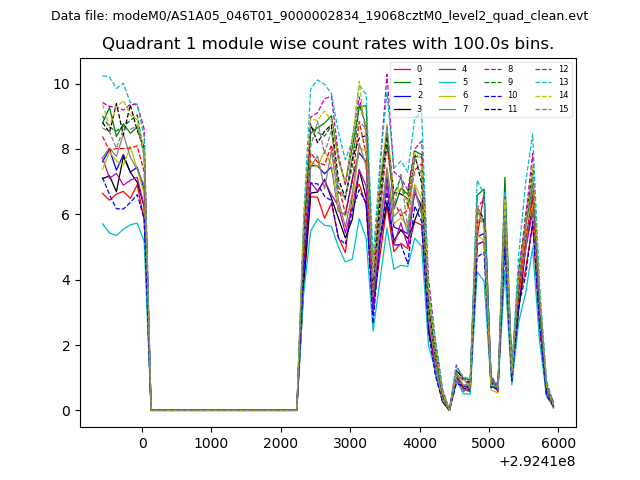
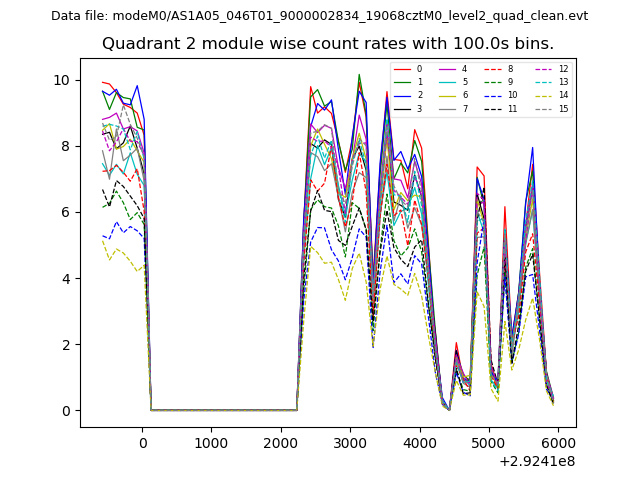
| Quadrant-wise count rates Data is divided into 100 sec bins |
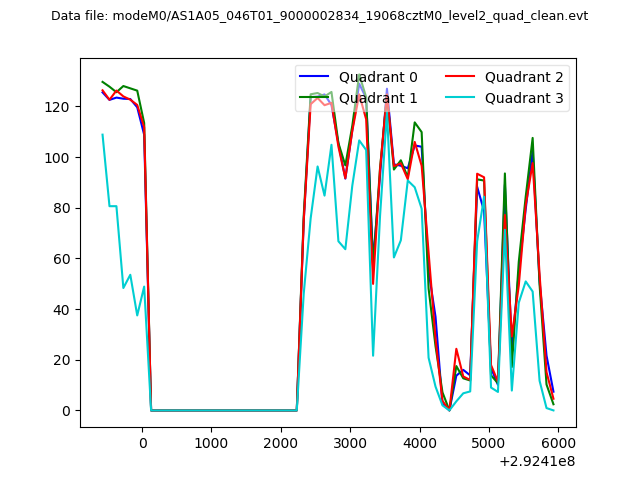 |
|
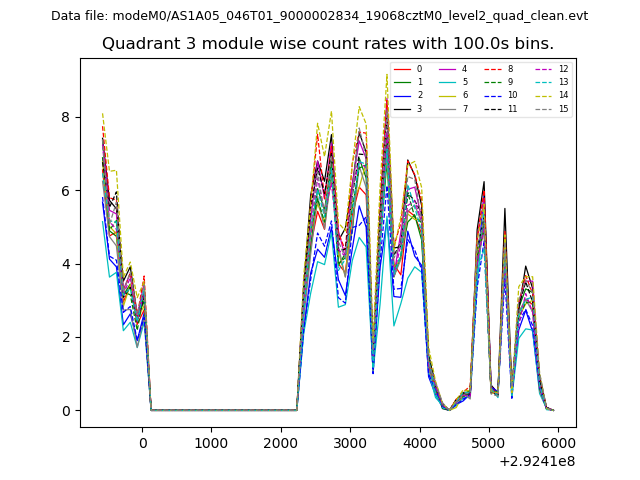
| Module-wise count rates for Quadrant A Data is divided into 100 sec bins |
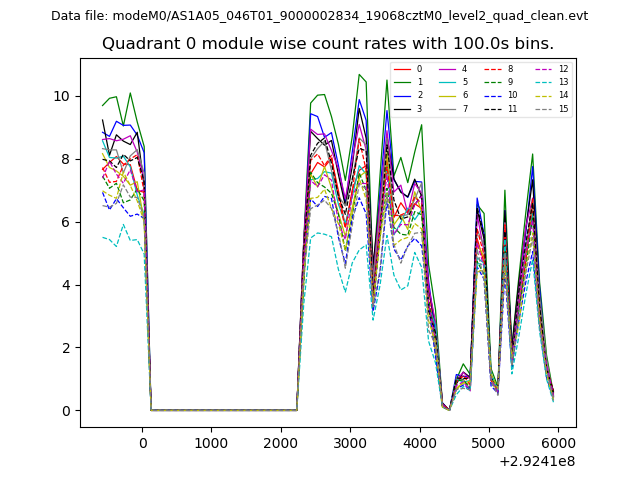 |
 |
| Module-wise count rates for Quadrant B Data is divided into 100 sec bins |
 |
 |
| Module-wise count rates for Quadrant C Data is divided into 100 sec bins |
 |
 |
| Module-wise count rates for Quadrant D Data is divided into 100 sec bins |
 |
 |
| Parameter | Plot |
|---|---|
| CZT HV Monitor | 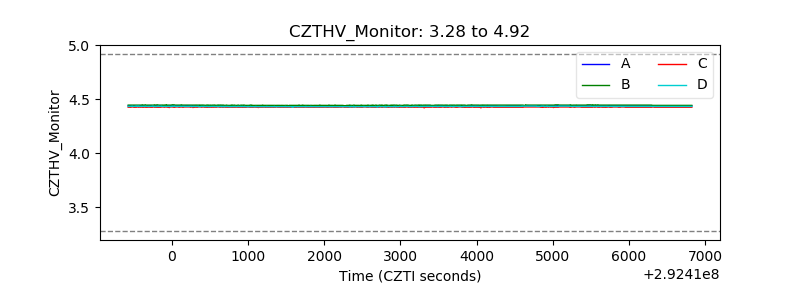 |
| D_VDD | 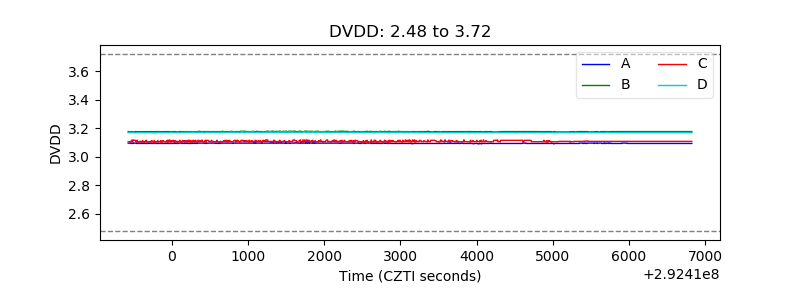 |
| Temperature 1 | 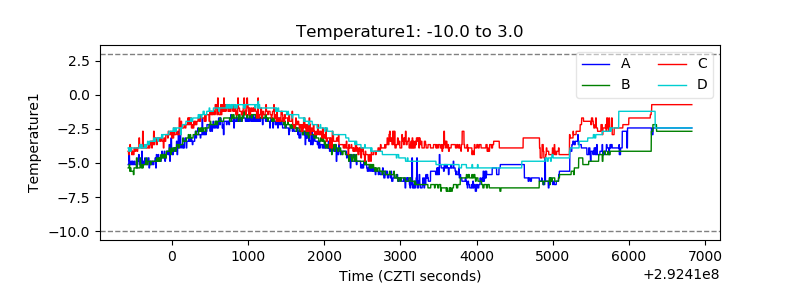 |
| Veto HV Monitor | 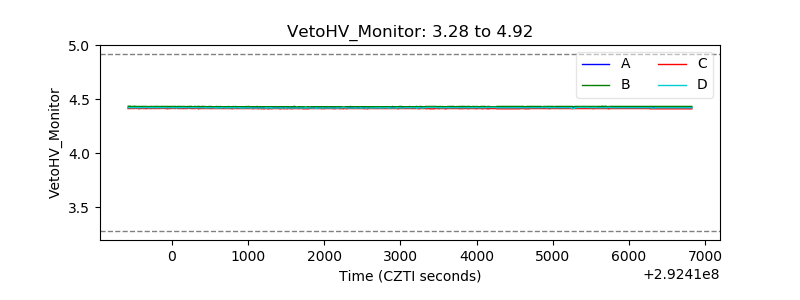 |
| Veto LLD | 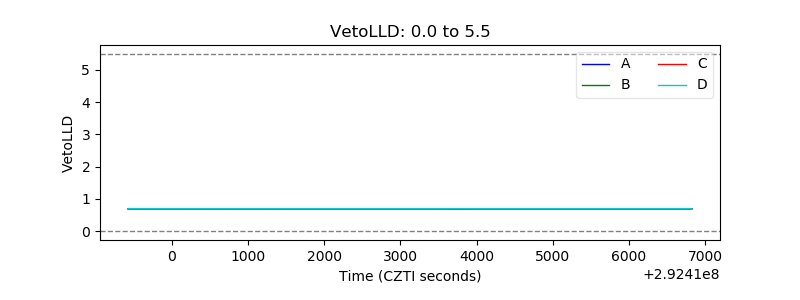 |
| Alpha Counter | 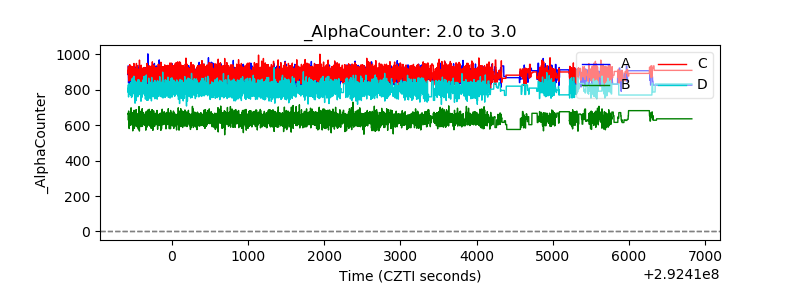 |
| _CPM_Rate | 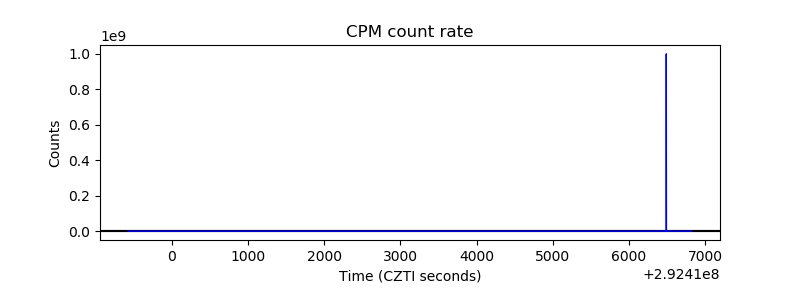 |
| CZT Counter | 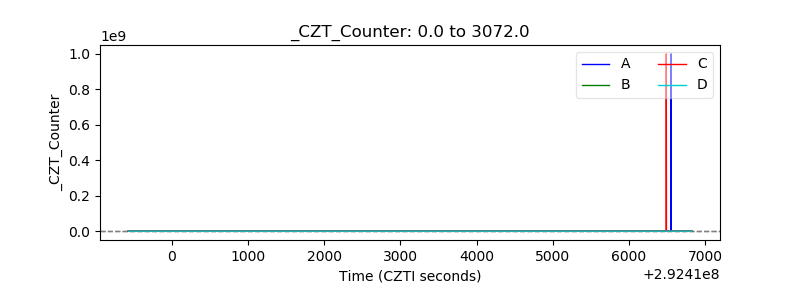 |
| +2.5 Volts monitor |  |
| +5 Volts monitor |  |
| _ROLL_ROT | 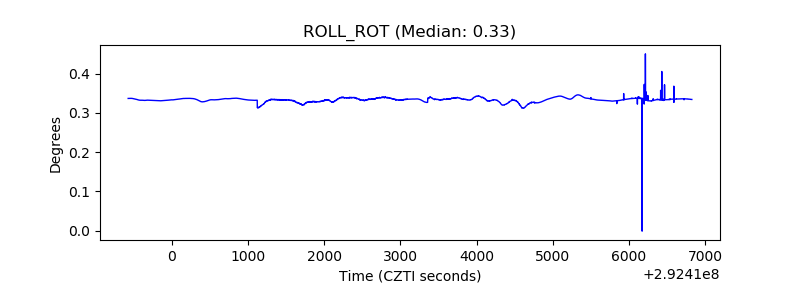 |
| _Roll_DEC | 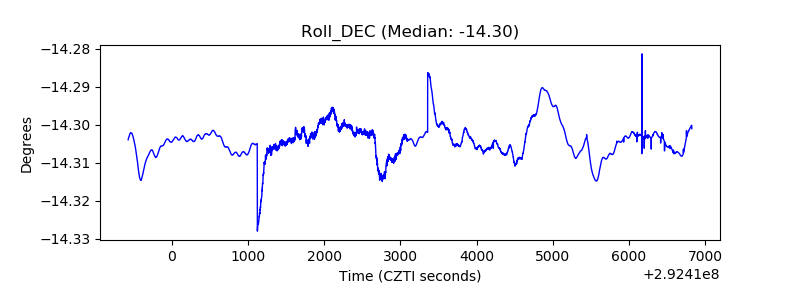 |
| _Roll_RA | 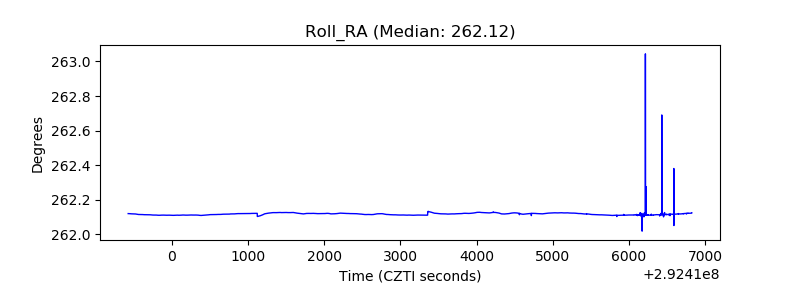 |
| Veto Counter | 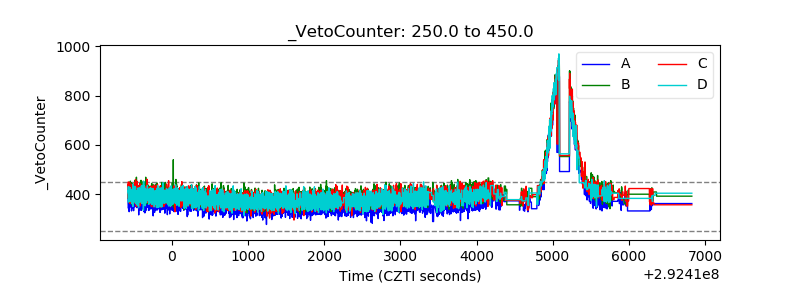 |