| Param | Original file | Final file |
|---|---|---|
| Filename | modeM0/AS1A05_046T01_9000002834_19071cztM0_level2.evt | modeM0/AS1A05_046T01_9000002834_19071cztM0_level2_quad_clean.evt |
| Size (bytes) | 1,983,251,520 | 213,456,960 |
| Size | 1.8 GB | 203.6 MB |
| Events in quadrant A | 8,912,188 | 1,348,530 |
| Events in quadrant B | 10,869,903 | 1,367,287 |
| Events in quadrant C | 9,001,654 | 1,335,572 |
| Events in quadrant D | 30,018,890 | 1,121,528 |
| Mode SS | |||
|---|---|---|---|
| Quadrant | BADHDUFLAG | Total packets | Discarded packets |
| A | 0 | 380 | 0 |
| B | 0 | 380 | 0 |
| C | 0 | 380 | 0 |
| D | 0 | 380 | 0 |
| Mode M0 | |||
|---|---|---|---|
| Quadrant | BADHDUFLAG | Total packets | Discarded packets |
| A | 0 | 38790 | 4 |
| B | 0 | 44249 | 4 |
| C | 0 | 38630 | 4 |
| D | 0 | 102204 | 5 |
| Mode M9 | |||
|---|---|---|---|
| Quadrant | BADHDUFLAG | Total packets | Discarded packets |
| A | 0 | 21 | 0 |
| B | 0 | 21 | 0 |
| C | 0 | 21 | 0 |
| D | 0 | 21 | 0 |
| Quadrant | Total seconds | Saturated seconds | Saturation percentage |
|---|---|---|---|
| A | 18733 | 337 | 1.798964% |
| B | 18734 | 691 | 3.688481% |
| C | 18734 | 367 | 1.959005% |
| D | 18733 | 7233 | 38.611007% |
Noise dominated data is calculated using 1-second bins in cleaned event files. If a bin has >2000 counts, and if more than 50% of those come from <1% of pixels, then it is considered to be noise-dominated and hence unusable.
| Quadrant | # 1 sec bins | Bins with >0 counts | Bins with >2000 counts | High rate bins dominated by noise | Noise dominated (total time) | Noise dominated (detector-on time) | Marked lightcurve |
|---|---|---|---|---|---|---|---|
| A | 20648 | 18737 | 14 | 14 | 0.07% | 0.07% | 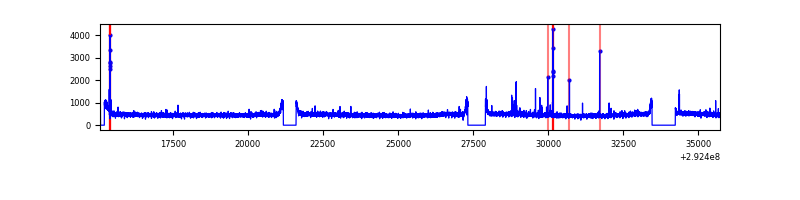 |
| B | 20649 | 18738 | 178 | 178 | 0.86% | 0.95% | 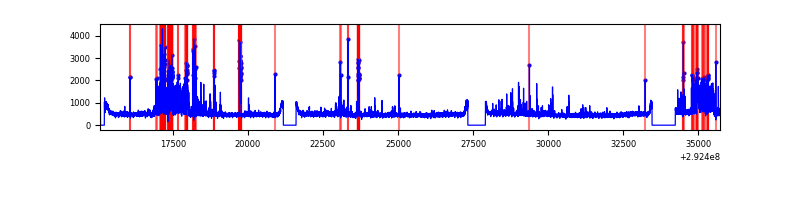 |
| C | 20649 | 18738 | 0 | 0 | 0.00% | 0.00% | 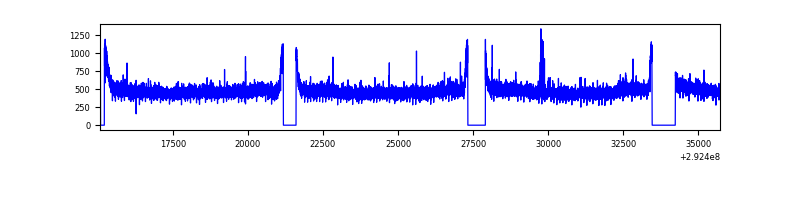 |
| D | 20648 | 18736 | 5547 | 5547 | 26.86% | 29.61% | 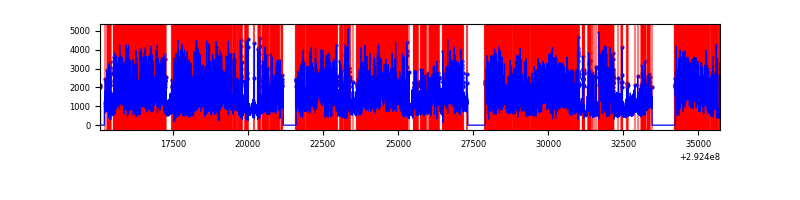 |
Top three noisy pixels from each quadrant. If the there are fewer than three noisy pixels in the level2.evt file, extra rows are filled as -1
| Pixel properties | Quadrant properties | ||||||
|---|---|---|---|---|---|---|---|
| Quadrant | DetID | PixID | Counts | Sigma | Mean | Median | Sigma |
| A | 9 | 143 | 113795 | 242.31 | 2283 | 2229 | 460.4 |
| A | 13 | 254 | 25238 | 49.97 | 2283 | 2229 | 460.4 |
| A | 0 | 226 | 19601 | 37.73 | 2283 | 2229 | 460.4 |
| B | 6 | 36 | 846192 | 1927.6 | 2267 | 2205 | 437.8 |
| B | 7 | 220 | 370027 | 840.08 | 2267 | 2205 | 437.8 |
| B | 4 | 216 | 217932 | 492.7 | 2267 | 2205 | 437.8 |
| C | 14 | 238 | 338302 | 648.61 | 2204 | 2219 | 518.2 |
| C | 3 | 233 | 75040 | 140.54 | 2204 | 2219 | 518.2 |
| C | 13 | 61 | 15663 | 25.95 | 2204 | 2219 | 518.2 |
| D | 7 | 238 | 17060993 | 35959.09 | 1932 | 1876 | 474.4 |
| D | 1 | 20 | 4055612 | 8544.91 | 1932 | 1876 | 474.4 |
| D | 12 | 218 | 607523 | 1276.65 | 1932 | 1876 | 474.4 |
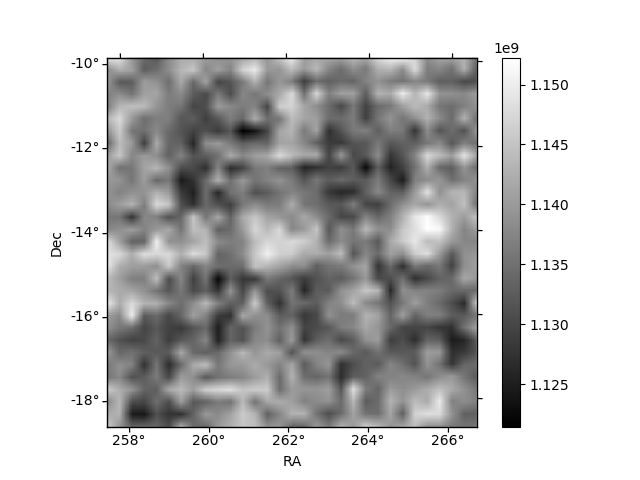
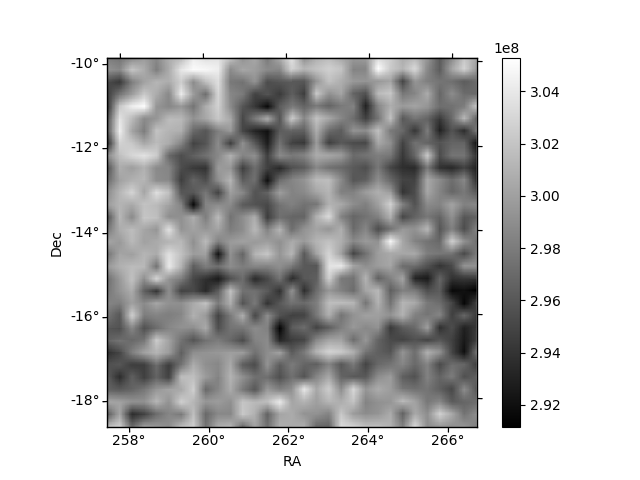
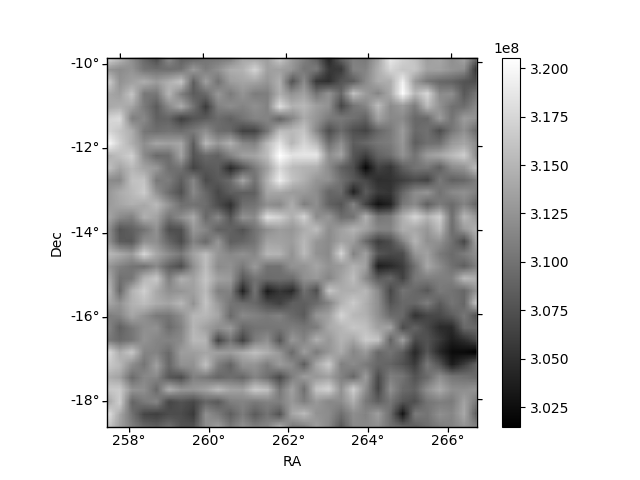
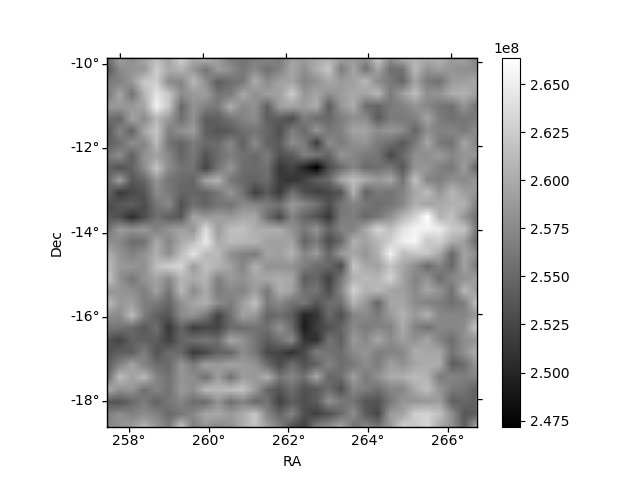
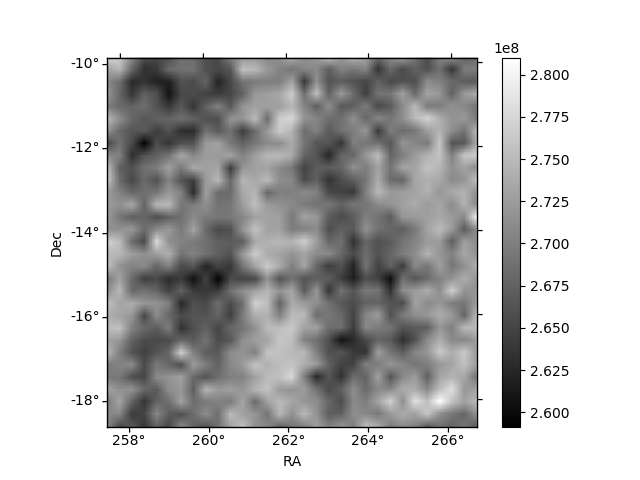
Histogram calculated using DETX and DETY for each event in the final _common_clean file
| Quadrant A | 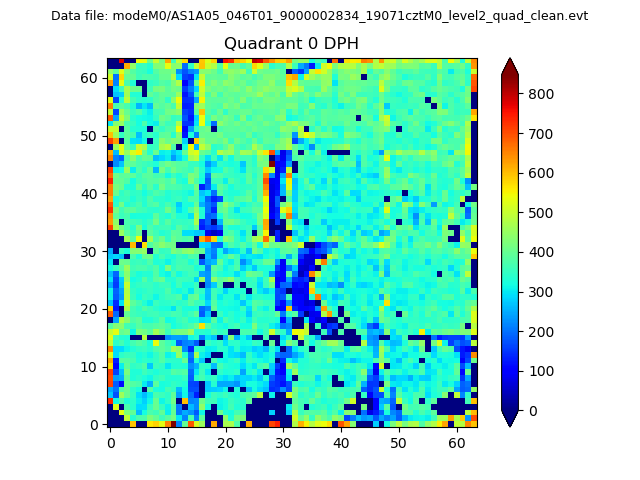 |
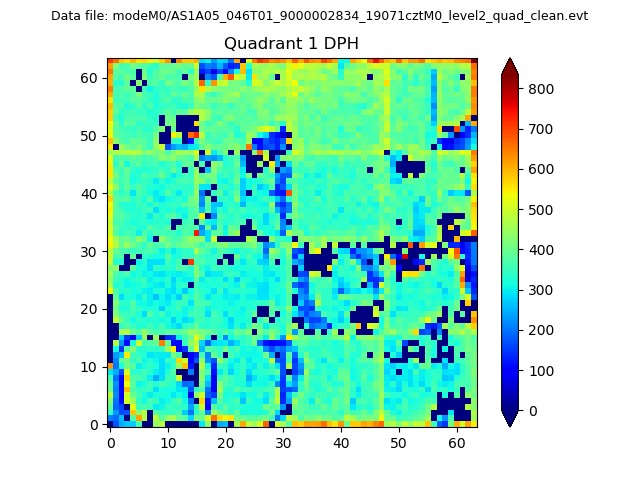 |
Quadrant B |
|---|---|---|---|
| Quadrant D | 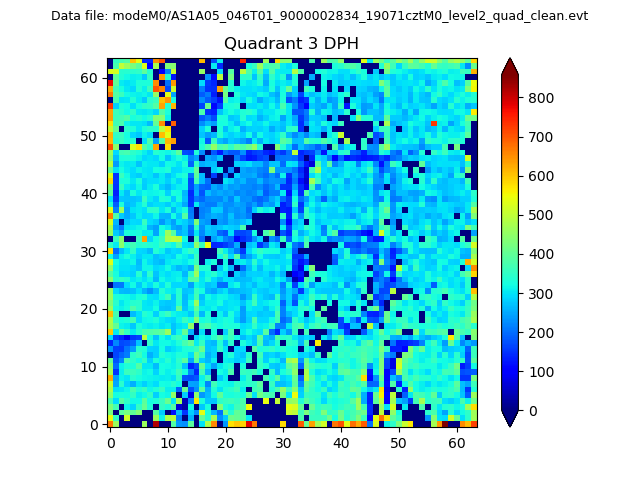 |
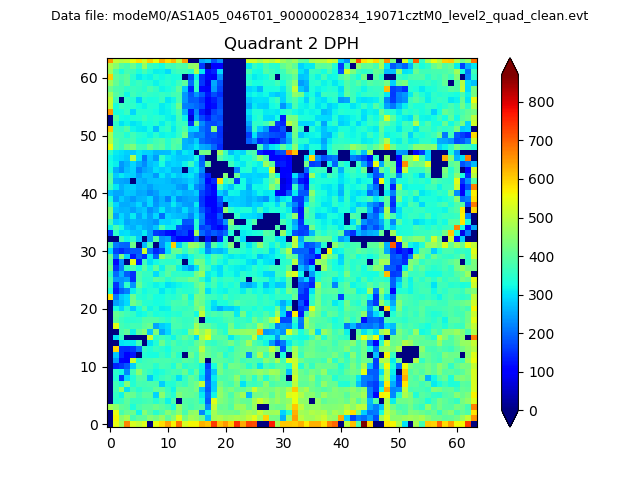 |
Quadrant C |
| Plot type | Count rate plots | Images |
|---|---|---|
| Comparison with Poisson distribution Blue bars denote a histogram of data divided into 1 sec bins. Red curve is a Poisson curve with rate = median count rate of data. |
 |
 |
| Quadrant-wise count rates Data is divided into 100 sec bins |
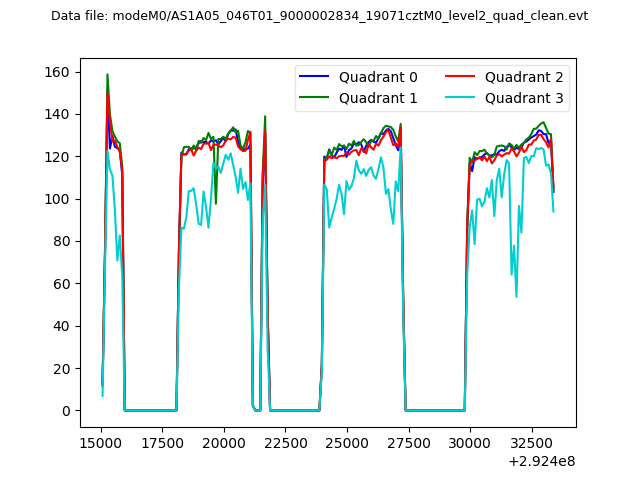 |
|
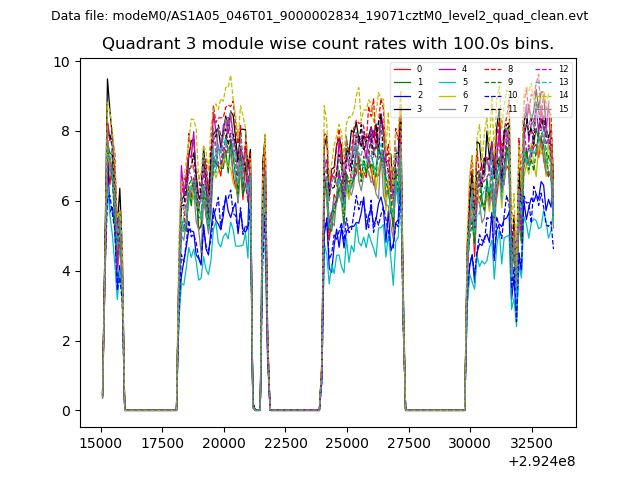
| Module-wise count rates for Quadrant A Data is divided into 100 sec bins |
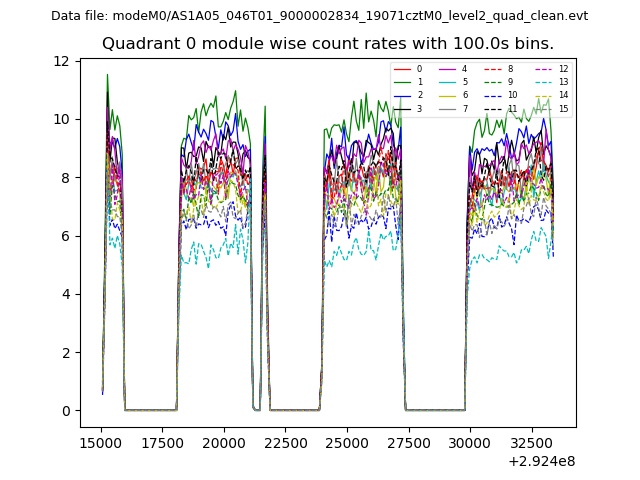 |
 |
| Module-wise count rates for Quadrant B Data is divided into 100 sec bins |
 |
 |
| Module-wise count rates for Quadrant C Data is divided into 100 sec bins |
 |
 |
| Module-wise count rates for Quadrant D Data is divided into 100 sec bins |
 |
 |
| Parameter | Plot |
|---|---|
| CZT HV Monitor |  |
| D_VDD | 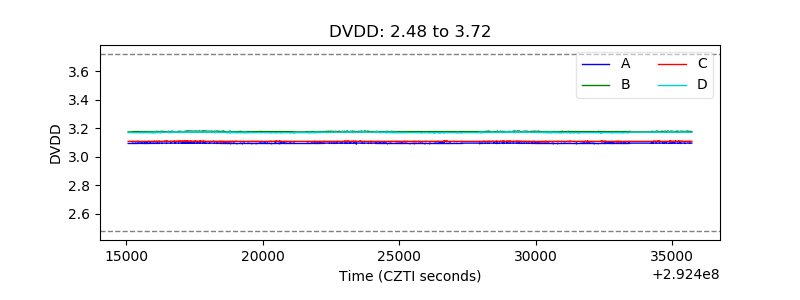 |
| Temperature 1 | 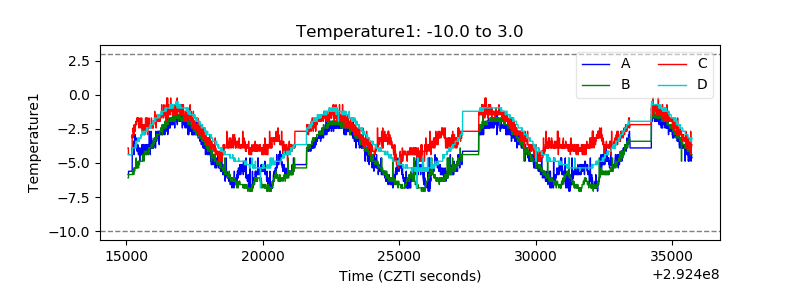 |
| Veto HV Monitor | 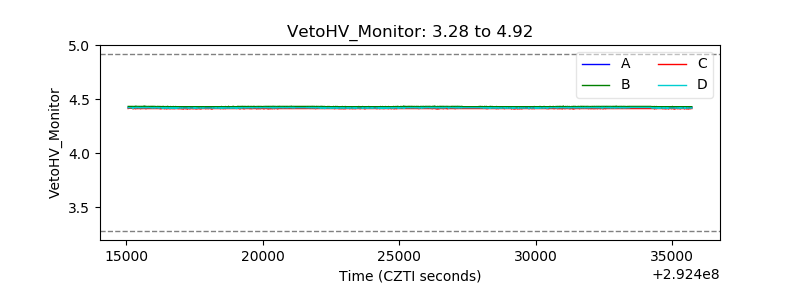 |
| Veto LLD | 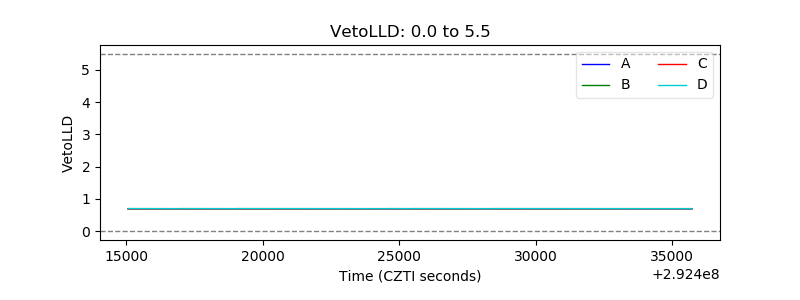 |
| Alpha Counter |  |
| _CPM_Rate | 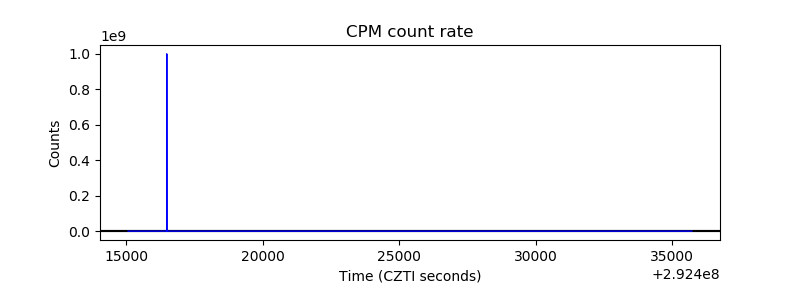 |
| CZT Counter | 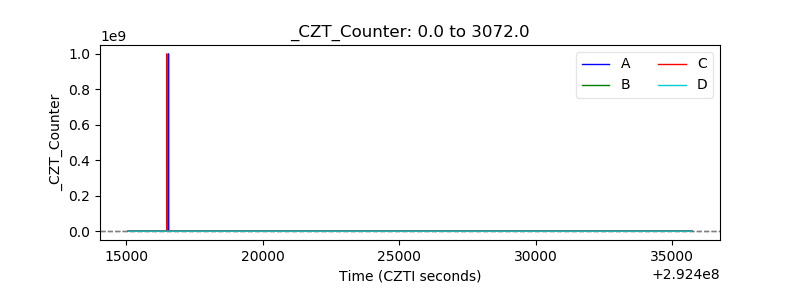 |
| +2.5 Volts monitor |  |
| +5 Volts monitor |  |
| _ROLL_ROT | 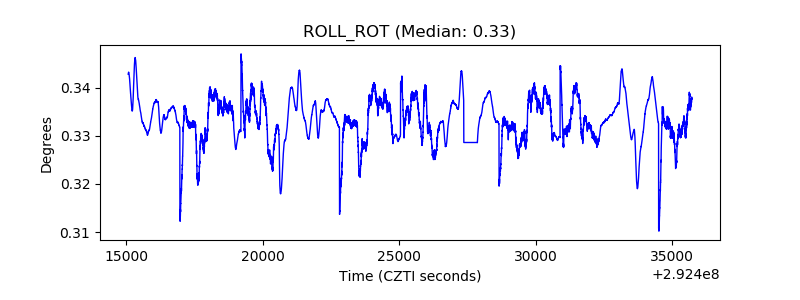 |
| _Roll_DEC | 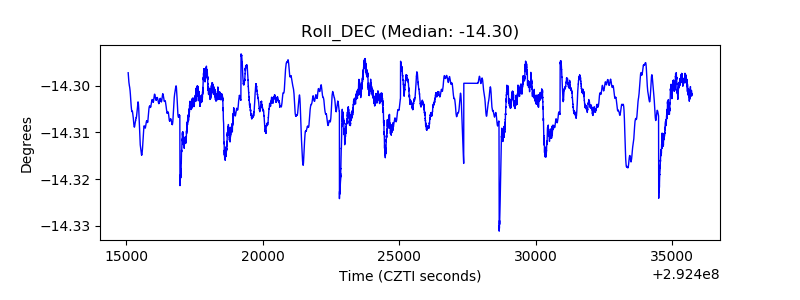 |
| _Roll_RA | 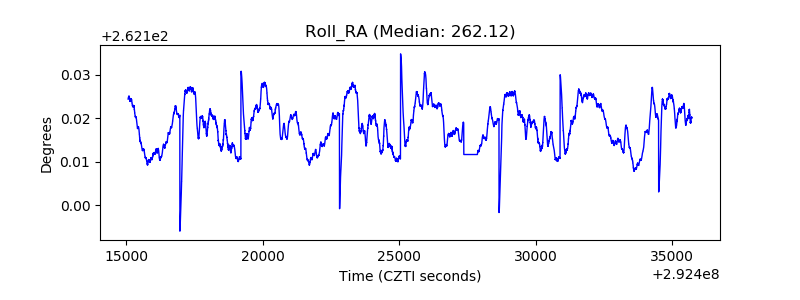 |
| Veto Counter | 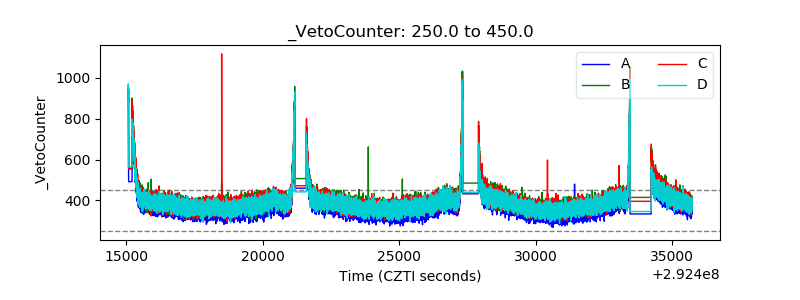 |