| Param | Original file | Final file |
|---|---|---|
| Filename | modeM0/AS1A05_046T01_9000002834_19075cztM0_level2.evt | modeM0/AS1A05_046T01_9000002834_19075cztM0_level2_quad_clean.evt |
| Size (bytes) | 741,358,080 | 92,257,920 |
| Size | 707.0 MB | 88.0 MB |
| Events in quadrant A | 3,235,565 | 631,125 |
| Events in quadrant B | 3,452,533 | 652,039 |
| Events in quadrant C | 3,950,069 | 626,022 |
| Events in quadrant D | 11,388,309 | 444,495 |
| Mode SS | |||
|---|---|---|---|
| Quadrant | BADHDUFLAG | Total packets | Discarded packets |
| A | 0 | 128 | 0 |
| B | 0 | 128 | 0 |
| C | 0 | 128 | 0 |
| D | 0 | 128 | 0 |
| Mode M0 | |||
|---|---|---|---|
| Quadrant | BADHDUFLAG | Total packets | Discarded packets |
| A | 0 | 13697 | 2 |
| B | 0 | 14394 | 2 |
| C | 0 | 15824 | 2 |
| D | 0 | 38148 | 2 |
| Mode M9 | |||
|---|---|---|---|
| Quadrant | BADHDUFLAG | Total packets | Discarded packets |
| A | 0 | 12 | 0 |
| B | 0 | 13 | 0 |
| C | 0 | 13 | 0 |
| D | 0 | 13 | 0 |
| Quadrant | Total seconds | Saturated seconds | Saturation percentage |
|---|---|---|---|
| A | 6292 | 41 | 0.651621% |
| B | 6292 | 77 | 1.223776% |
| C | 6292 | 81 | 1.287349% |
| D | 6292 | 3522 | 55.975842% |
Noise dominated data is calculated using 1-second bins in cleaned event files. If a bin has >2000 counts, and if more than 50% of those come from <1% of pixels, then it is considered to be noise-dominated and hence unusable.
| Quadrant | # 1 sec bins | Bins with >0 counts | Bins with >2000 counts | High rate bins dominated by noise | Noise dominated (total time) | Noise dominated (detector-on time) | Marked lightcurve |
|---|---|---|---|---|---|---|---|
| A | 7502 | 6293 | 9 | 9 | 0.12% | 0.14% | 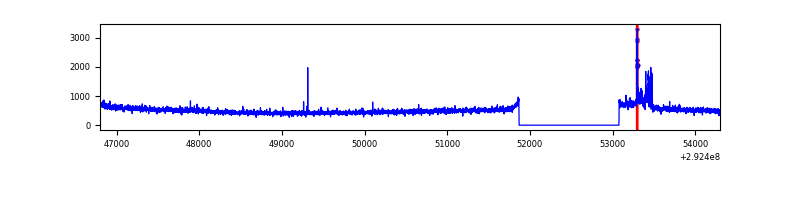 |
| B | 7502 | 6293 | 18 | 18 | 0.24% | 0.29% | 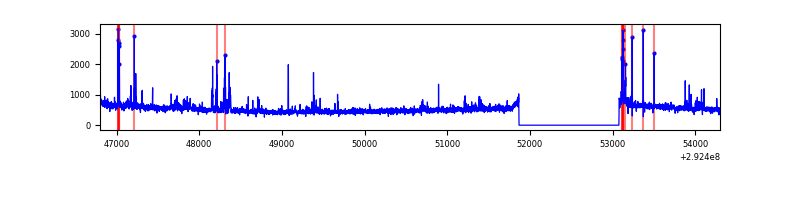 |
| C | 7502 | 6293 | 0 | 0 | 0.00% | 0.00% | 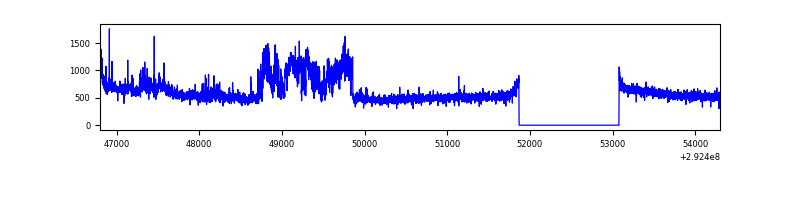 |
| D | 7502 | 6293 | 2839 | 2839 | 37.84% | 45.11% | 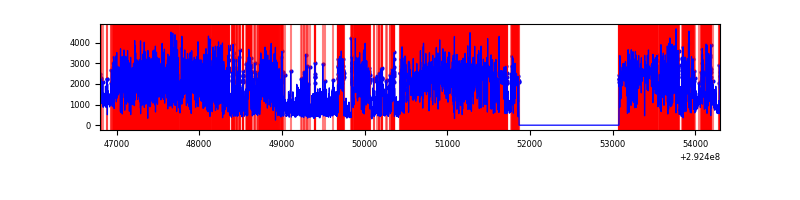 |
Top three noisy pixels from each quadrant. If the there are fewer than three noisy pixels in the level2.evt file, extra rows are filled as -1
| Pixel properties | Quadrant properties | ||||||
|---|---|---|---|---|---|---|---|
| Quadrant | DetID | PixID | Counts | Sigma | Mean | Median | Sigma |
| A | 9 | 143 | 129992 | 796.05 | 806 | 790 | 162.3 |
| A | 13 | 254 | 8179 | 45.53 | 806 | 790 | 162.3 |
| A | 0 | 226 | 7176 | 39.35 | 806 | 790 | 162.3 |
| B | 3 | 112 | 132226 | 853.43 | 813 | 795 | 154.0 |
| B | 0 | 189 | 71471 | 458.92 | 813 | 795 | 154.0 |
| B | 7 | 220 | 26579 | 167.42 | 813 | 795 | 154.0 |
| C | 3 | 233 | 761463 | 4123.37 | 787 | 794 | 184.5 |
| C | 14 | 238 | 122889 | 661.84 | 787 | 794 | 184.5 |
| C | 13 | 61 | 5282 | 24.33 | 787 | 794 | 184.5 |
| D | 7 | 238 | 6117704 | 43368.09 | 579 | 564 | 141.1 |
| D | 1 | 52 | 2705751 | 19178.7 | 579 | 564 | 141.1 |
| D | 11 | 176 | 147534 | 1041.96 | 579 | 564 | 141.1 |
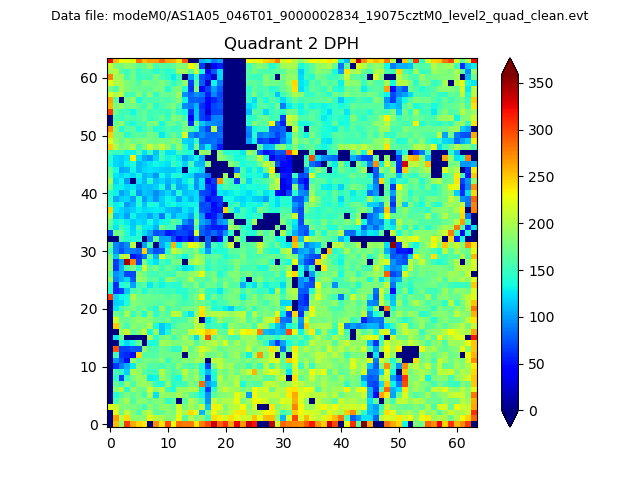
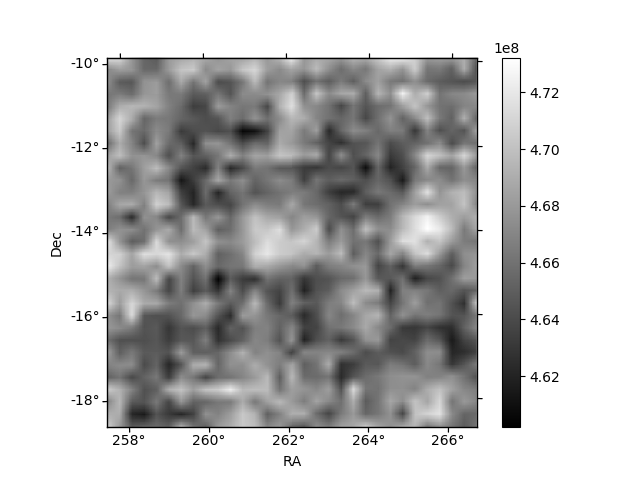
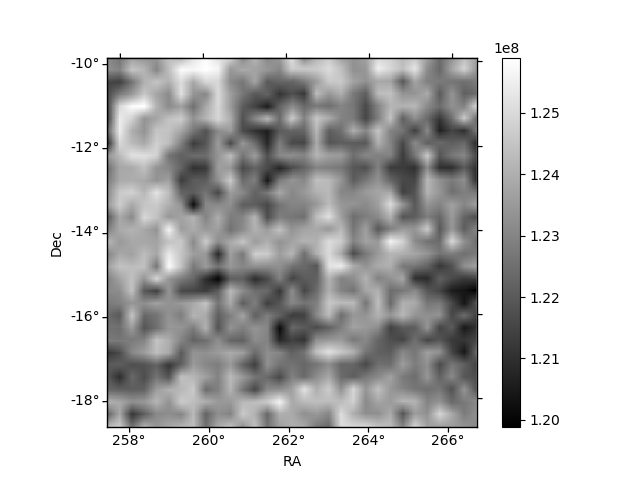
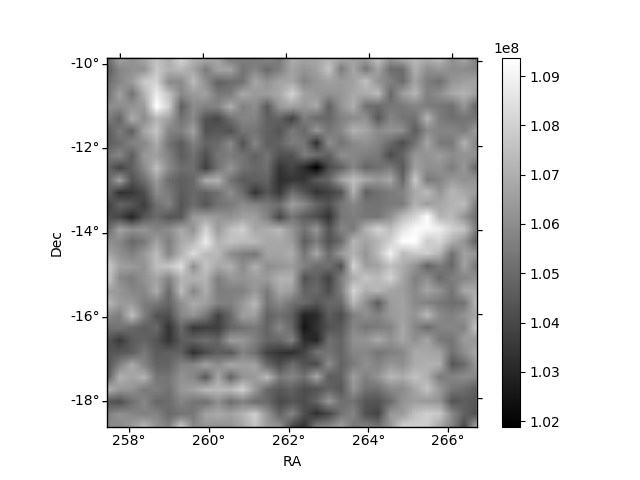
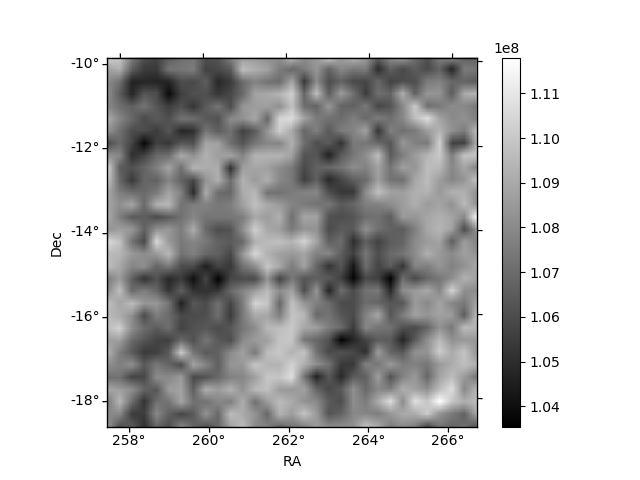
Histogram calculated using DETX and DETY for each event in the final _common_clean file
| Quadrant A | 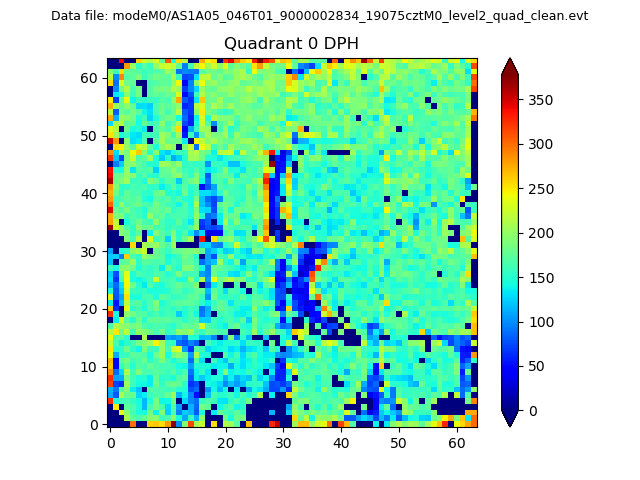 |
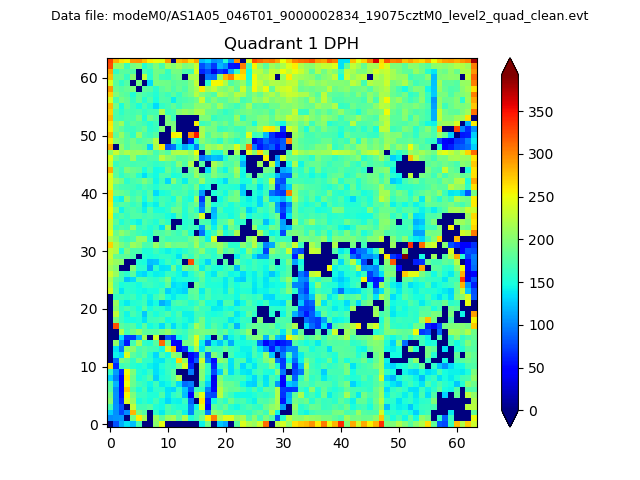 |
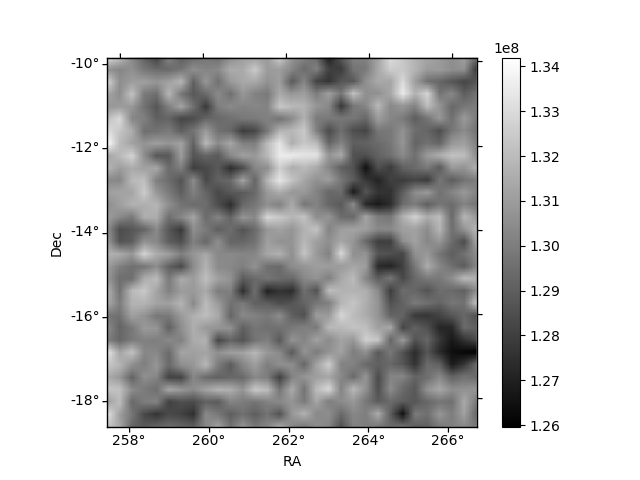
Quadrant B |
|---|---|---|---|
| Quadrant D | 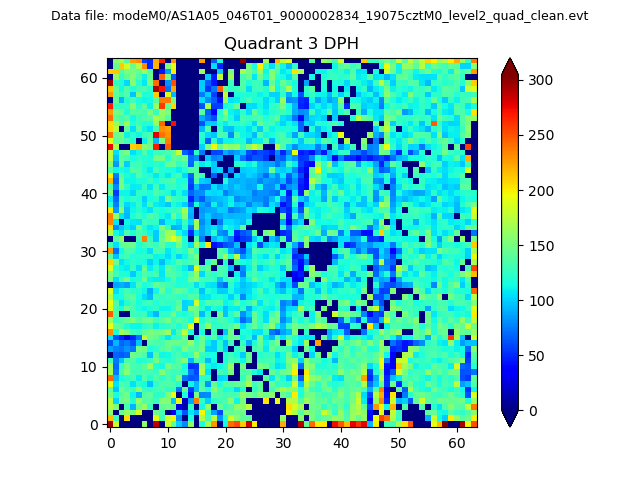 |
 |
Quadrant C |
| Plot type | Count rate plots | Images |
|---|---|---|
| Comparison with Poisson distribution Blue bars denote a histogram of data divided into 1 sec bins. Red curve is a Poisson curve with rate = median count rate of data. |
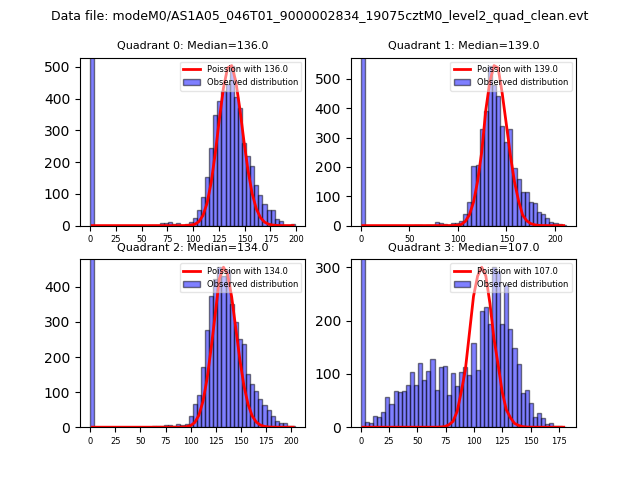 |
 |
| Quadrant-wise count rates Data is divided into 100 sec bins |
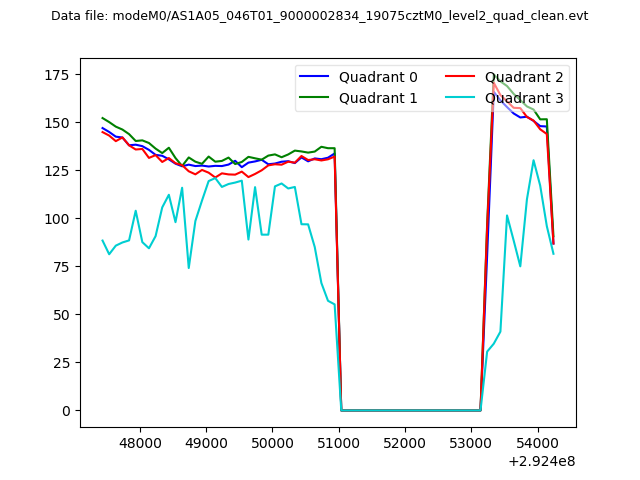 |
|
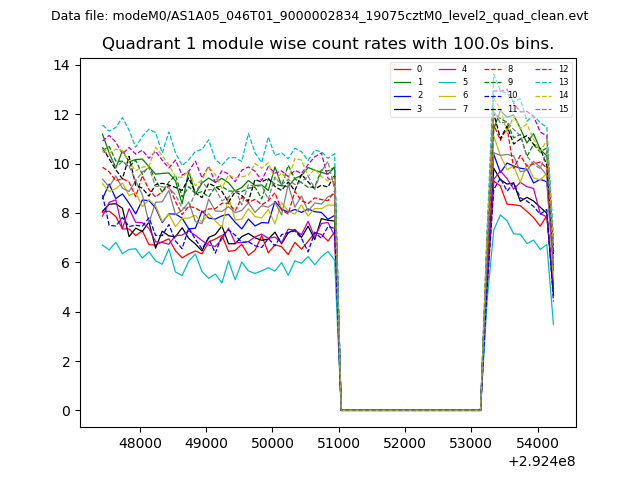
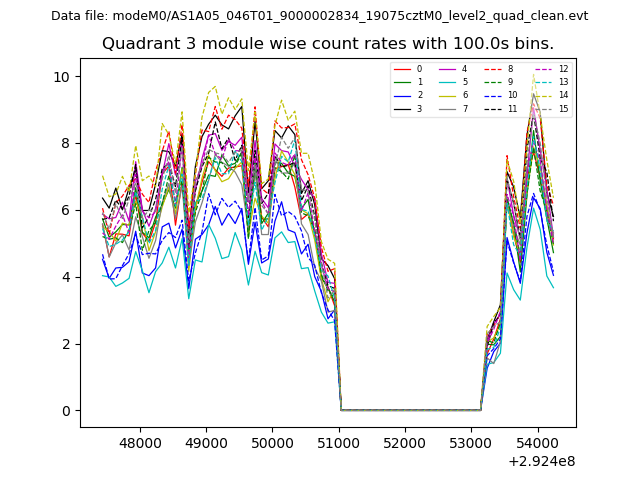
| Module-wise count rates for Quadrant A Data is divided into 100 sec bins |
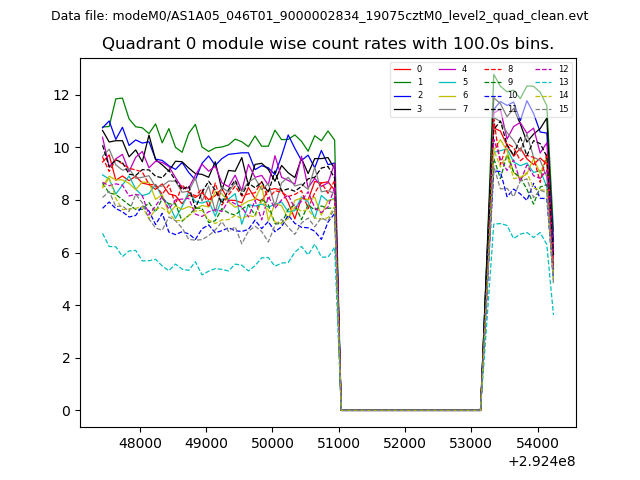 |
 |
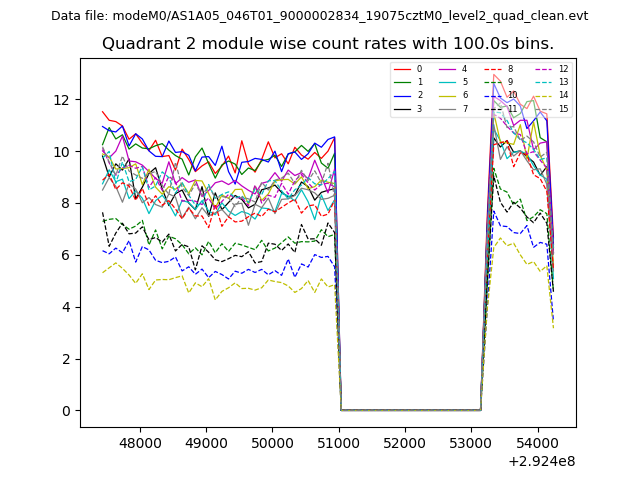
| Module-wise count rates for Quadrant B Data is divided into 100 sec bins |
 |
 |
| Module-wise count rates for Quadrant C Data is divided into 100 sec bins |
 |
 |
| Module-wise count rates for Quadrant D Data is divided into 100 sec bins |
 |
 |
| Parameter | Plot |
|---|---|
| CZT HV Monitor | 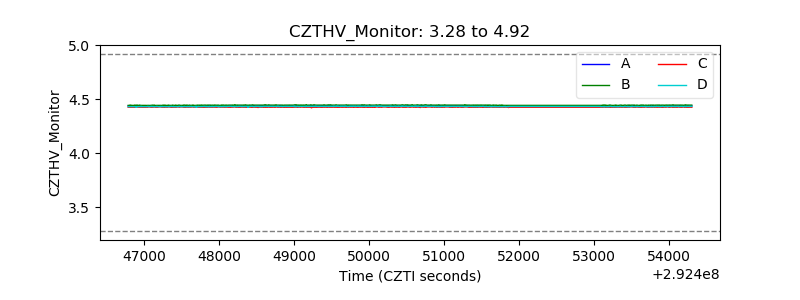 |
| D_VDD | 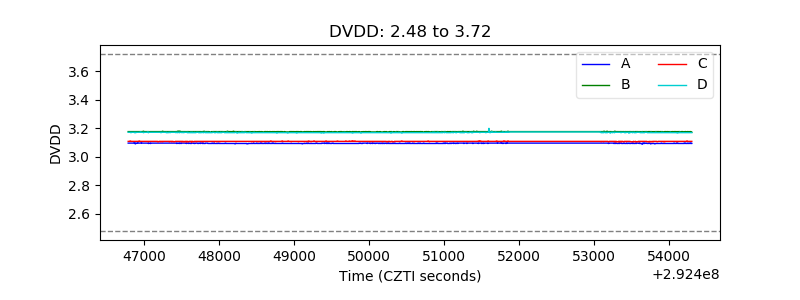 |
| Temperature 1 | 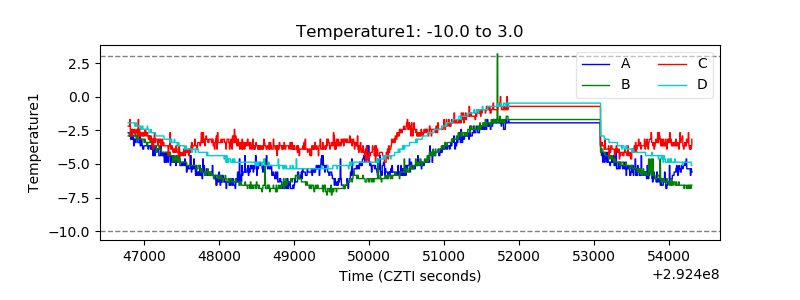 |
| Veto HV Monitor | 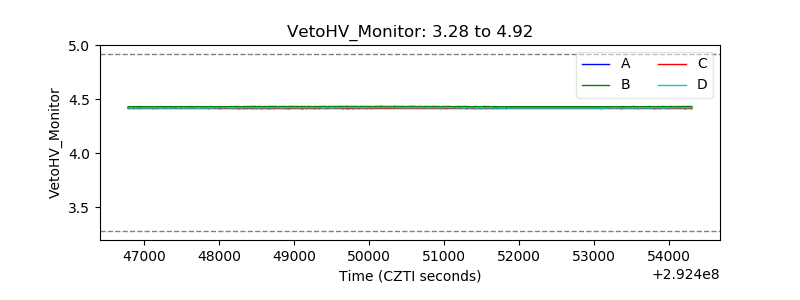 |
| Veto LLD | 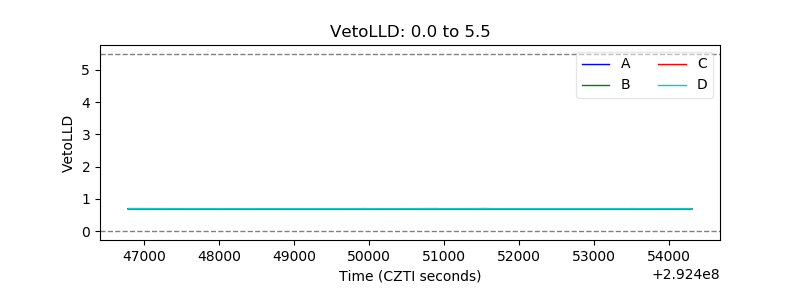 |
| Alpha Counter | 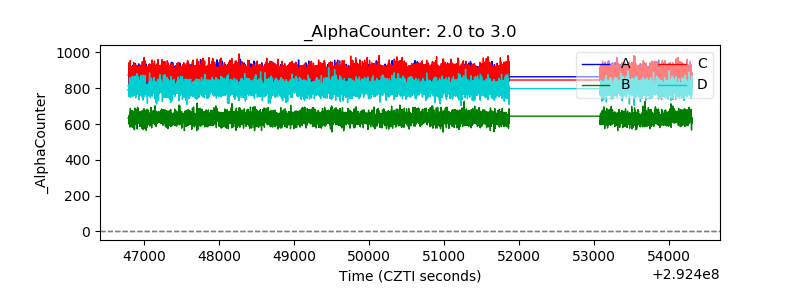 |
| _CPM_Rate | 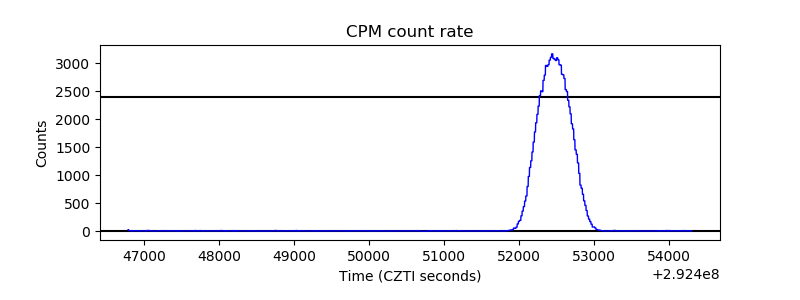 |
| CZT Counter | 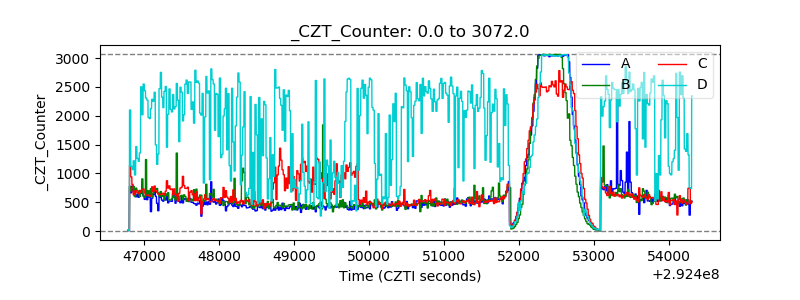 |
| +2.5 Volts monitor |  |
| +5 Volts monitor |  |
| _ROLL_ROT | 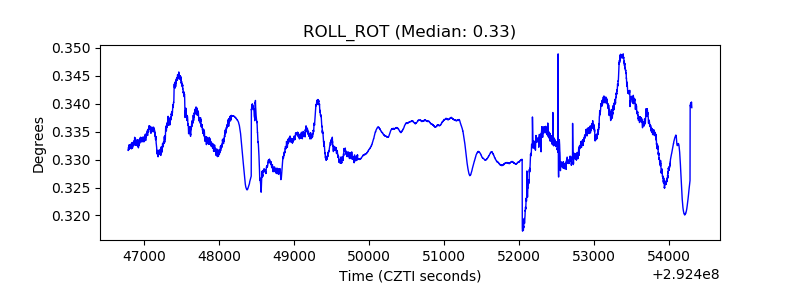 |
| _Roll_DEC | 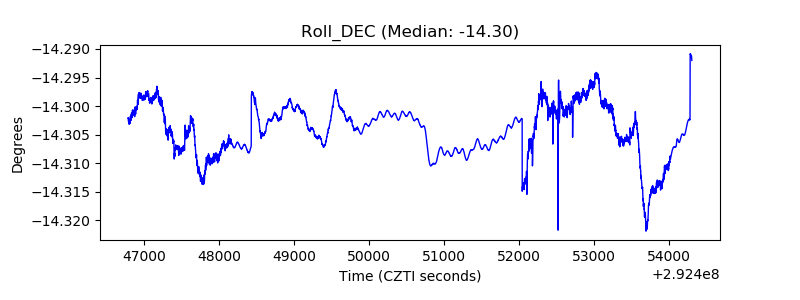 |
| _Roll_RA | 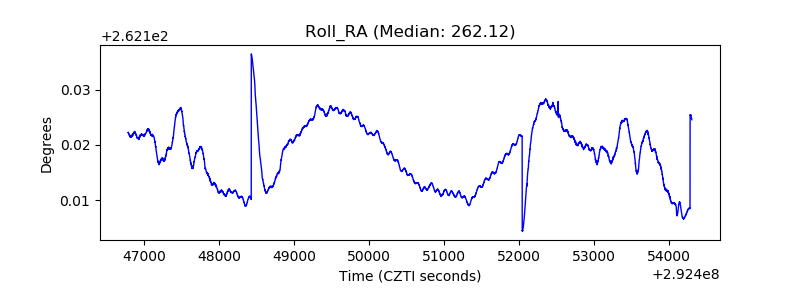 |
| Veto Counter | 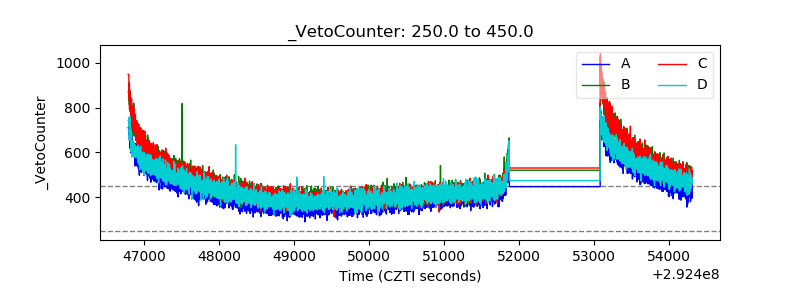 |