| Param | Original file | Final file |
|---|---|---|
| Filename | modeM0/AS1A05_046T01_9000002834_19076cztM0_level2.evt | modeM0/AS1A05_046T01_9000002834_19076cztM0_level2_quad_clean.evt |
| Size (bytes) | 733,193,280 | 98,478,720 |
| Size | 699.2 MB | 93.9 MB |
| Events in quadrant A | 3,209,965 | 699,131 |
| Events in quadrant B | 3,355,186 | 728,137 |
| Events in quadrant C | 3,213,051 | 699,145 |
| Events in quadrant D | 12,008,868 | 423,590 |
| Mode SS | |||
|---|---|---|---|
| Quadrant | BADHDUFLAG | Total packets | Discarded packets |
| A | 0 | 126 | 0 |
| B | 0 | 126 | 0 |
| C | 0 | 126 | 0 |
| D | 0 | 126 | 0 |
| Mode M0 | |||
|---|---|---|---|
| Quadrant | BADHDUFLAG | Total packets | Discarded packets |
| A | 0 | 13442 | 2 |
| B | 0 | 13873 | 2 |
| C | 0 | 13352 | 2 |
| D | 0 | 39977 | 2 |
| Mode M9 | |||
|---|---|---|---|
| Quadrant | BADHDUFLAG | Total packets | Discarded packets |
| A | 0 | 17 | 0 |
| B | 0 | 18 | 0 |
| C | 0 | 18 | 0 |
| D | 0 | 18 | 0 |
| Quadrant | Total seconds | Saturated seconds | Saturation percentage |
|---|---|---|---|
| A | 6175 | 48 | 0.777328% |
| B | 6175 | 66 | 1.068826% |
| C | 6175 | 68 | 1.101215% |
| D | 6175 | 3613 | 58.510121% |
Noise dominated data is calculated using 1-second bins in cleaned event files. If a bin has >2000 counts, and if more than 50% of those come from <1% of pixels, then it is considered to be noise-dominated and hence unusable.
| Quadrant | # 1 sec bins | Bins with >0 counts | Bins with >2000 counts | High rate bins dominated by noise | Noise dominated (total time) | Noise dominated (detector-on time) | Marked lightcurve |
|---|---|---|---|---|---|---|---|
| A | 7480 | 6176 | 9 | 9 | 0.12% | 0.15% | 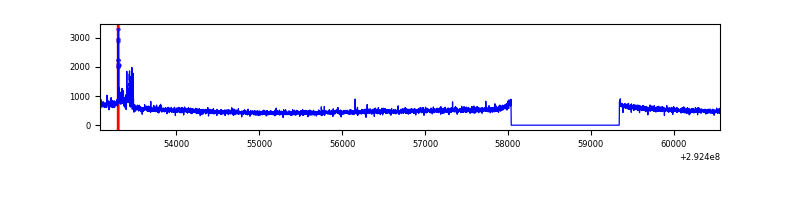 |
| B | 7480 | 6176 | 11 | 11 | 0.15% | 0.18% | 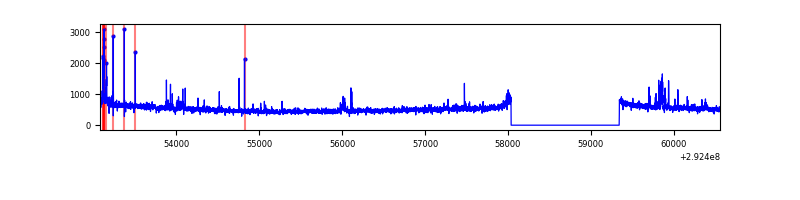 |
| C | 7480 | 6176 | 0 | 0 | 0.00% | 0.00% | 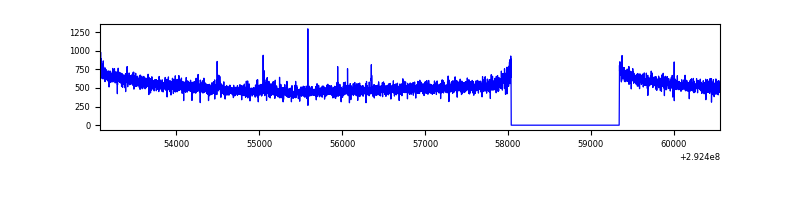 |
| D | 7479 | 6175 | 3128 | 3128 | 41.82% | 50.66% | 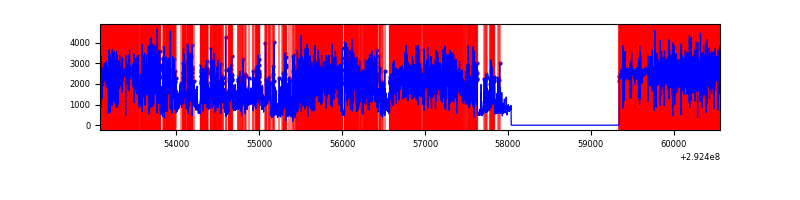 |
Top three noisy pixels from each quadrant. If the there are fewer than three noisy pixels in the level2.evt file, extra rows are filled as -1
| Pixel properties | Quadrant properties | ||||||
|---|---|---|---|---|---|---|---|
| Quadrant | DetID | PixID | Counts | Sigma | Mean | Median | Sigma |
| A | 9 | 143 | 119381 | 734.2 | 802 | 785 | 161.5 |
| A | 13 | 254 | 8910 | 50.3 | 802 | 785 | 161.5 |
| A | 0 | 226 | 6888 | 37.78 | 802 | 785 | 161.5 |
| B | 3 | 112 | 67086 | 437.1 | 812 | 793 | 151.7 |
| B | 0 | 189 | 59167 | 384.89 | 812 | 793 | 151.7 |
| B | 0 | 198 | 22660 | 144.18 | 812 | 793 | 151.7 |
| C | 14 | 238 | 124629 | 677.52 | 787 | 795 | 182.8 |
| C | 3 | 233 | 17331 | 90.47 | 787 | 795 | 182.8 |
| C | 13 | 61 | 5467 | 25.56 | 787 | 795 | 182.8 |
| D | 7 | 238 | 7894741 | 58777.28 | 553 | 538 | 134.3 |
| D | 1 | 52 | 1557455 | 11592.22 | 553 | 538 | 134.3 |
| D | 12 | 218 | 312747 | 2324.59 | 553 | 538 | 134.3 |
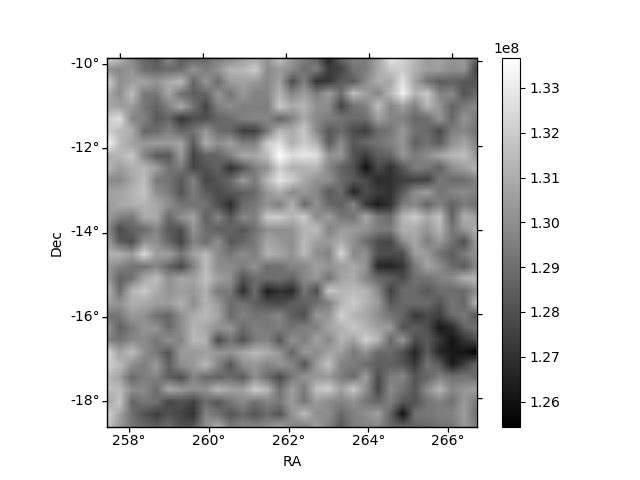
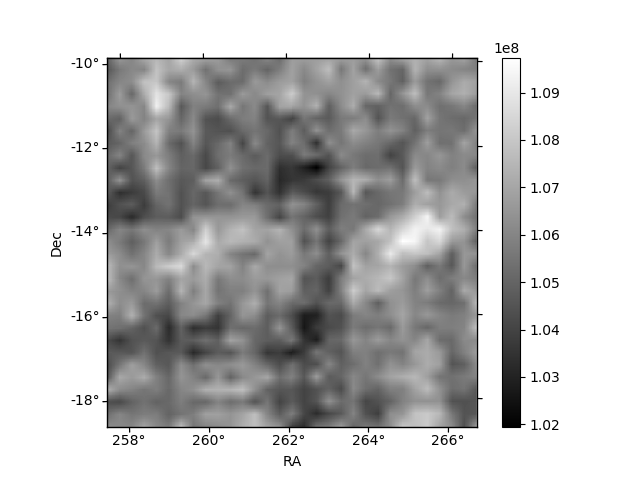
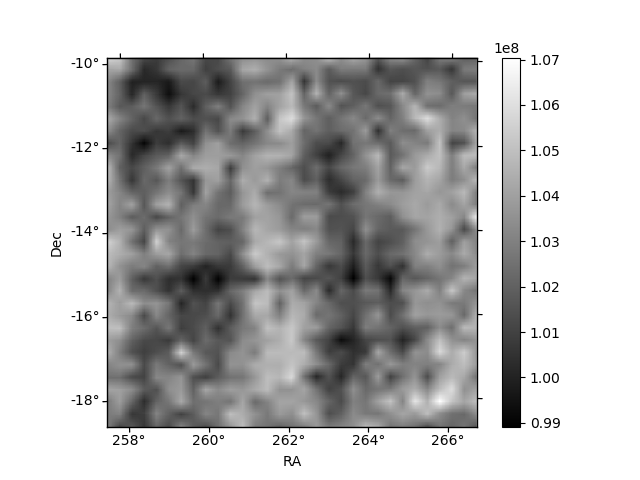
Histogram calculated using DETX and DETY for each event in the final _common_clean file
| Quadrant A | 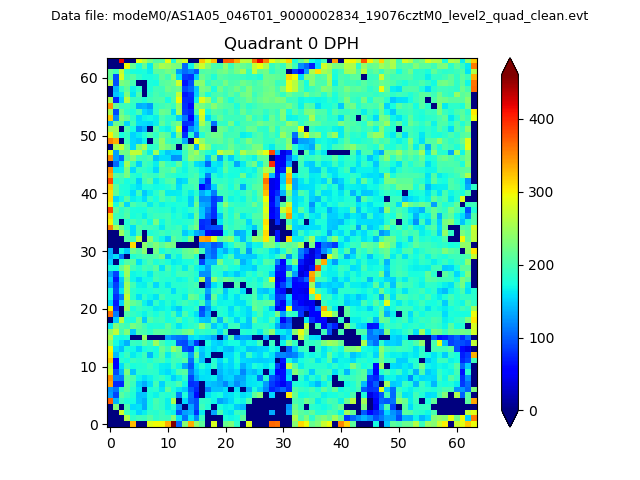 |
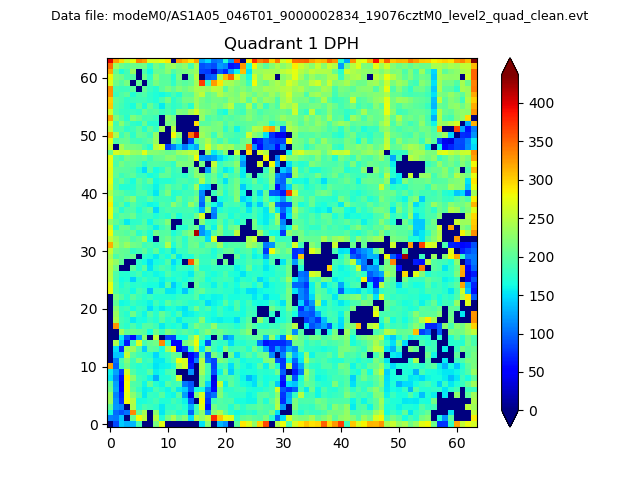 |
Quadrant B |
|---|---|---|---|
| Quadrant D |  |
 |
Quadrant C |
| Plot type | Count rate plots | Images |
|---|---|---|
| Comparison with Poisson distribution Blue bars denote a histogram of data divided into 1 sec bins. Red curve is a Poisson curve with rate = median count rate of data. |
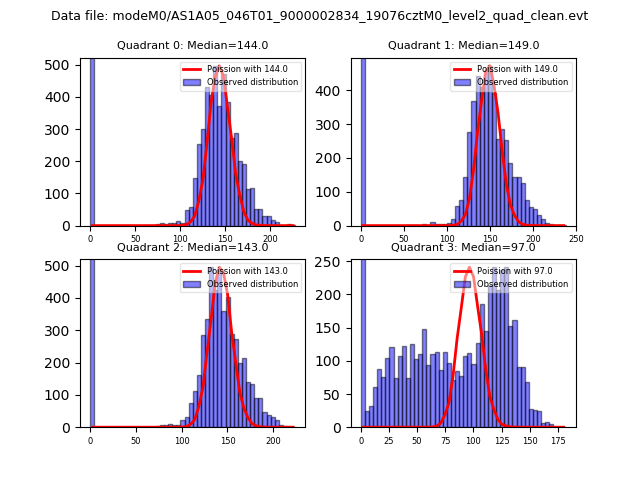 |
 |
| Quadrant-wise count rates Data is divided into 100 sec bins |
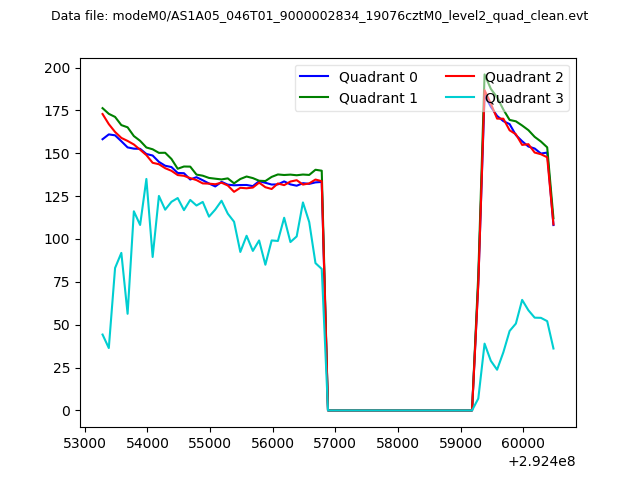 |
|
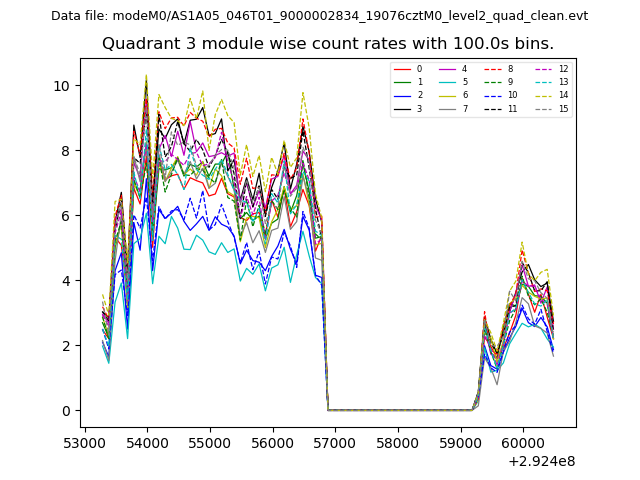
| Module-wise count rates for Quadrant A Data is divided into 100 sec bins |
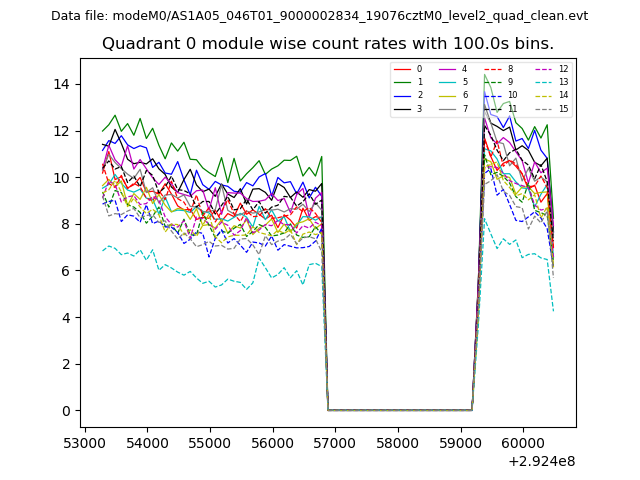 |
 |
| Module-wise count rates for Quadrant B Data is divided into 100 sec bins |
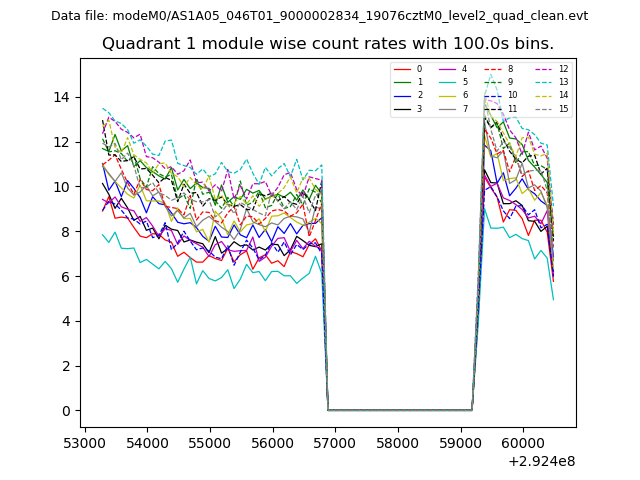 |
 |
| Module-wise count rates for Quadrant C Data is divided into 100 sec bins |
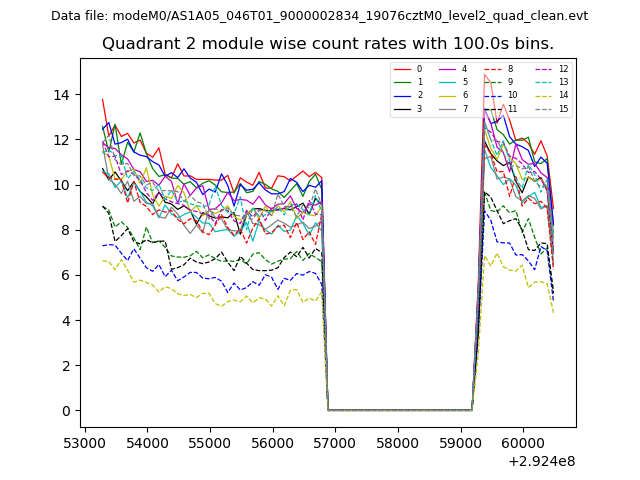 |
 |
| Module-wise count rates for Quadrant D Data is divided into 100 sec bins |
 |
 |
| Parameter | Plot |
|---|---|
| CZT HV Monitor | 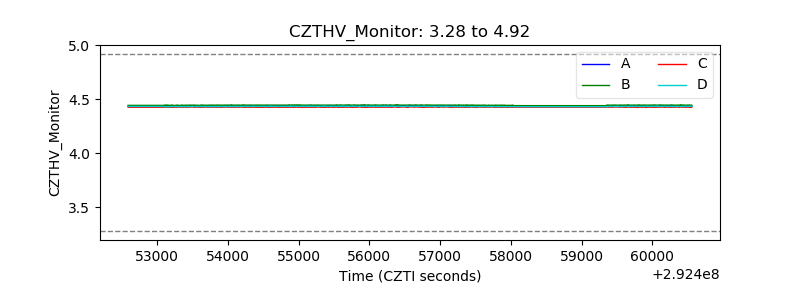 |
| D_VDD | 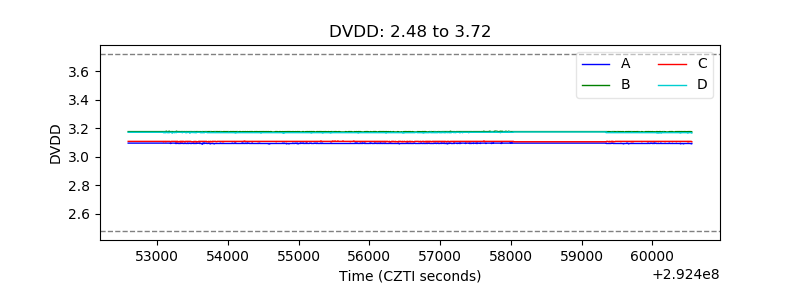 |
| Temperature 1 | 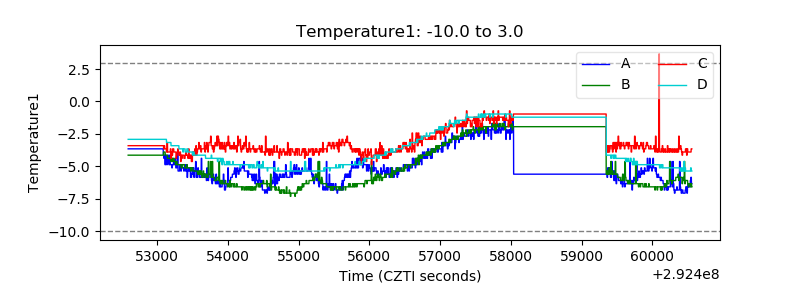 |
| Veto HV Monitor | 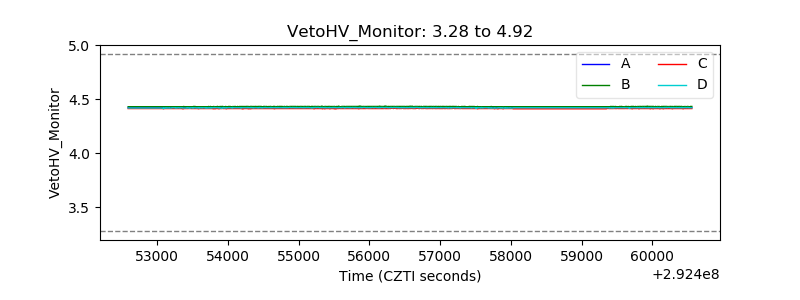 |
| Veto LLD | 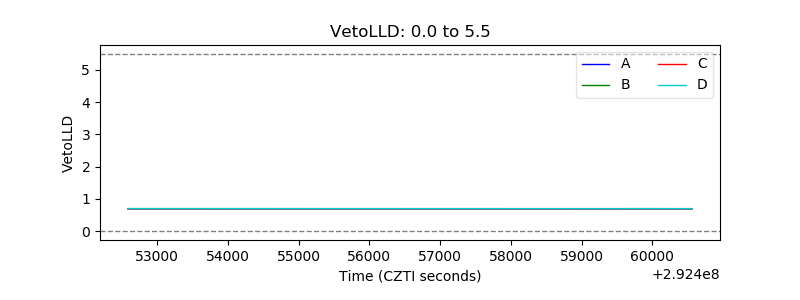 |
| Alpha Counter | 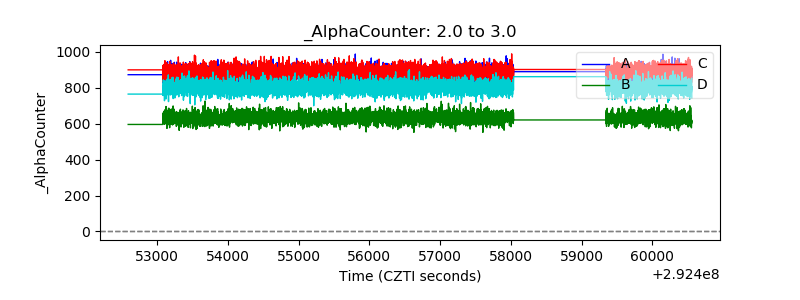 |
| _CPM_Rate | 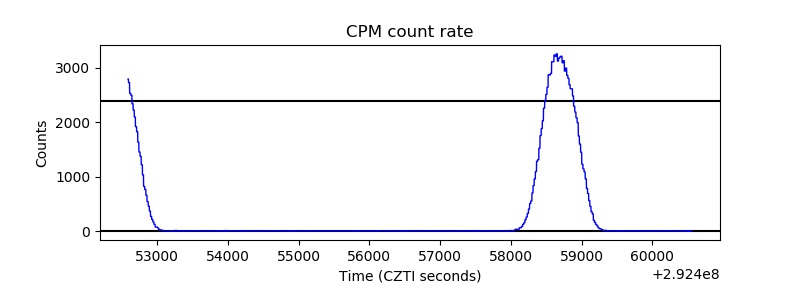 |
| CZT Counter |  |
| +2.5 Volts monitor |  |
| +5 Volts monitor | 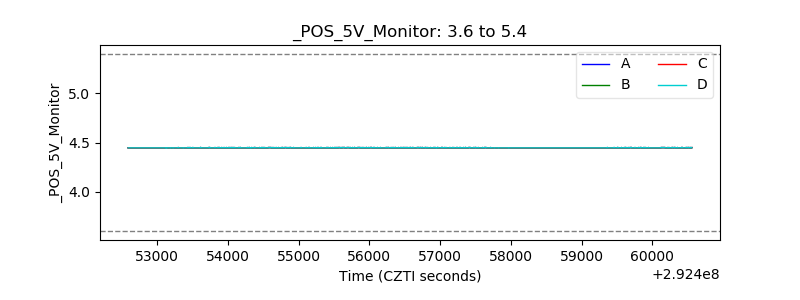 |
| _ROLL_ROT | 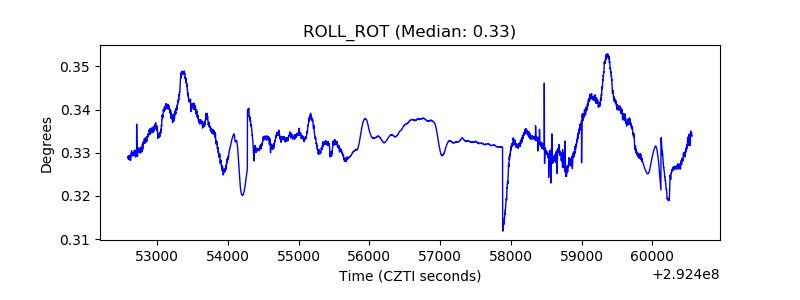 |
| _Roll_DEC | 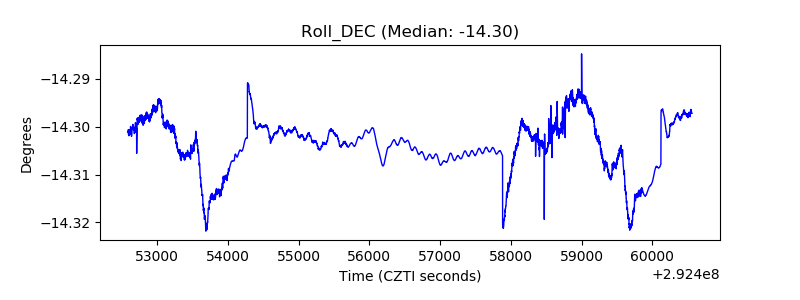 |
| _Roll_RA |  |
| Veto Counter | 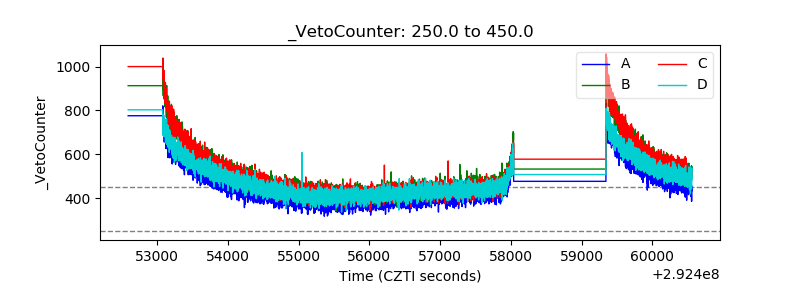 |