| Param | Original file | Final file |
|---|---|---|
| Filename | modeM0/AS1A05_046T01_9000002834_19078cztM0_level2.evt | modeM0/AS1A05_046T01_9000002834_19078cztM0_level2_quad_clean.evt |
| Size (bytes) | 464,852,160 | 103,913,280 |
| Size | 443.3 MB | 99.1 MB |
| Events in quadrant A | 3,273,193 | 674,305 |
| Events in quadrant B | 3,404,471 | 699,353 |
| Events in quadrant C | 3,417,177 | 672,014 |
| Events in quadrant D | 3,538,240 | 644,529 |
| Mode SS | |||
|---|---|---|---|
| Quadrant | BADHDUFLAG | Total packets | Discarded packets |
| A | 0 | 134 | 0 |
| B | 0 | 134 | 0 |
| C | 0 | 134 | 0 |
| D | 0 | 134 | 0 |
| Mode M0 | |||
|---|---|---|---|
| Quadrant | BADHDUFLAG | Total packets | Discarded packets |
| A | 0 | 13744 | 2 |
| B | 0 | 14168 | 2 |
| C | 0 | 14102 | 2 |
| D | 0 | 14753 | 2 |
| Mode M9 | |||
|---|---|---|---|
| Quadrant | BADHDUFLAG | Total packets | Discarded packets |
| A | 0 | 18 | 0 |
| B | 0 | 19 | 0 |
| C | 0 | 19 | 0 |
| D | 0 | 19 | 0 |
| Quadrant | Total seconds | Saturated seconds | Saturation percentage |
|---|---|---|---|
| A | 6554 | 56 | 0.854440% |
| B | 6554 | 72 | 1.098566% |
| C | 6554 | 98 | 1.495270% |
| D | 6554 | 94 | 1.434239% |
Noise dominated data is calculated using 1-second bins in cleaned event files. If a bin has >2000 counts, and if more than 50% of those come from <1% of pixels, then it is considered to be noise-dominated and hence unusable.
| Quadrant | # 1 sec bins | Bins with >0 counts | Bins with >2000 counts | High rate bins dominated by noise | Noise dominated (total time) | Noise dominated (detector-on time) | Marked lightcurve |
|---|---|---|---|---|---|---|---|
| A | 7889 | 6556 | 3 | 3 | 0.04% | 0.05% | 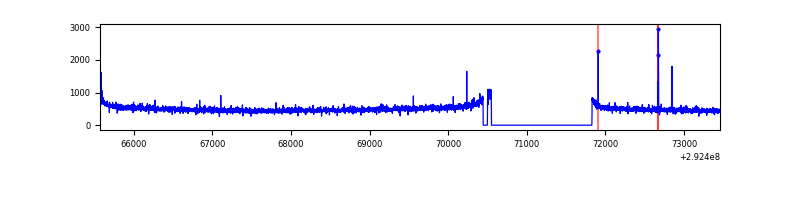 |
| B | 7889 | 6556 | 1 | 1 | 0.01% | 0.02% | 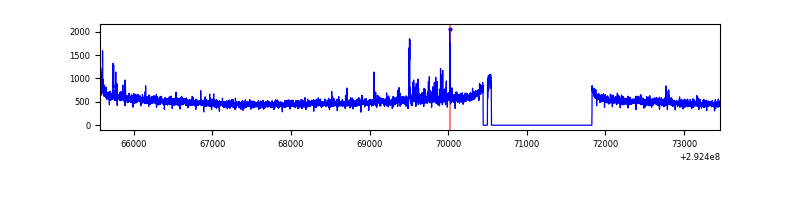 |
| C | 7889 | 6556 | 8 | 8 | 0.10% | 0.12% | 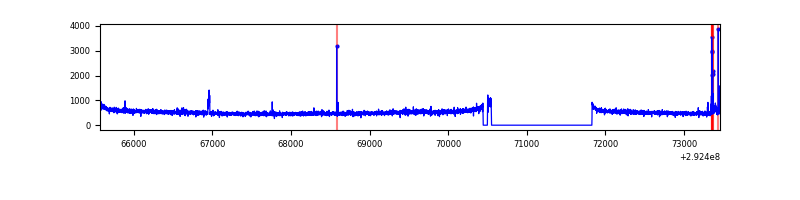 |
| D | 7889 | 6556 | 49 | 49 | 0.62% | 0.75% | 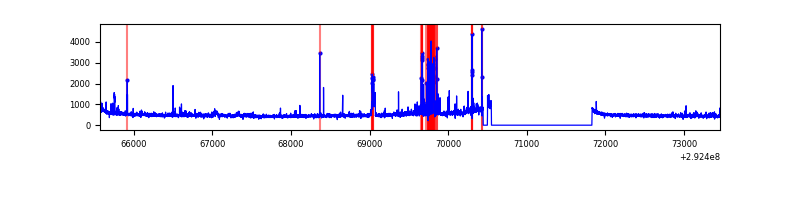 |
Top three noisy pixels from each quadrant. If the there are fewer than three noisy pixels in the level2.evt file, extra rows are filled as -1
| Pixel properties | Quadrant properties | ||||||
|---|---|---|---|---|---|---|---|
| Quadrant | DetID | PixID | Counts | Sigma | Mean | Median | Sigma |
| A | 9 | 143 | 30411 | 175.58 | 842 | 827 | 168.5 |
| A | 13 | 254 | 8535 | 45.75 | 842 | 827 | 168.5 |
| A | 0 | 226 | 7278 | 38.29 | 842 | 827 | 168.5 |
| B | 7 | 220 | 49908 | 308.76 | 849 | 832 | 158.9 |
| B | 0 | 189 | 22864 | 138.61 | 849 | 832 | 158.9 |
| B | 12 | 111 | 18734 | 112.63 | 849 | 832 | 158.9 |
| C | 14 | 238 | 128502 | 660.36 | 824 | 832 | 193.3 |
| C | 0 | 207 | 30901 | 155.53 | 824 | 832 | 193.3 |
| C | 3 | 233 | 24580 | 122.83 | 824 | 832 | 193.3 |
| D | 11 | 176 | 234990 | 1169.8 | 823 | 800 | 200.2 |
| D | 1 | 52 | 145516 | 722.87 | 823 | 800 | 200.2 |
| D | 7 | 238 | 50361 | 247.56 | 823 | 800 | 200.2 |
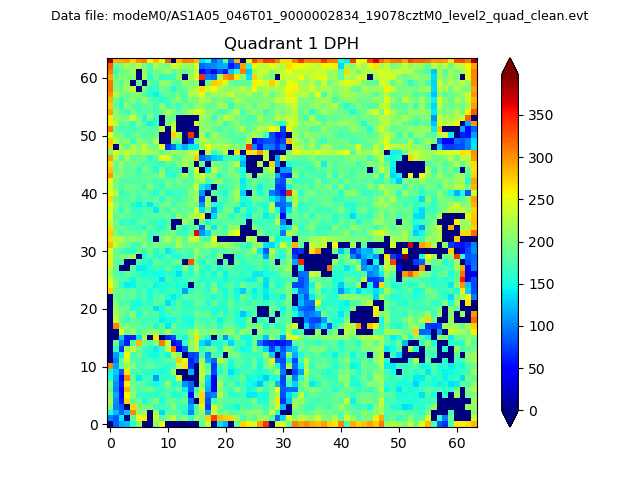
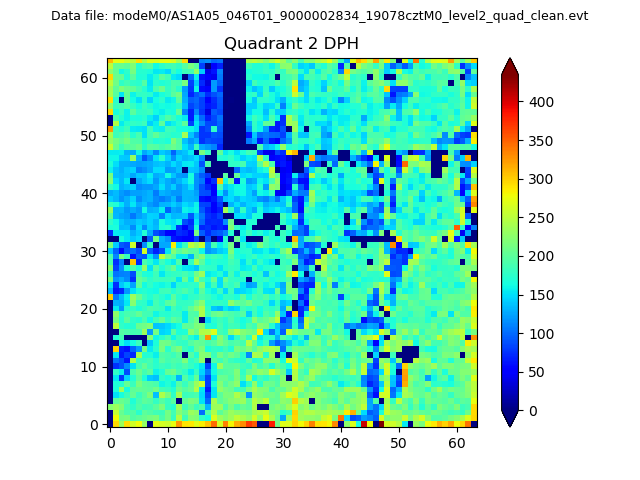
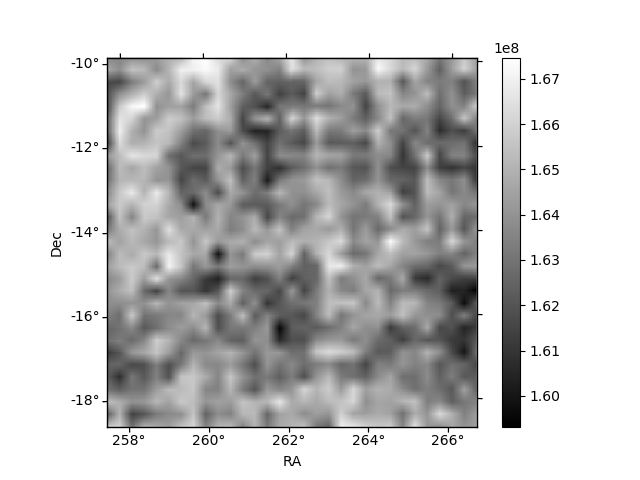
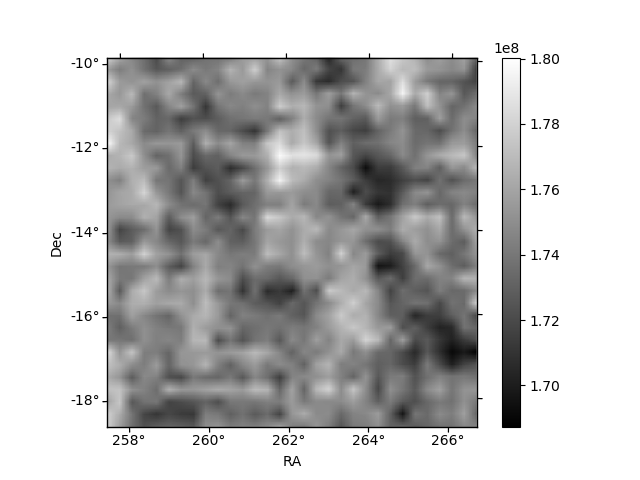
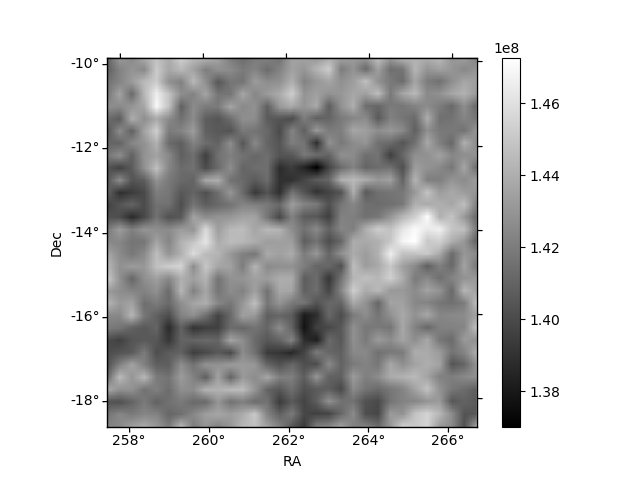
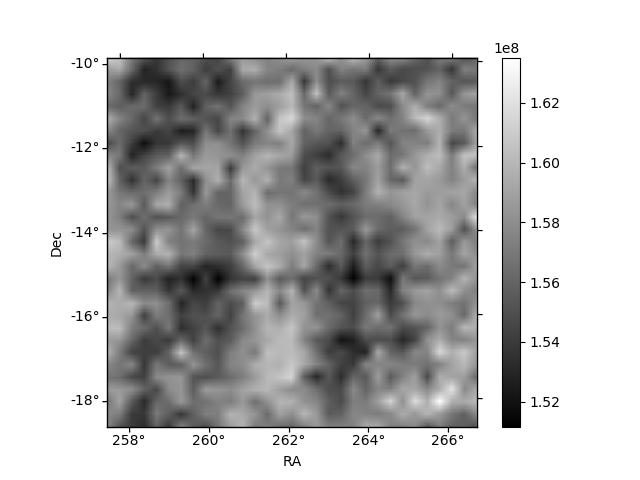
Histogram calculated using DETX and DETY for each event in the final _common_clean file
| Quadrant A |  |
 |
Quadrant B |
|---|---|---|---|
| Quadrant D | 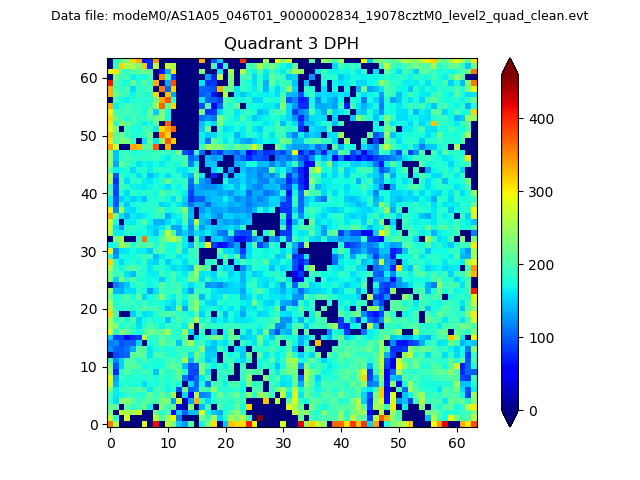 |
 |
Quadrant C |
| Plot type | Count rate plots | Images |
|---|---|---|
| Comparison with Poisson distribution Blue bars denote a histogram of data divided into 1 sec bins. Red curve is a Poisson curve with rate = median count rate of data. |
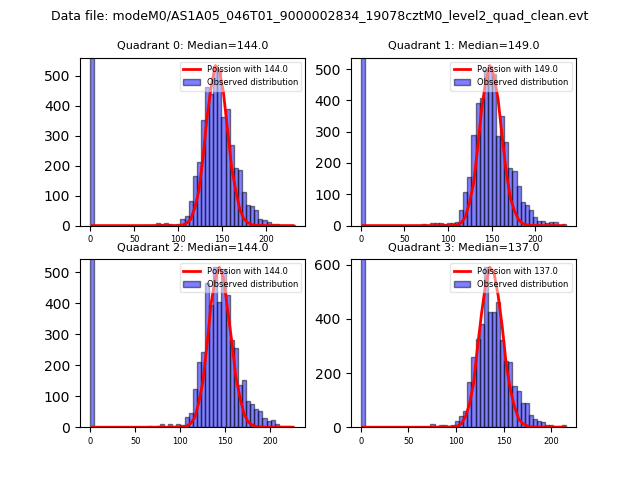 |
 |
| Quadrant-wise count rates Data is divided into 100 sec bins |
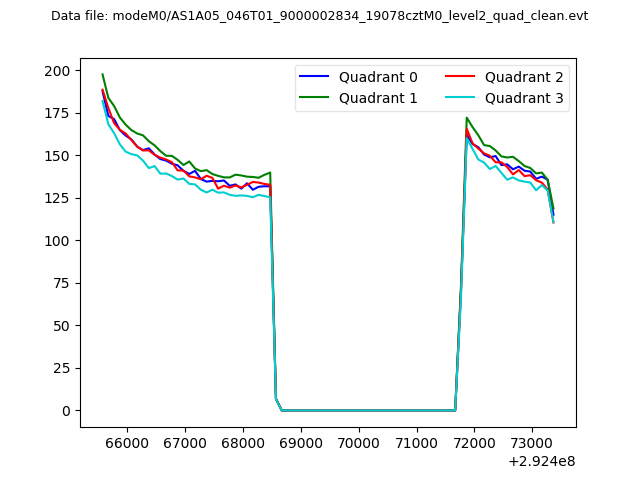 |
|
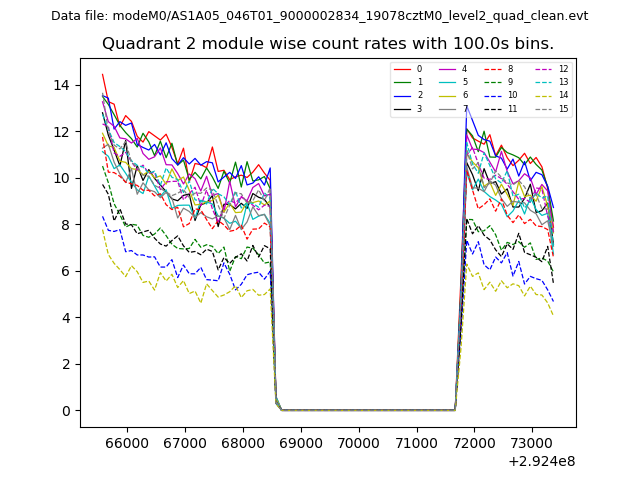
| Module-wise count rates for Quadrant A Data is divided into 100 sec bins |
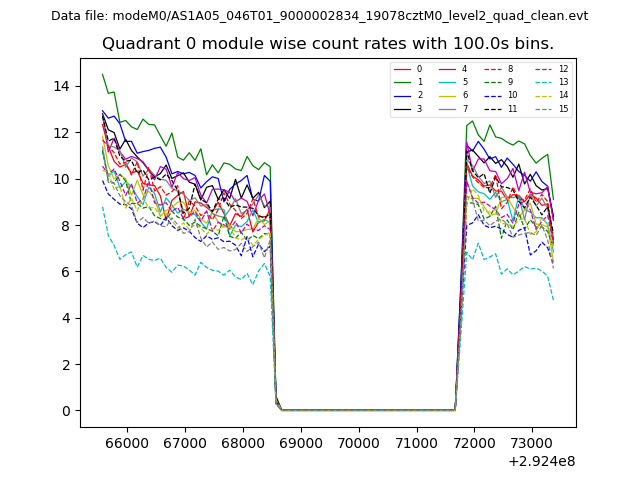 |
 |
| Module-wise count rates for Quadrant B Data is divided into 100 sec bins |
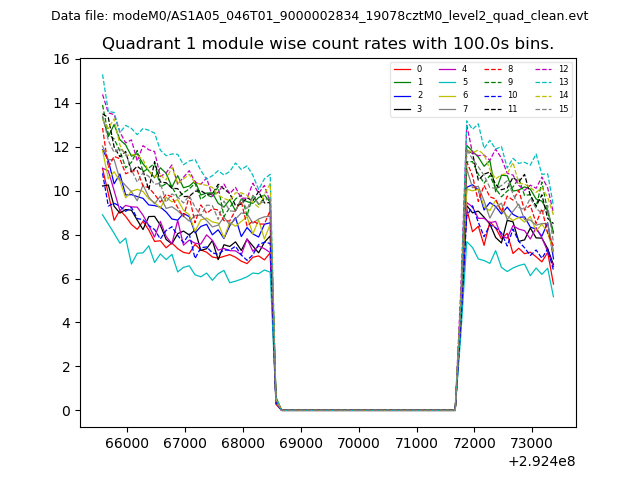 |
 |
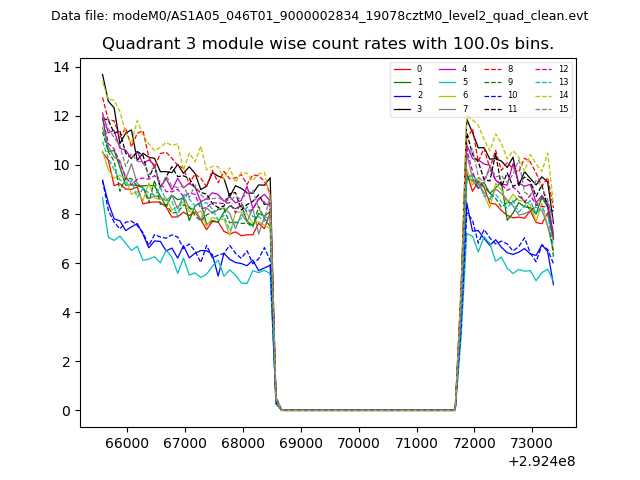
| Module-wise count rates for Quadrant C Data is divided into 100 sec bins |
 |
 |
| Module-wise count rates for Quadrant D Data is divided into 100 sec bins |
 |
 |
| Parameter | Plot |
|---|---|
| CZT HV Monitor | 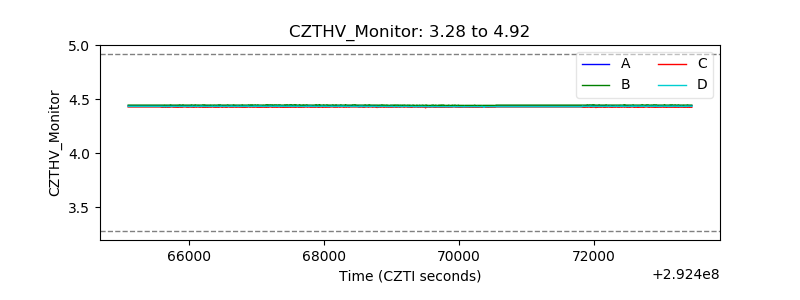 |
| D_VDD | 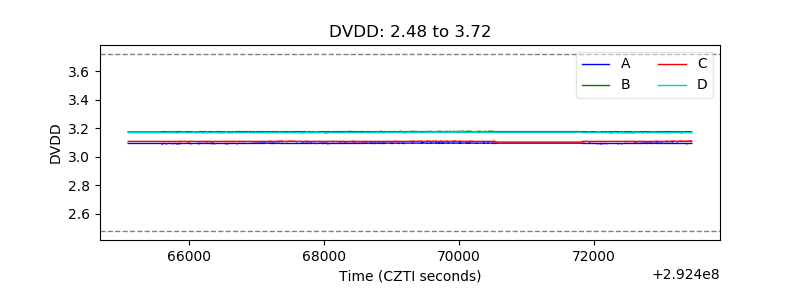 |
| Temperature 1 | 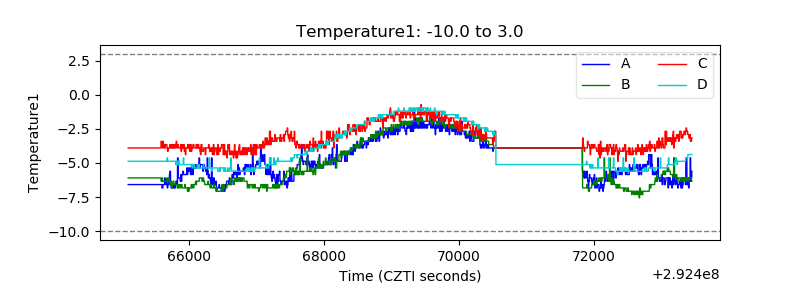 |
| Veto HV Monitor | 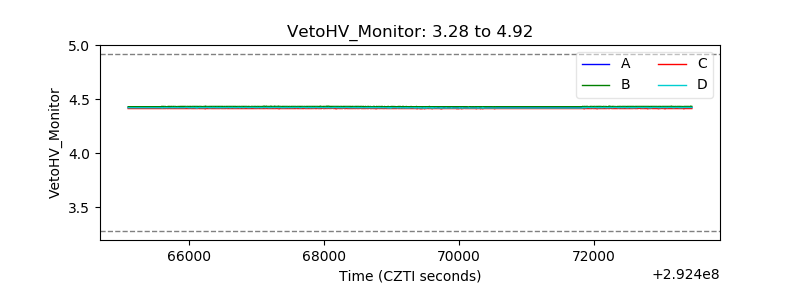 |
| Veto LLD |  |
| Alpha Counter | 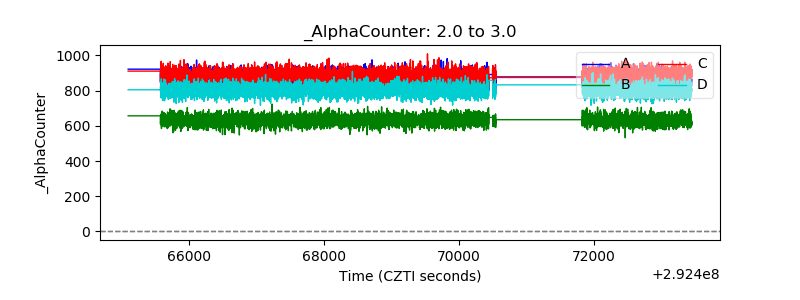 |
| _CPM_Rate | 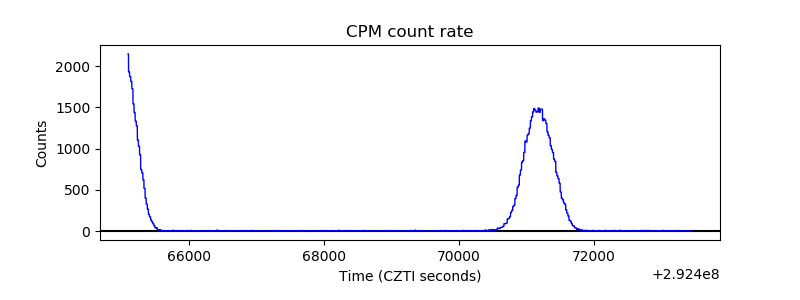 |
| CZT Counter | 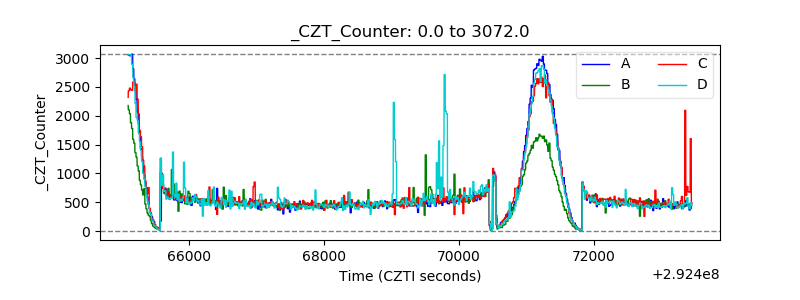 |
| +2.5 Volts monitor |  |
| +5 Volts monitor | 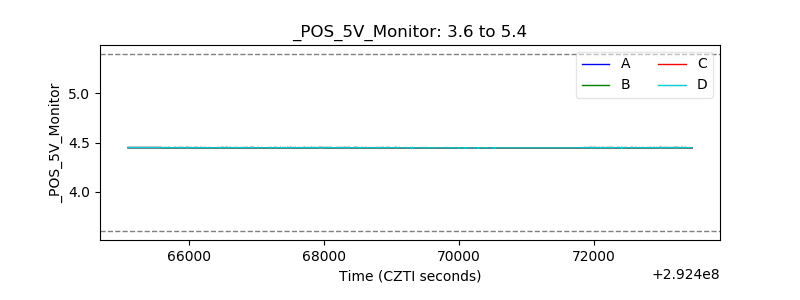 |
| _ROLL_ROT | 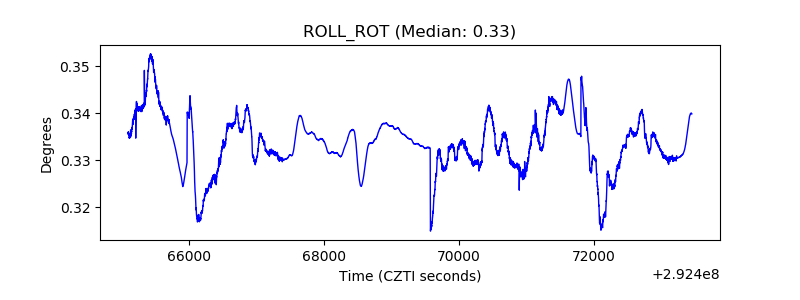 |
| _Roll_DEC | 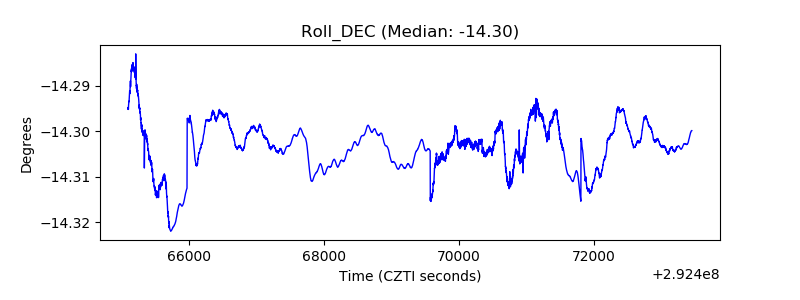 |
| _Roll_RA | 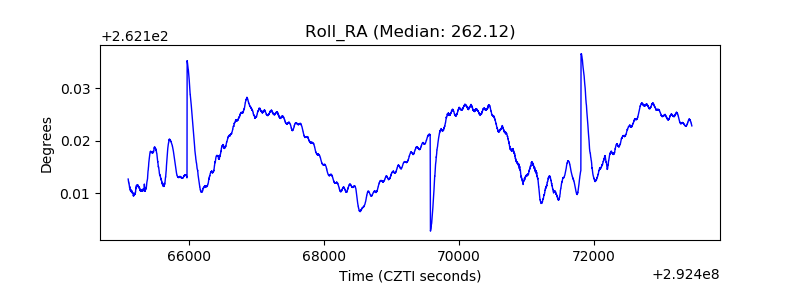 |
| Veto Counter | 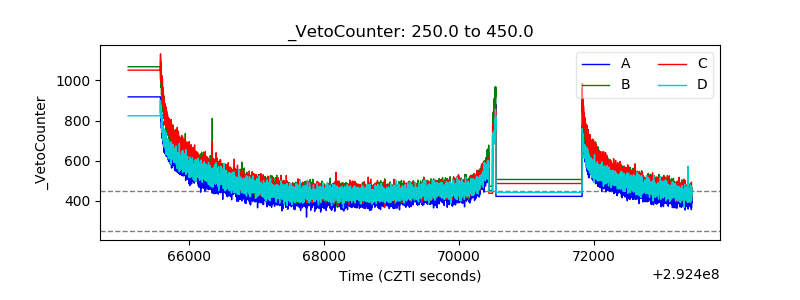 |