| Param | Original file | Final file |
|---|---|---|
| Filename | modeM0/AS1A05_046T01_9000002834_19080cztM0_level2.evt | modeM0/AS1A05_046T01_9000002834_19080cztM0_level2_quad_clean.evt |
| Size (bytes) | 497,586,240 | 102,119,040 |
| Size | 474.5 MB | 97.4 MB |
| Events in quadrant A | 3,416,914 | 652,171 |
| Events in quadrant B | 3,733,921 | 668,938 |
| Events in quadrant C | 3,659,544 | 647,162 |
| Events in quadrant D | 3,770,026 | 623,171 |
| Mode SS | |||
|---|---|---|---|
| Quadrant | BADHDUFLAG | Total packets | Discarded packets |
| A | 0 | 146 | 0 |
| B | 0 | 146 | 0 |
| C | 0 | 146 | 0 |
| D | 0 | 146 | 0 |
| Mode M0 | |||
|---|---|---|---|
| Quadrant | BADHDUFLAG | Total packets | Discarded packets |
| A | 0 | 14783 | 2 |
| B | 0 | 15639 | 2 |
| C | 0 | 15300 | 2 |
| D | 0 | 15951 | 2 |
| Mode M9 | |||
|---|---|---|---|
| Quadrant | BADHDUFLAG | Total packets | Discarded packets |
| A | 0 | 13 | 0 |
| B | 0 | 14 | 0 |
| C | 0 | 14 | 0 |
| D | 0 | 14 | 0 |
| Quadrant | Total seconds | Saturated seconds | Saturation percentage |
|---|---|---|---|
| A | 7200 | 39 | 0.541667% |
| B | 7200 | 85 | 1.180556% |
| C | 7200 | 83 | 1.152778% |
| D | 7200 | 124 | 1.722222% |
Noise dominated data is calculated using 1-second bins in cleaned event files. If a bin has >2000 counts, and if more than 50% of those come from <1% of pixels, then it is considered to be noise-dominated and hence unusable.
| Quadrant | # 1 sec bins | Bins with >0 counts | Bins with >2000 counts | High rate bins dominated by noise | Noise dominated (total time) | Noise dominated (detector-on time) | Marked lightcurve |
|---|---|---|---|---|---|---|---|
| A | 8005 | 7201 | 0 | 0 | 0.00% | 0.00% | 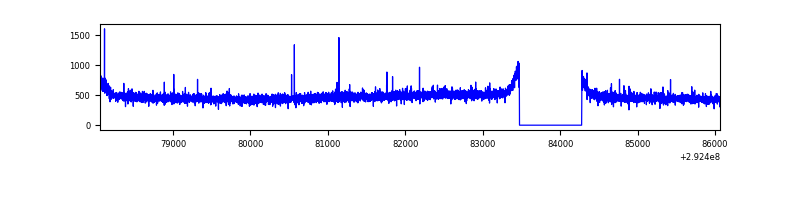 |
| B | 8005 | 7201 | 21 | 21 | 0.26% | 0.29% | 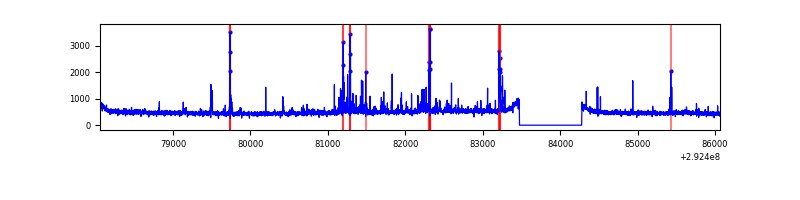 |
| C | 8005 | 7201 | 4 | 4 | 0.05% | 0.06% | 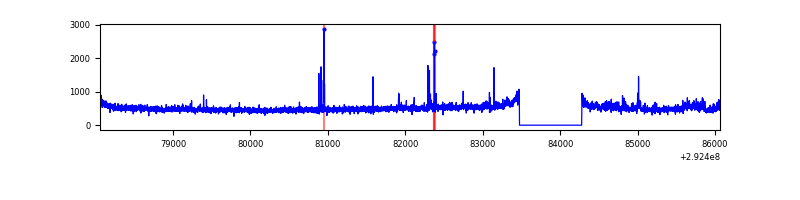 |
| D | 8005 | 7201 | 58 | 58 | 0.72% | 0.81% | 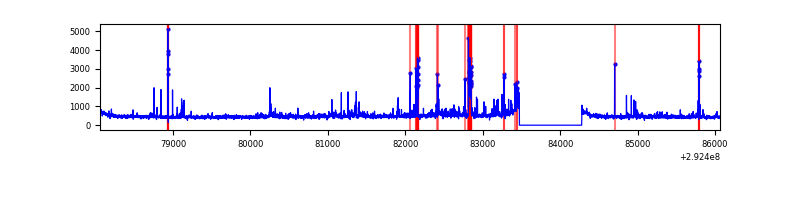 |
Top three noisy pixels from each quadrant. If the there are fewer than three noisy pixels in the level2.evt file, extra rows are filled as -1
| Pixel properties | Quadrant properties | ||||||
|---|---|---|---|---|---|---|---|
| Quadrant | DetID | PixID | Counts | Sigma | Mean | Median | Sigma |
| A | 15 | 174 | 14508 | 76.01 | 882 | 864 | 179.5 |
| A | 13 | 254 | 8416 | 42.07 | 882 | 864 | 179.5 |
| A | 0 | 226 | 7608 | 37.57 | 882 | 864 | 179.5 |
| B | 3 | 112 | 116524 | 688.44 | 880 | 859 | 168.0 |
| B | 7 | 220 | 106470 | 628.6 | 880 | 859 | 168.0 |
| B | 0 | 197 | 24977 | 143.55 | 880 | 859 | 168.0 |
| C | 3 | 233 | 143037 | 706.44 | 856 | 862 | 201.3 |
| C | 14 | 238 | 132277 | 652.98 | 856 | 862 | 201.3 |
| C | 0 | 207 | 44167 | 215.18 | 856 | 862 | 201.3 |
| D | 1 | 52 | 293349 | 1387.71 | 862 | 836 | 210.8 |
| D | 7 | 238 | 114116 | 537.41 | 862 | 836 | 210.8 |
| D | 11 | 176 | 101061 | 475.48 | 862 | 836 | 210.8 |
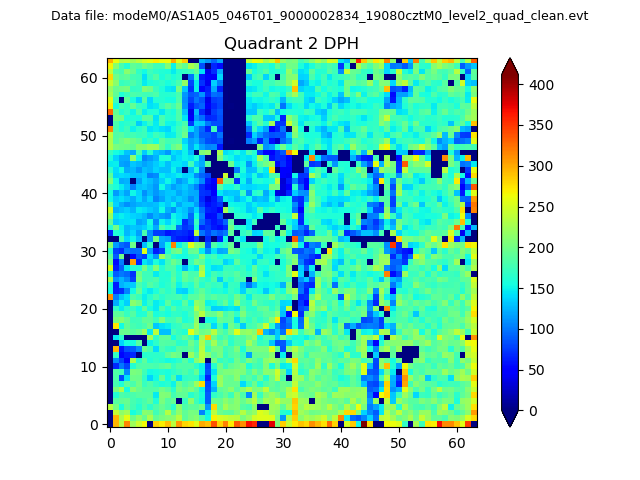
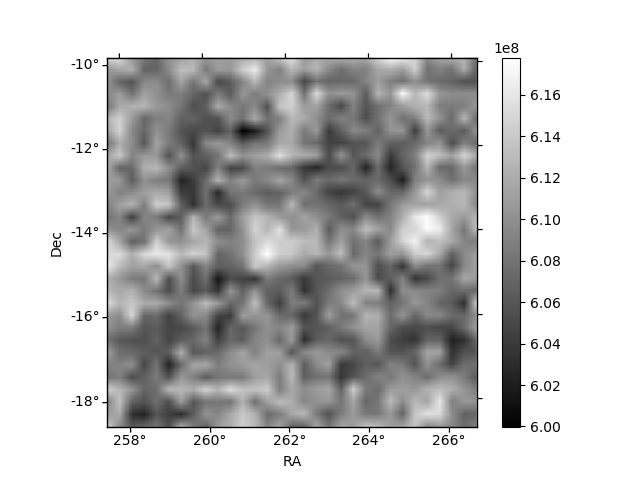
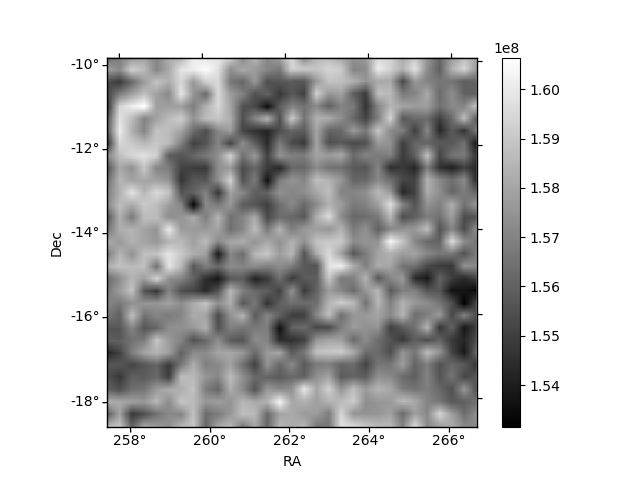
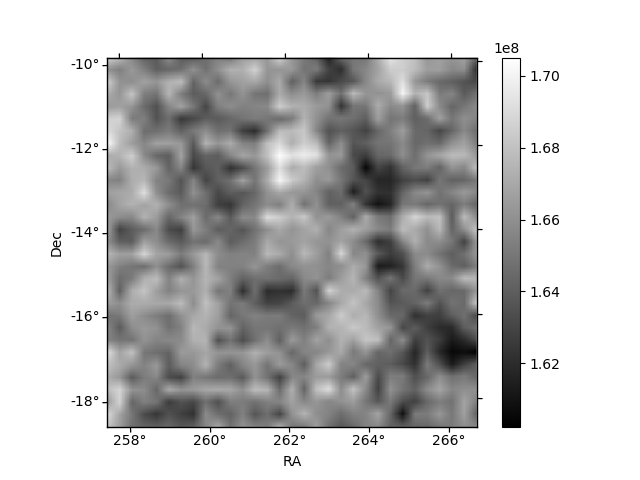
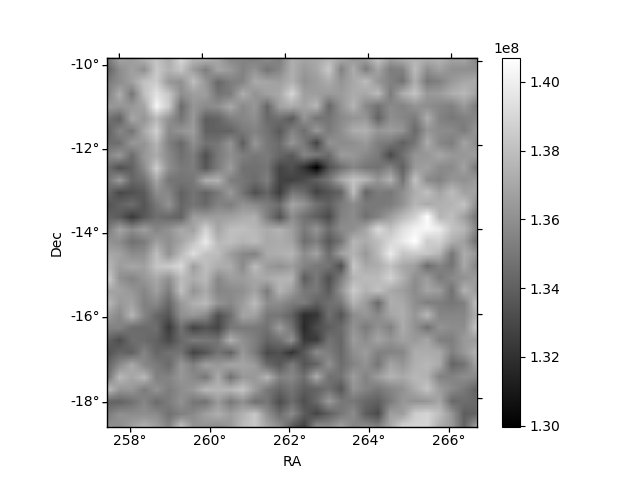
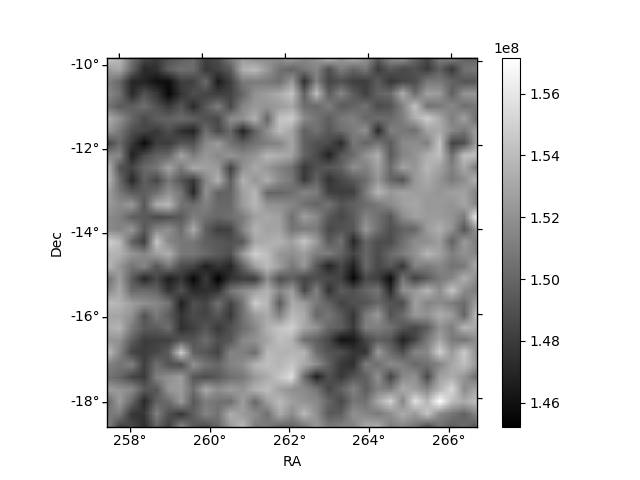
Histogram calculated using DETX and DETY for each event in the final _common_clean file
| Quadrant A | 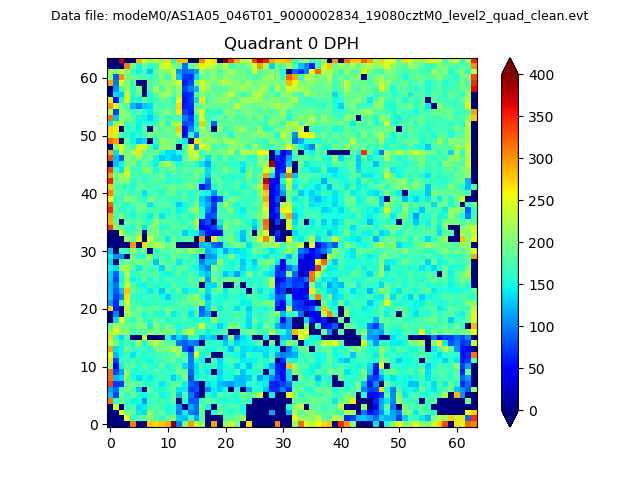 |
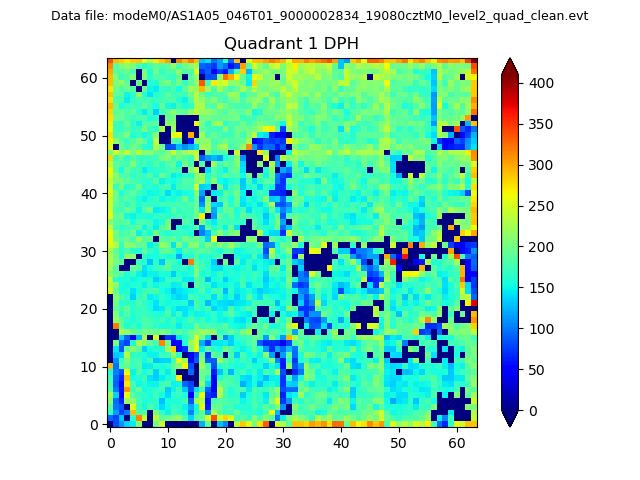 |
Quadrant B |
|---|---|---|---|
| Quadrant D | 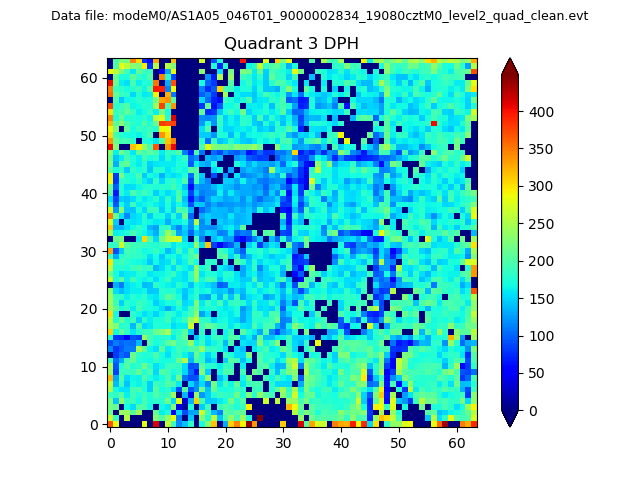 |
 |
Quadrant C |
| Plot type | Count rate plots | Images |
|---|---|---|
| Comparison with Poisson distribution Blue bars denote a histogram of data divided into 1 sec bins. Red curve is a Poisson curve with rate = median count rate of data. |
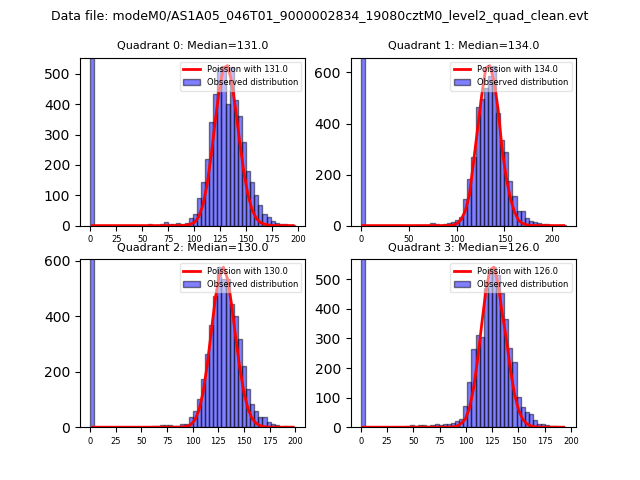 |
 |
| Quadrant-wise count rates Data is divided into 100 sec bins |
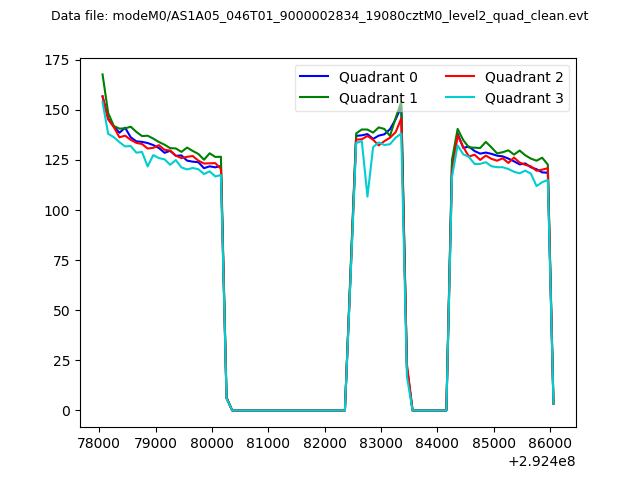 |
|
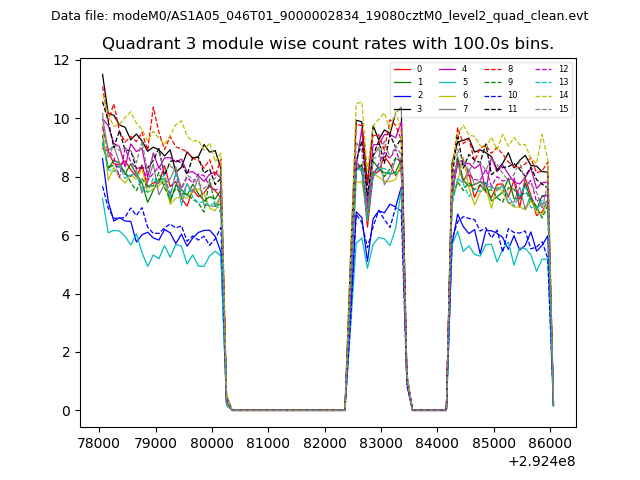
| Module-wise count rates for Quadrant A Data is divided into 100 sec bins |
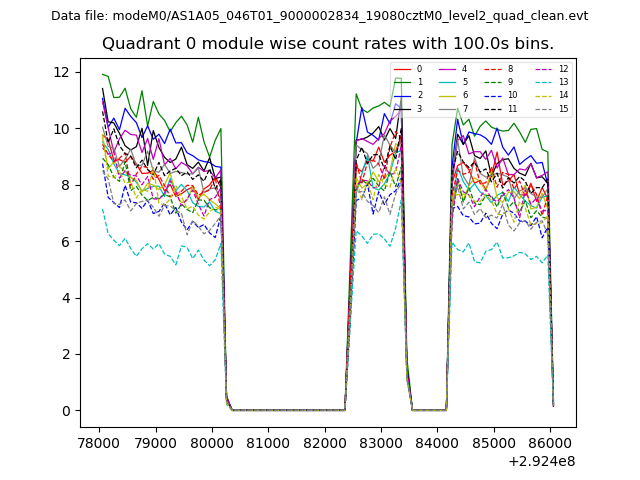 |
 |
| Module-wise count rates for Quadrant B Data is divided into 100 sec bins |
 |
 |
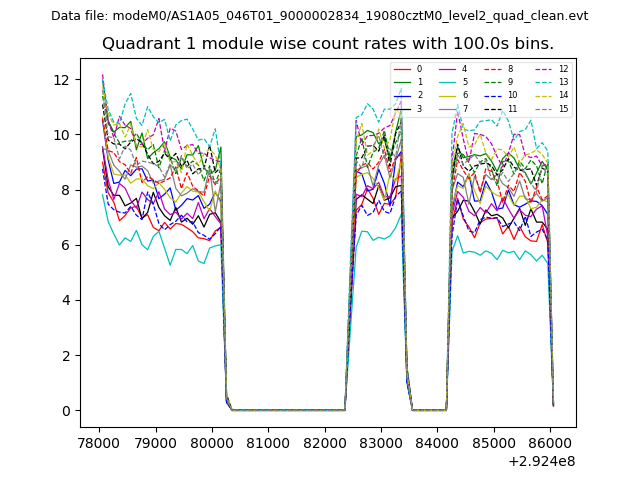
| Module-wise count rates for Quadrant C Data is divided into 100 sec bins |
 |
 |
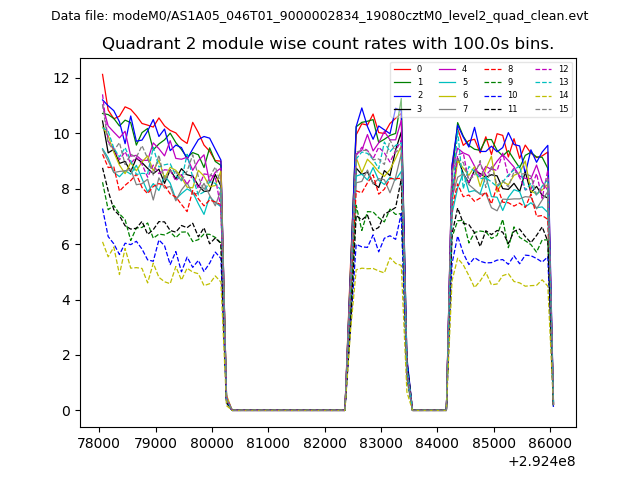
| Module-wise count rates for Quadrant D Data is divided into 100 sec bins |
 |
 |
| Parameter | Plot |
|---|---|
| CZT HV Monitor | 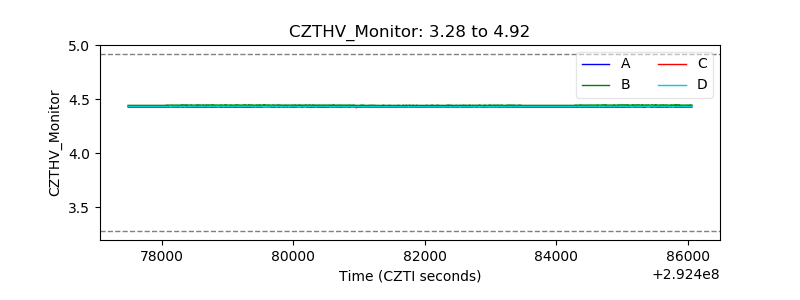 |
| D_VDD | 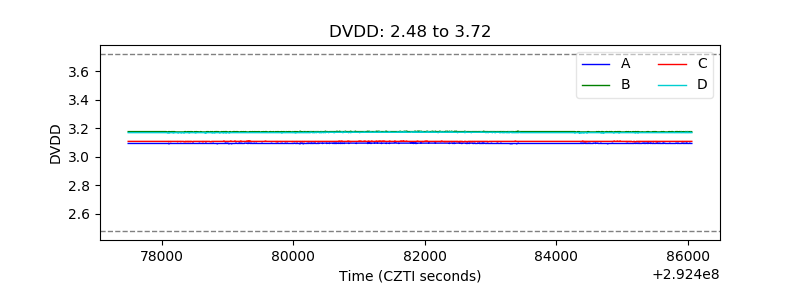 |
| Temperature 1 | 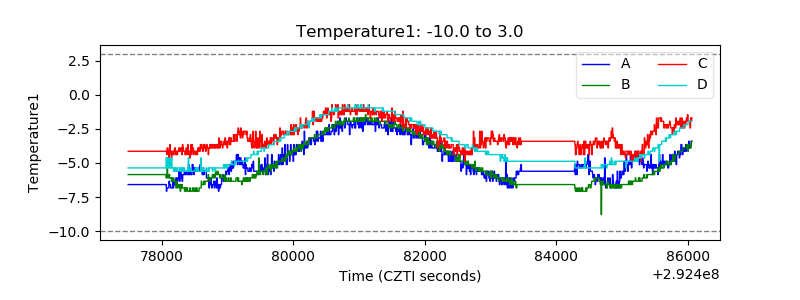 |
| Veto HV Monitor | 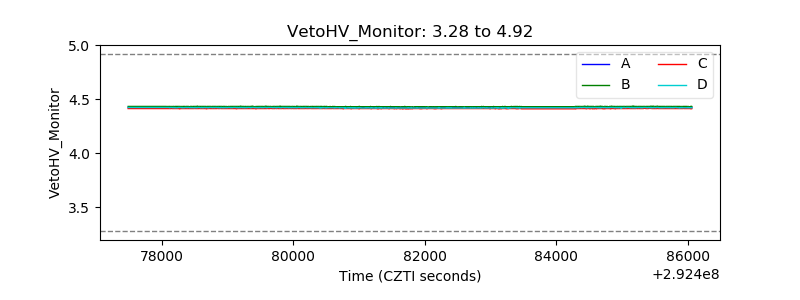 |
| Veto LLD | 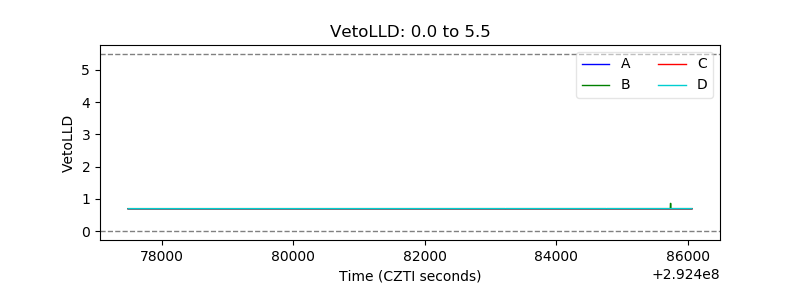 |
| Alpha Counter | 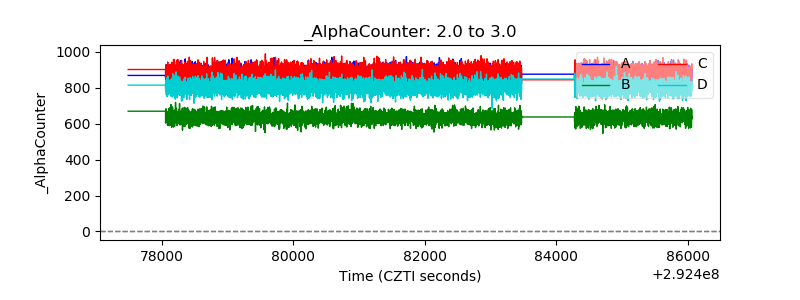 |
| _CPM_Rate | 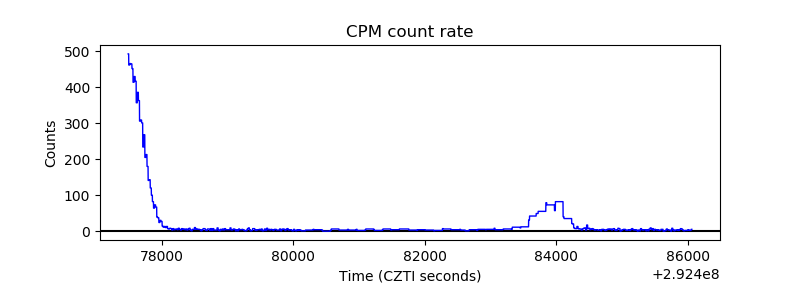 |
| CZT Counter | 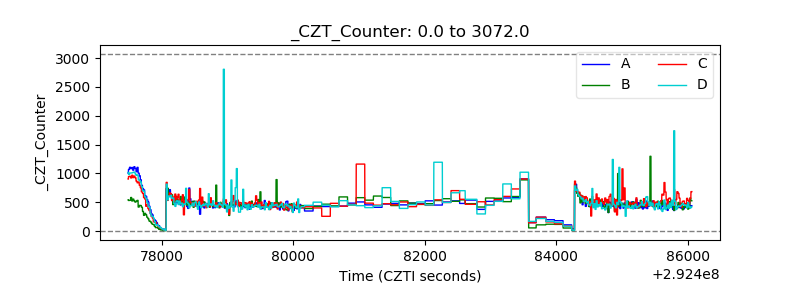 |
| +2.5 Volts monitor |  |
| +5 Volts monitor |  |
| _ROLL_ROT | 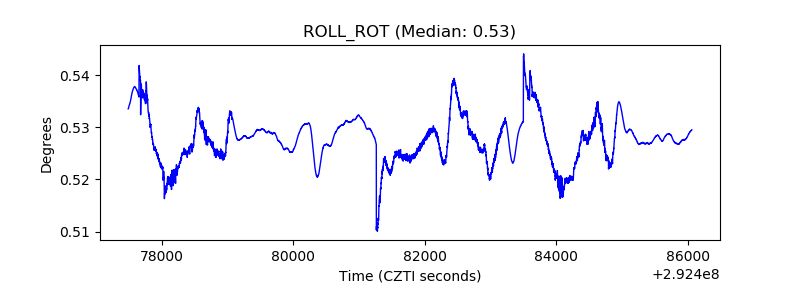 |
| _Roll_DEC | 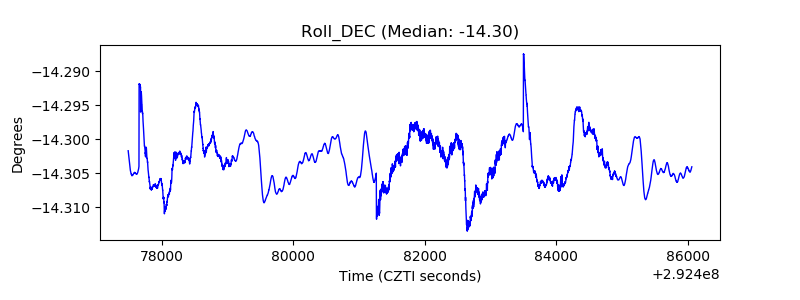 |
| _Roll_RA | 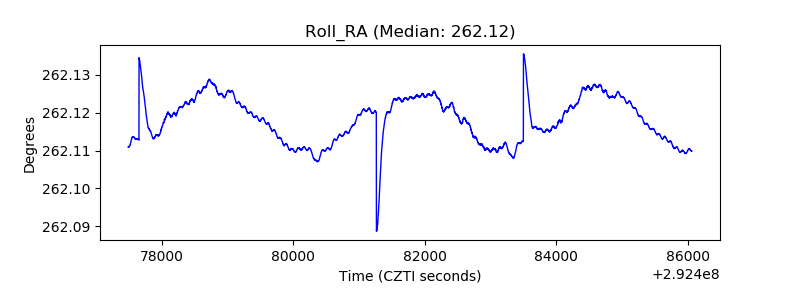 |
| Veto Counter | 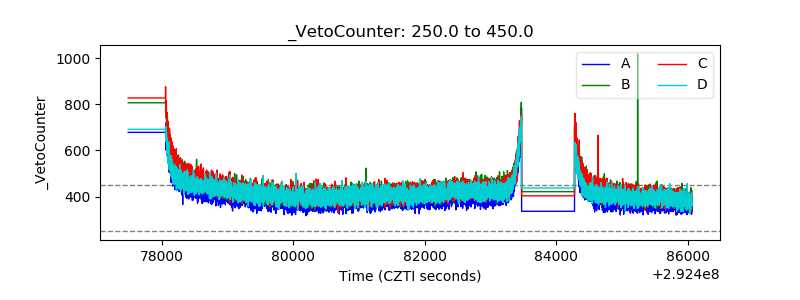 |