| Param | Original file | Final file |
|---|---|---|
| Filename | modeM0/AS1A05_046T01_9000002834_19085cztM0_level2.evt | modeM0/AS1A05_046T01_9000002834_19085cztM0_level2_quad_clean.evt |
| Size (bytes) | 917,706,240 | 143,389,440 |
| Size | 875.2 MB | 136.7 MB |
| Events in quadrant A | 6,098,271 | 867,996 |
| Events in quadrant B | 7,246,812 | 883,013 |
| Events in quadrant C | 6,587,516 | 857,061 |
| Events in quadrant D | 6,981,489 | 837,094 |
| Mode SS | |||
|---|---|---|---|
| Quadrant | BADHDUFLAG | Total packets | Discarded packets |
| A | 0 | 264 | 0 |
| B | 0 | 264 | 0 |
| C | 0 | 264 | 0 |
| D | 0 | 264 | 0 |
| Mode M0 | |||
|---|---|---|---|
| Quadrant | BADHDUFLAG | Total packets | Discarded packets |
| A | 0 | 26652 | 3 |
| B | 0 | 29339 | 3 |
| C | 0 | 27632 | 3 |
| D | 0 | 29469 | 3 |
| Mode M9 | |||
|---|---|---|---|
| Quadrant | BADHDUFLAG | Total packets | Discarded packets |
| A | 0 | 12 | 0 |
| B | 0 | 13 | 0 |
| C | 0 | 13 | 0 |
| D | 0 | 13 | 0 |
| Quadrant | Total seconds | Saturated seconds | Saturation percentage |
|---|---|---|---|
| A | 12981 | 154 | 1.186349% |
| B | 12981 | 250 | 1.925892% |
| C | 12981 | 252 | 1.941299% |
| D | 12980 | 270 | 2.080123% |
Noise dominated data is calculated using 1-second bins in cleaned event files. If a bin has >2000 counts, and if more than 50% of those come from <1% of pixels, then it is considered to be noise-dominated and hence unusable.
| Quadrant | # 1 sec bins | Bins with >0 counts | Bins with >2000 counts | High rate bins dominated by noise | Noise dominated (total time) | Noise dominated (detector-on time) | Marked lightcurve |
|---|---|---|---|---|---|---|---|
| A | 14201 | 12981 | 1 | 1 | 0.01% | 0.01% | 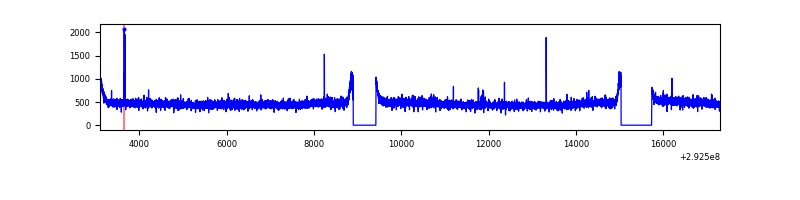 |
| B | 14201 | 12982 | 50 | 50 | 0.35% | 0.39% | 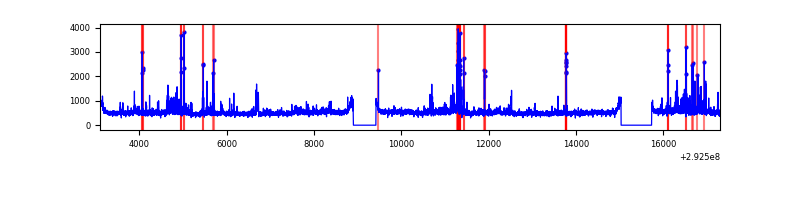 |
| C | 14201 | 12983 | 37 | 37 | 0.26% | 0.28% | 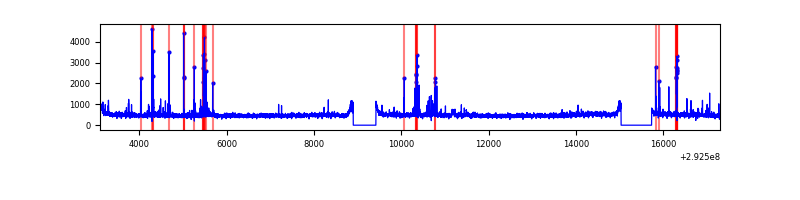 |
| D | 14200 | 12982 | 111 | 111 | 0.78% | 0.86% | 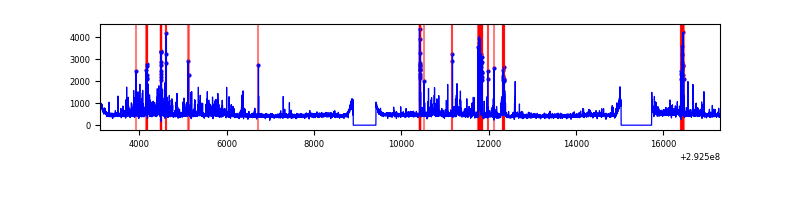 |
Top three noisy pixels from each quadrant. If the there are fewer than three noisy pixels in the level2.evt file, extra rows are filled as -1
| Pixel properties | Quadrant properties | ||||||
|---|---|---|---|---|---|---|---|
| Quadrant | DetID | PixID | Counts | Sigma | Mean | Median | Sigma |
| A | 9 | 143 | 21252 | 61.7 | 1576 | 1540 | 319.5 |
| A | 13 | 254 | 16866 | 47.97 | 1576 | 1540 | 319.5 |
| A | 0 | 226 | 13548 | 37.58 | 1576 | 1540 | 319.5 |
| B | 10 | 245 | 365640 | 1195.69 | 1568 | 1523 | 304.5 |
| B | 3 | 112 | 242972 | 792.87 | 1568 | 1523 | 304.5 |
| B | 7 | 220 | 205648 | 670.31 | 1568 | 1523 | 304.5 |
| C | 0 | 207 | 305245 | 849.72 | 1515 | 1526 | 357.4 |
| C | 14 | 238 | 231220 | 642.62 | 1515 | 1526 | 357.4 |
| C | 3 | 233 | 145122 | 401.74 | 1515 | 1526 | 357.4 |
| D | 7 | 238 | 549492 | 1457.71 | 1535 | 1490 | 375.9 |
| D | 11 | 176 | 333706 | 883.71 | 1535 | 1490 | 375.9 |
| D | 1 | 52 | 244740 | 647.05 | 1535 | 1490 | 375.9 |
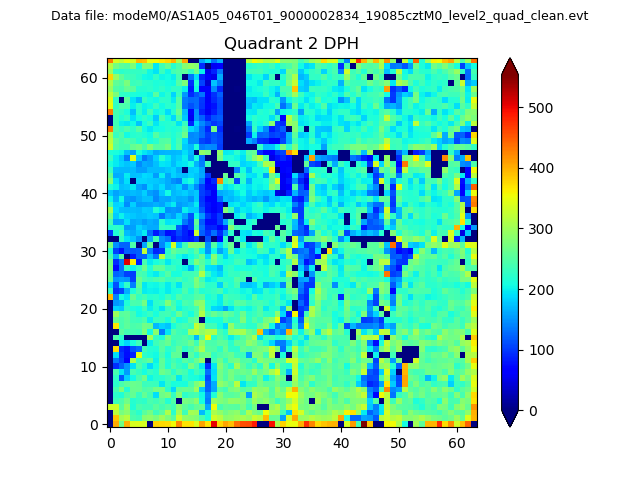
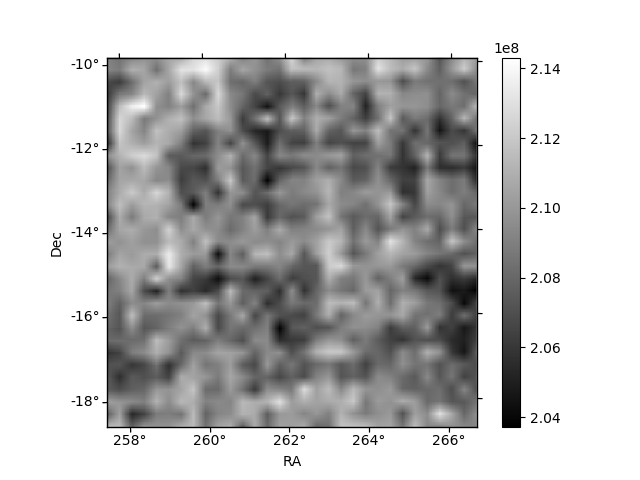
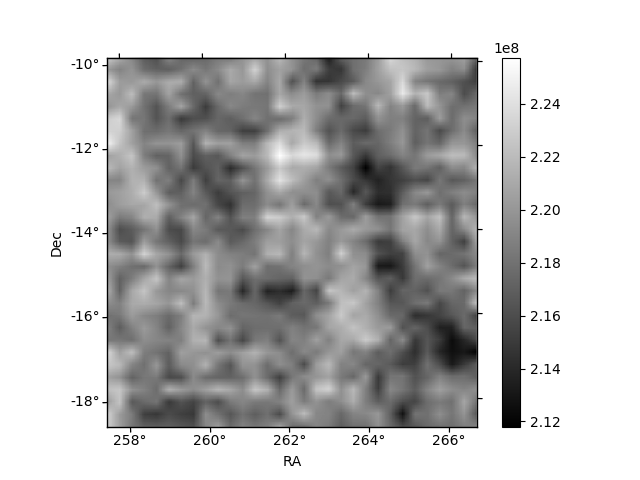
Histogram calculated using DETX and DETY for each event in the final _common_clean file
| Quadrant A |  |
 |
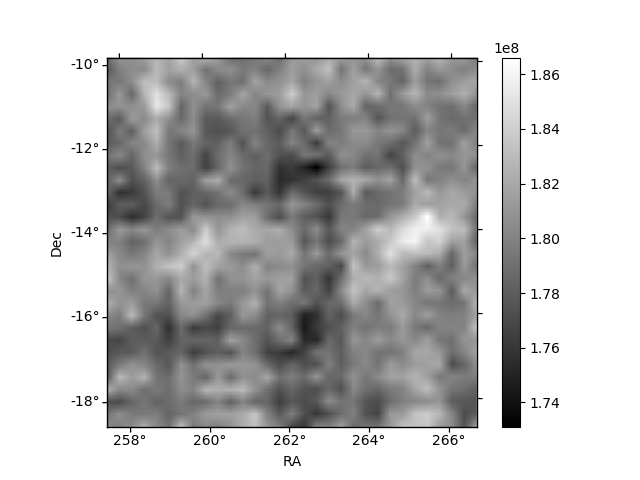
Quadrant B |
|---|---|---|---|
| Quadrant D | 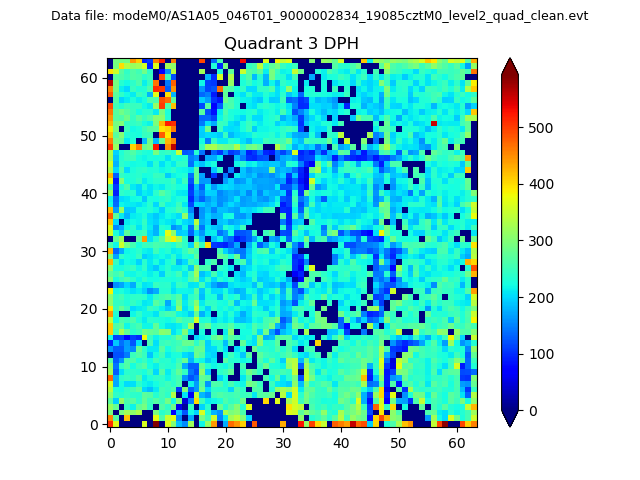 |
 |
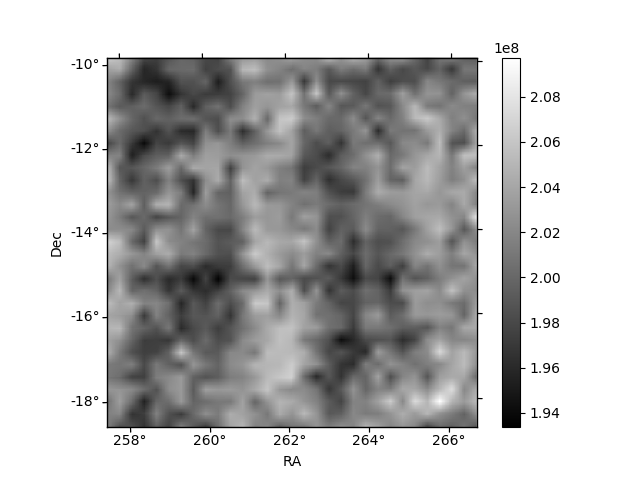
Quadrant C |
| Plot type | Count rate plots | Images |
|---|---|---|
| Comparison with Poisson distribution Blue bars denote a histogram of data divided into 1 sec bins. Red curve is a Poisson curve with rate = median count rate of data. |
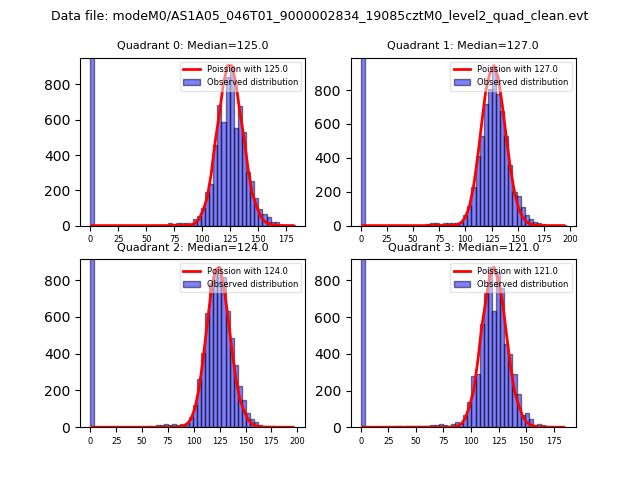 |
 |
| Quadrant-wise count rates Data is divided into 100 sec bins |
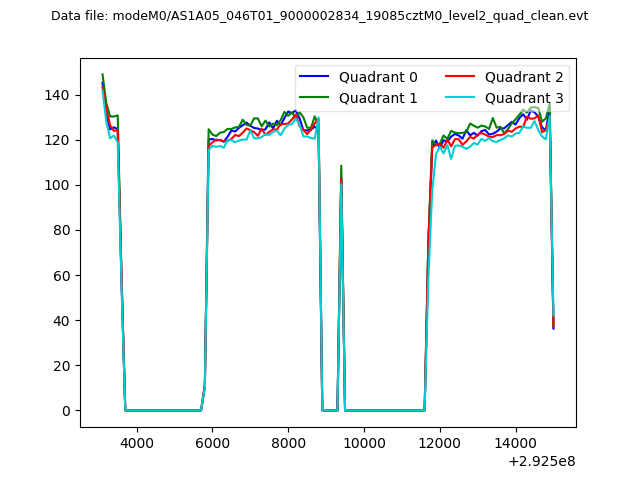 |
|
| Module-wise count rates for Quadrant A Data is divided into 100 sec bins |
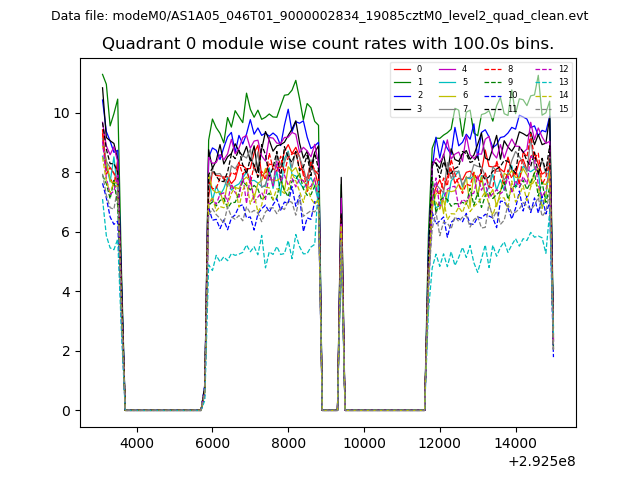 |
 |
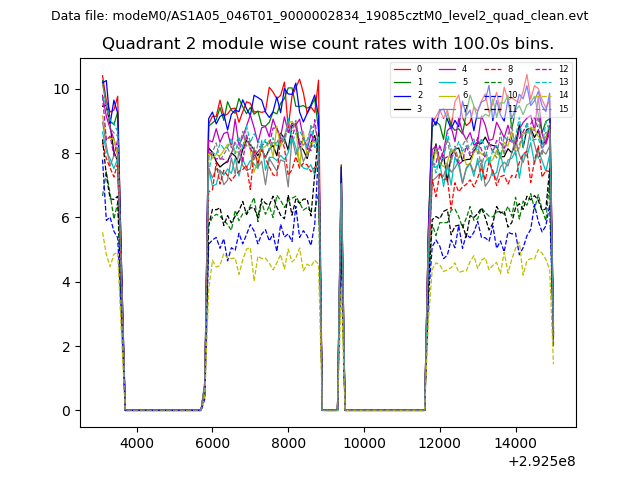
| Module-wise count rates for Quadrant B Data is divided into 100 sec bins |
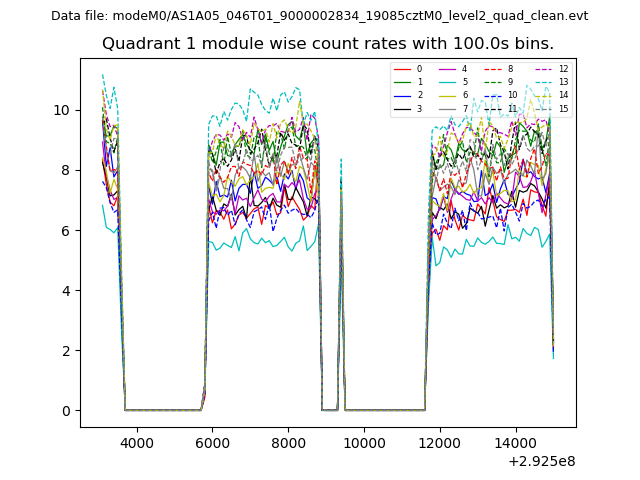 |
 |
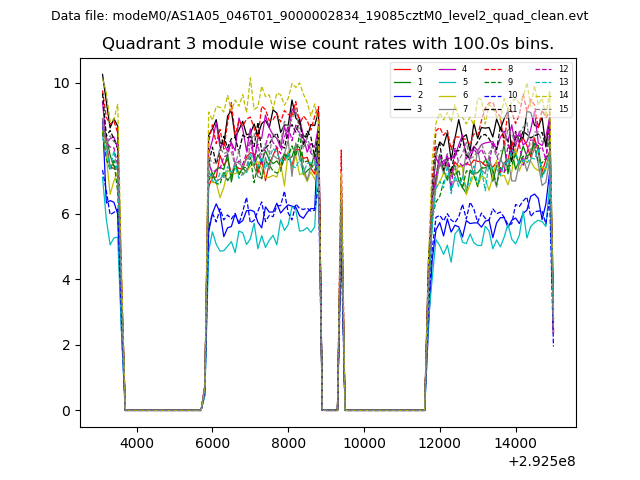
| Module-wise count rates for Quadrant C Data is divided into 100 sec bins |
 |
 |
| Module-wise count rates for Quadrant D Data is divided into 100 sec bins |
 |
 |
| Parameter | Plot |
|---|---|
| CZT HV Monitor | 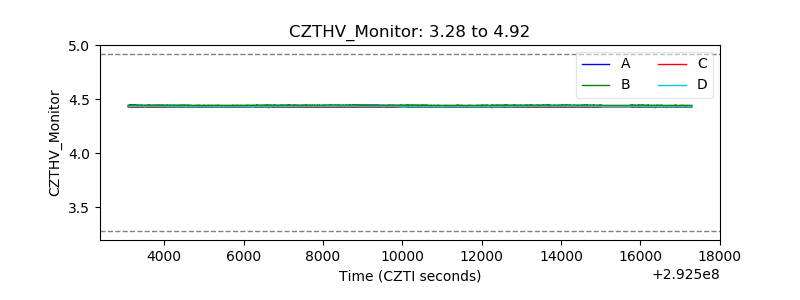 |
| D_VDD | 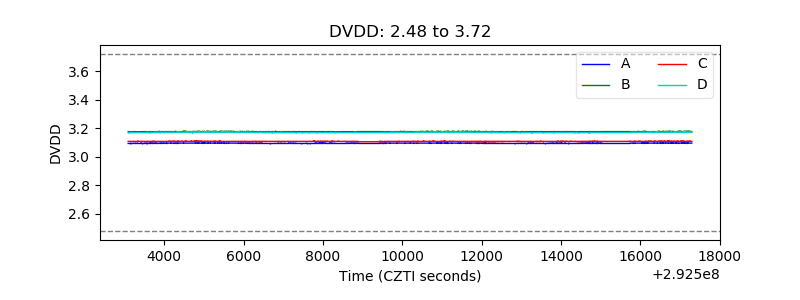 |
| Temperature 1 | 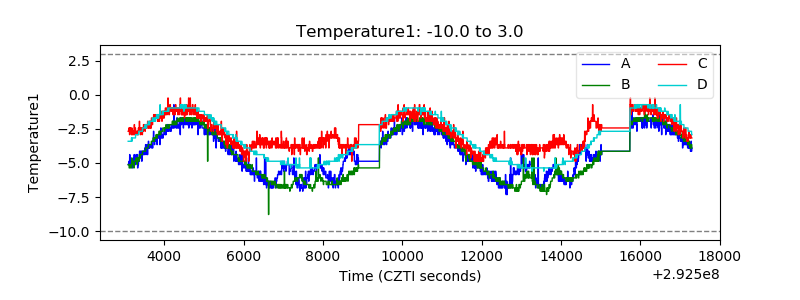 |
| Veto HV Monitor | 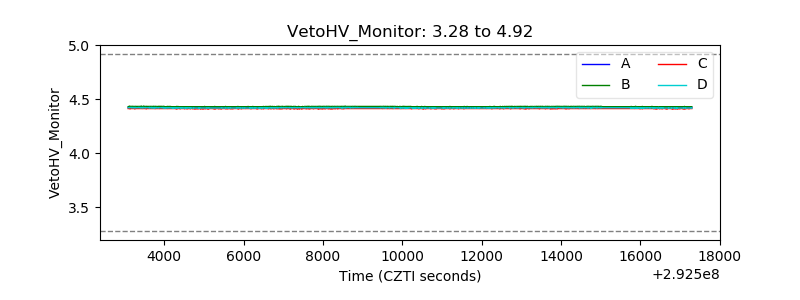 |
| Veto LLD |  |
| Alpha Counter | 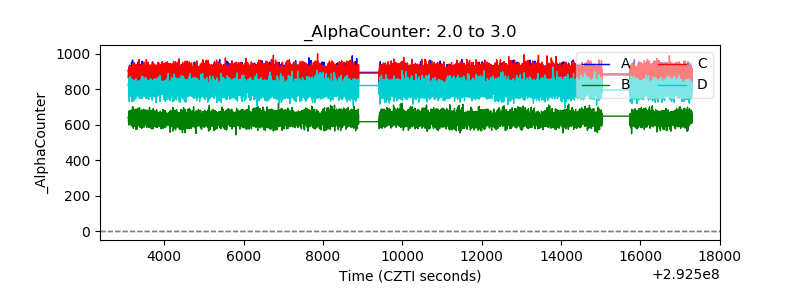 |
| _CPM_Rate | 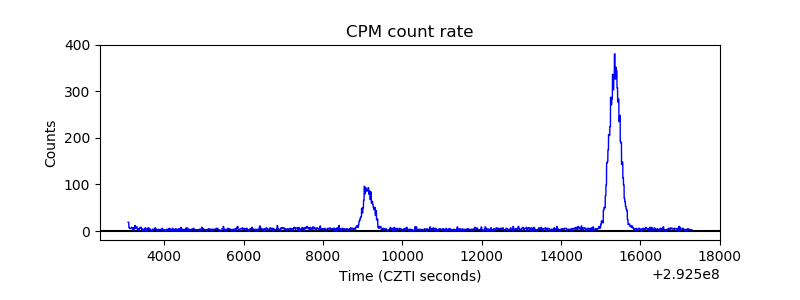 |
| CZT Counter | 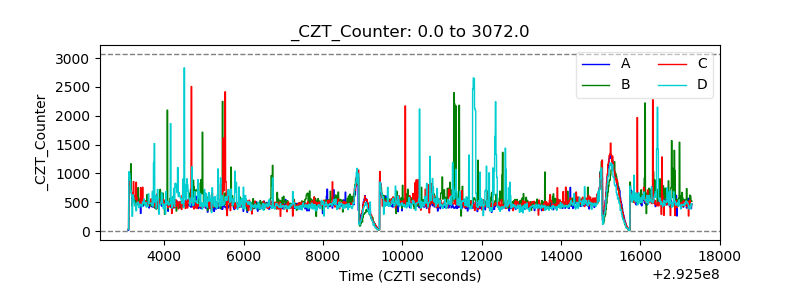 |
| +2.5 Volts monitor | 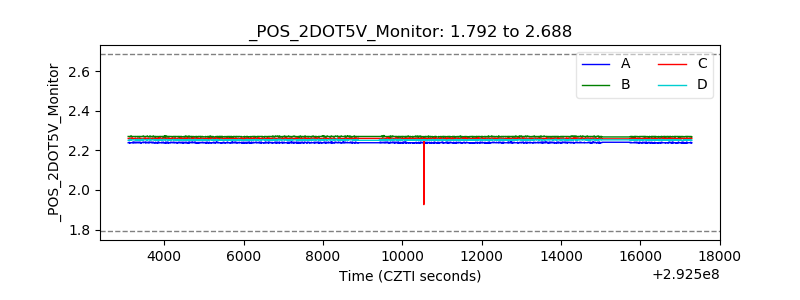 |
| +5 Volts monitor | 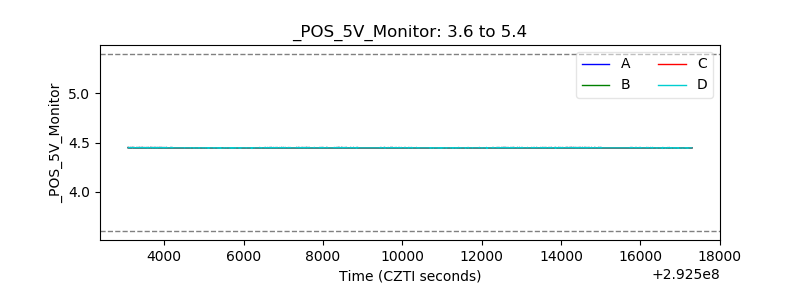 |
| _ROLL_ROT | 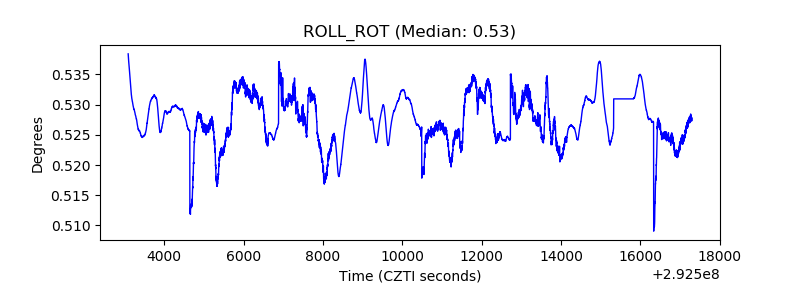 |
| _Roll_DEC | 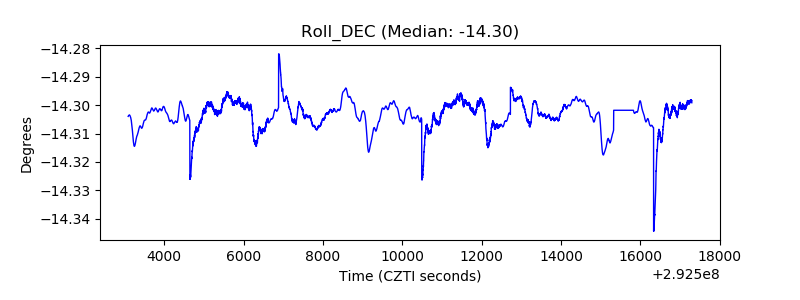 |
| _Roll_RA |  |
| Veto Counter | 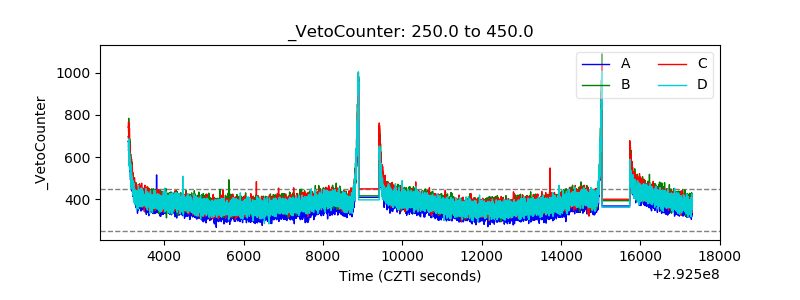 |