| Param | Original file | Final file |
|---|---|---|
| Filename | modeM0/AS1A05_046T01_9000002834_19086cztM0_level2.evt | modeM0/AS1A05_046T01_9000002834_19086cztM0_level2_quad_clean.evt |
| Size (bytes) | 2,317,950,720 | 374,368,320 |
| Size | 2.2 GB | 357.0 MB |
| Events in quadrant A | 15,382,111 | 2,287,560 |
| Events in quadrant B | 17,798,951 | 2,331,919 |
| Events in quadrant C | 16,678,545 | 2,269,593 |
| Events in quadrant D | 18,136,324 | 2,206,704 |
| Mode SS | |||
|---|---|---|---|
| Quadrant | BADHDUFLAG | Total packets | Discarded packets |
| A | 0 | 664 | 0 |
| B | 0 | 664 | 0 |
| C | 0 | 664 | 0 |
| D | 0 | 664 | 0 |
| Mode M0 | |||
|---|---|---|---|
| Quadrant | BADHDUFLAG | Total packets | Discarded packets |
| A | 0 | 67147 | 7 |
| B | 0 | 73128 | 6 |
| C | 0 | 69944 | 6 |
| D | 0 | 75591 | 6 |
| Mode M9 | |||
|---|---|---|---|
| Quadrant | BADHDUFLAG | Total packets | Discarded packets |
| A | 0 | 23 | 0 |
| B | 0 | 23 | 0 |
| C | 0 | 23 | 0 |
| D | 0 | 23 | 0 |
| Quadrant | Total seconds | Saturated seconds | Saturation percentage |
|---|---|---|---|
| A | 32634 | 606 | 1.856959% |
| B | 32635 | 902 | 2.763904% |
| C | 32635 | 808 | 2.475869% |
| D | 32635 | 908 | 2.782289% |
Noise dominated data is calculated using 1-second bins in cleaned event files. If a bin has >2000 counts, and if more than 50% of those come from <1% of pixels, then it is considered to be noise-dominated and hence unusable.
| Quadrant | # 1 sec bins | Bins with >0 counts | Bins with >2000 counts | High rate bins dominated by noise | Noise dominated (total time) | Noise dominated (detector-on time) | Marked lightcurve |
|---|---|---|---|---|---|---|---|
| A | 38060 | 32641 | 11 | 11 | 0.03% | 0.03% | 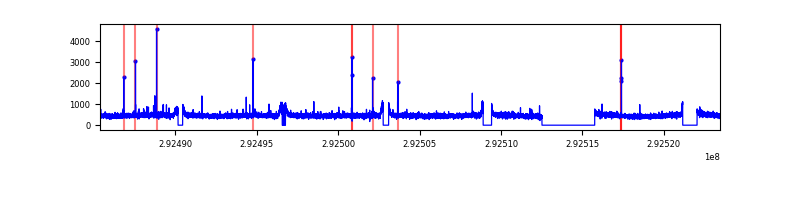 |
| B | 38061 | 32643 | 166 | 166 | 0.44% | 0.51% | 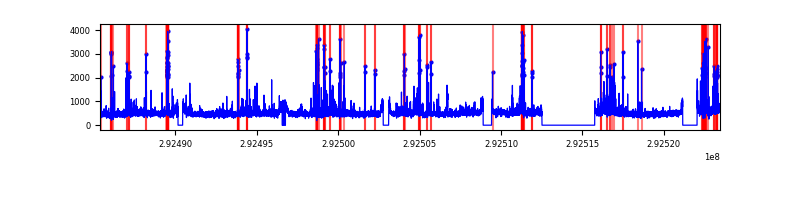 |
| C | 38061 | 32642 | 74 | 74 | 0.19% | 0.23% | 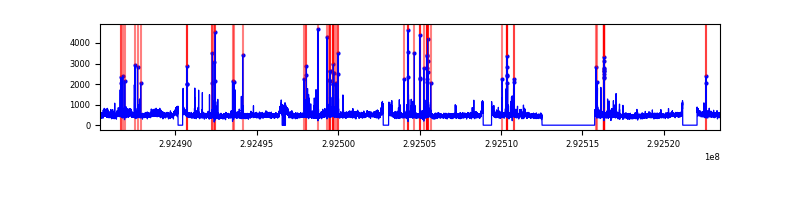 |
| D | 38061 | 32643 | 337 | 337 | 0.89% | 1.03% | 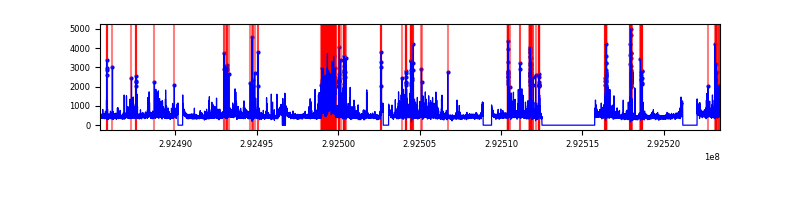 |
Top three noisy pixels from each quadrant. If the there are fewer than three noisy pixels in the level2.evt file, extra rows are filled as -1
| Pixel properties | Quadrant properties | ||||||
|---|---|---|---|---|---|---|---|
| Quadrant | DetID | PixID | Counts | Sigma | Mean | Median | Sigma |
| A | 9 | 143 | 55239 | 64.0 | 3965 | 3864 | 802.7 |
| A | 15 | 174 | 50697 | 58.34 | 3965 | 3864 | 802.7 |
| A | 13 | 254 | 40538 | 45.69 | 3965 | 3864 | 802.7 |
| B | 3 | 112 | 920764 | 1209.76 | 3945 | 3835 | 757.9 |
| B | 10 | 245 | 473722 | 619.95 | 3945 | 3835 | 757.9 |
| B | 7 | 220 | 393726 | 514.41 | 3945 | 3835 | 757.9 |
| C | 0 | 207 | 610086 | 673.11 | 3824 | 3846 | 900.6 |
| C | 14 | 238 | 584266 | 644.45 | 3824 | 3846 | 900.6 |
| C | 3 | 233 | 572751 | 631.66 | 3824 | 3846 | 900.6 |
| D | 7 | 238 | 1646435 | 1750.46 | 3866 | 3759 | 938.4 |
| D | 1 | 52 | 980059 | 1040.36 | 3866 | 3759 | 938.4 |
| D | 11 | 176 | 761750 | 807.73 | 3866 | 3759 | 938.4 |
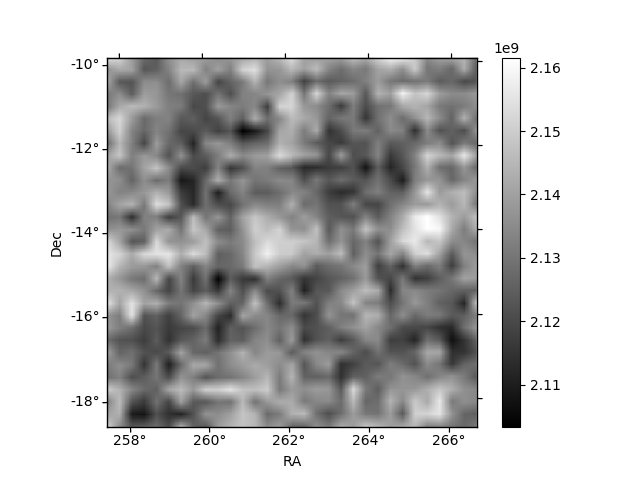
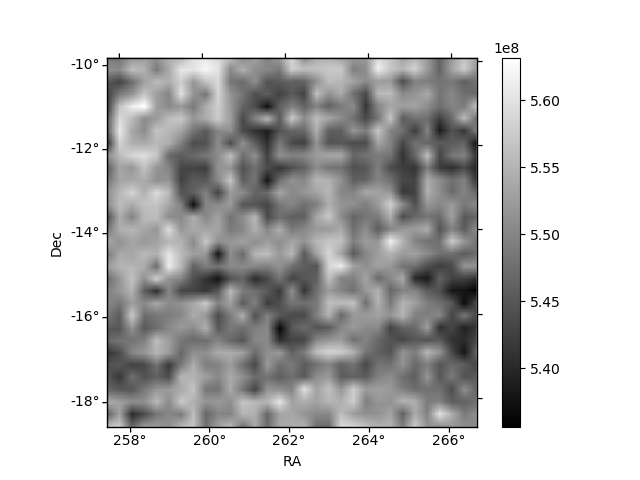
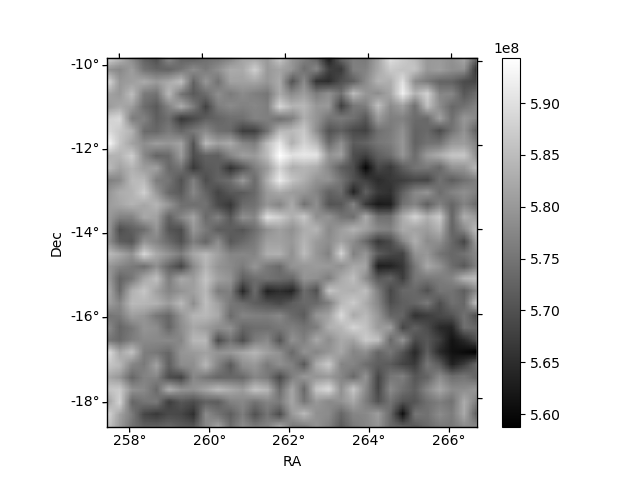
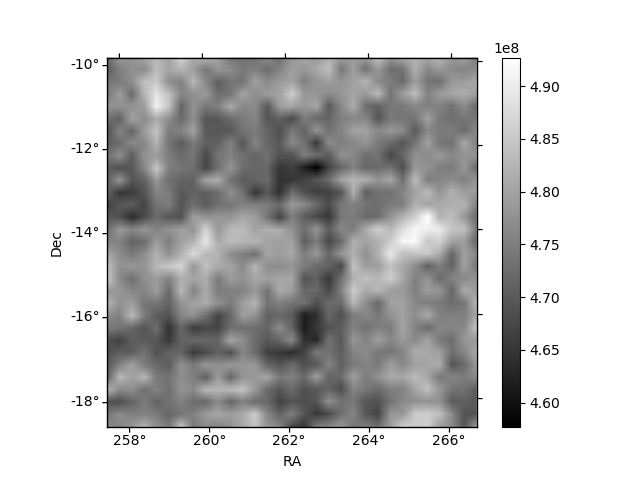
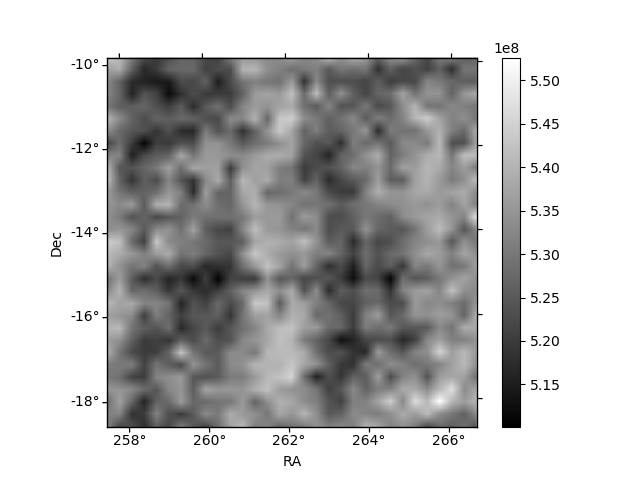
Histogram calculated using DETX and DETY for each event in the final _common_clean file
| Quadrant A | 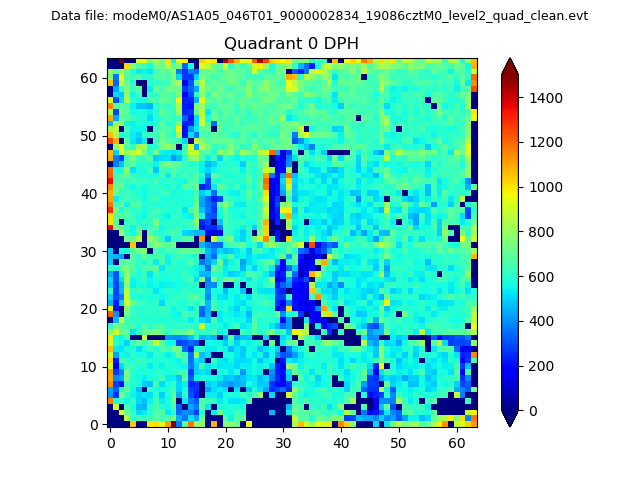 |
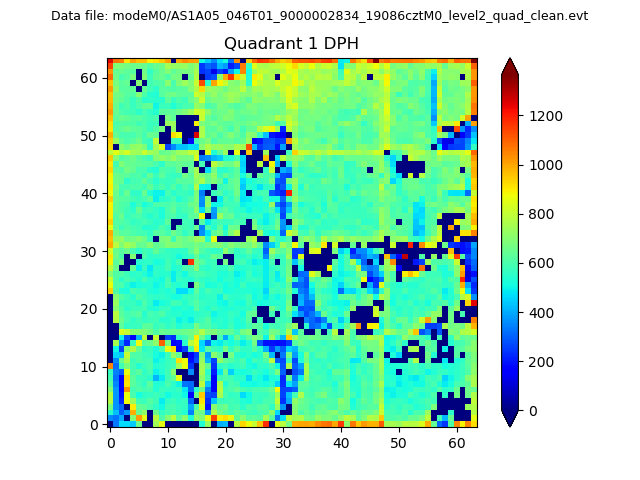 |
Quadrant B |
|---|---|---|---|
| Quadrant D | 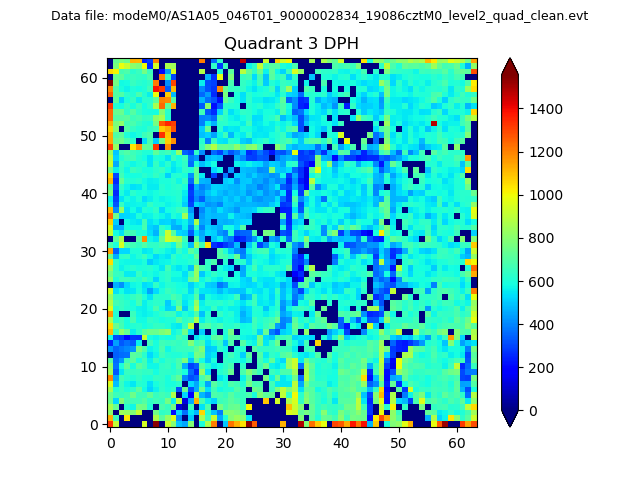 |
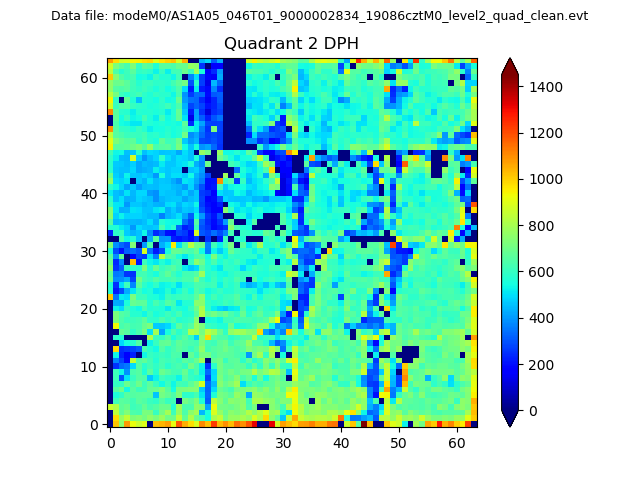 |
Quadrant C |
| Plot type | Count rate plots | Images |
|---|---|---|
| Comparison with Poisson distribution Blue bars denote a histogram of data divided into 1 sec bins. Red curve is a Poisson curve with rate = median count rate of data. |
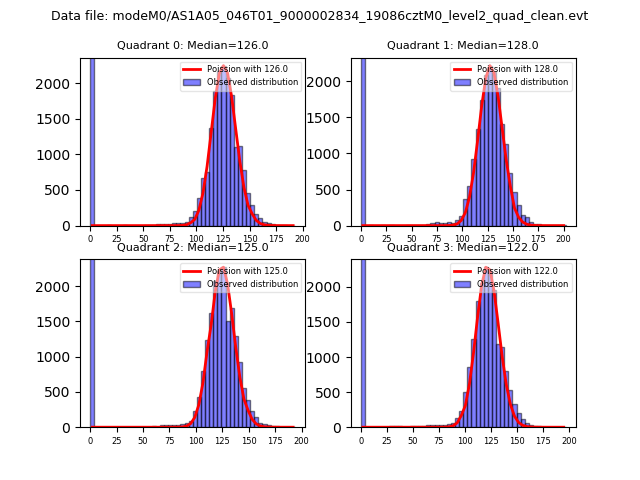 |
 |
| Quadrant-wise count rates Data is divided into 100 sec bins |
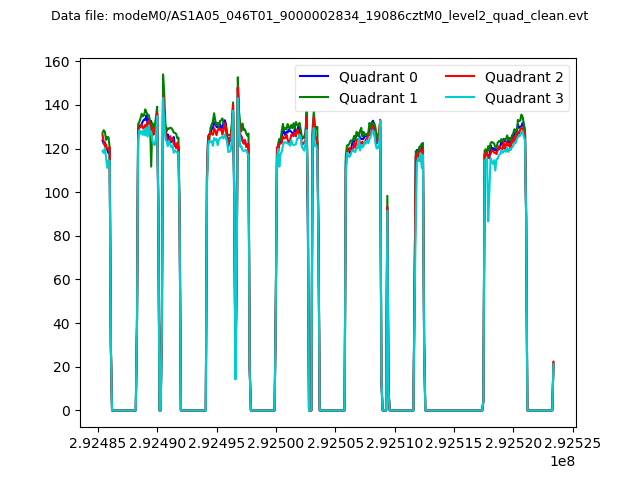 |
|
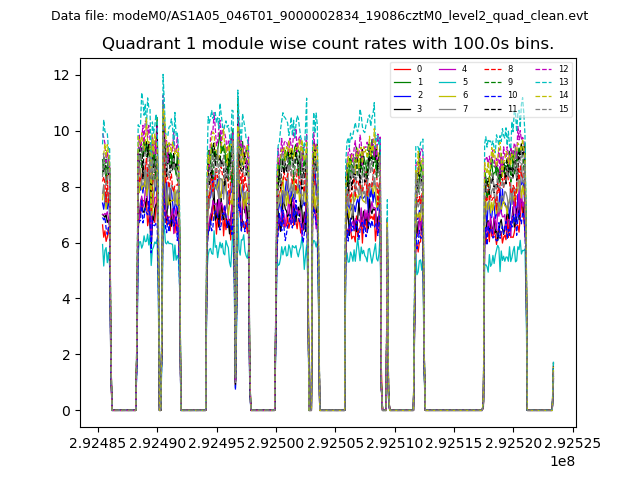
| Module-wise count rates for Quadrant A Data is divided into 100 sec bins |
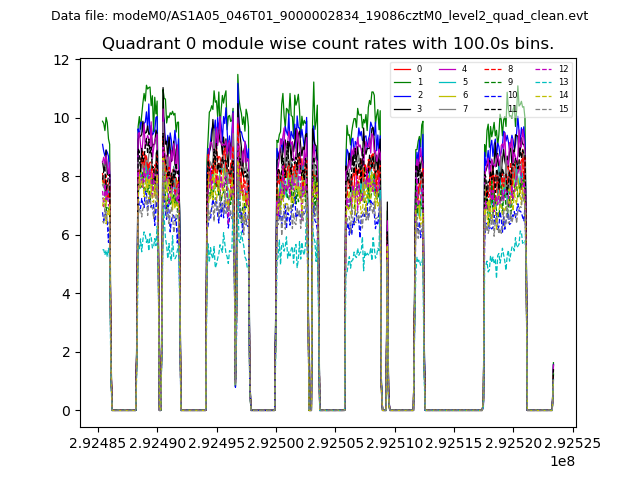 |
 |
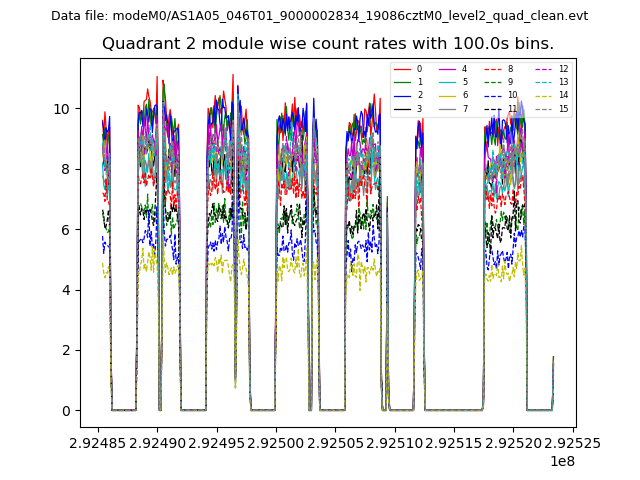
| Module-wise count rates for Quadrant B Data is divided into 100 sec bins |
 |
 |
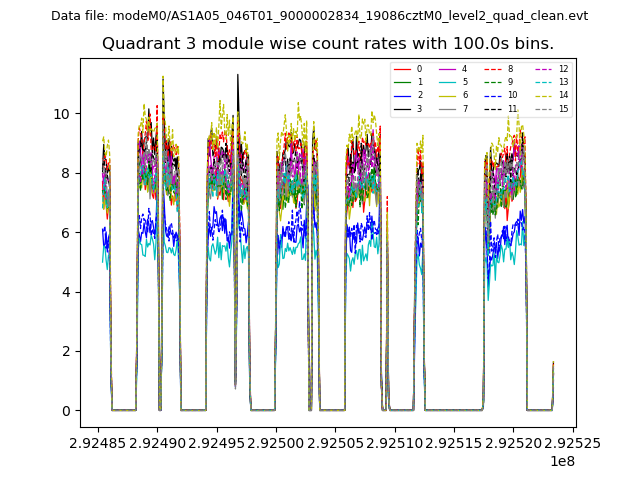
| Module-wise count rates for Quadrant C Data is divided into 100 sec bins |
 |
 |
| Module-wise count rates for Quadrant D Data is divided into 100 sec bins |
 |
 |
| Parameter | Plot |
|---|---|
| CZT HV Monitor | 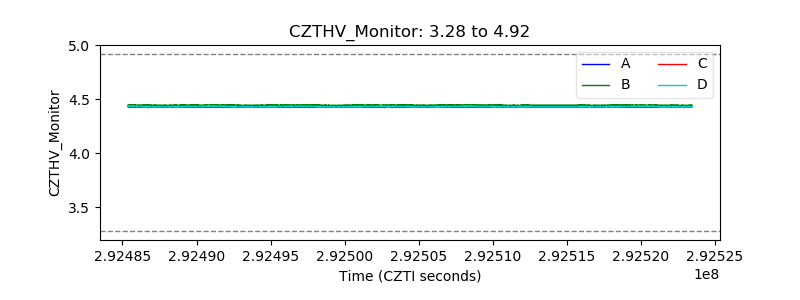 |
| D_VDD | 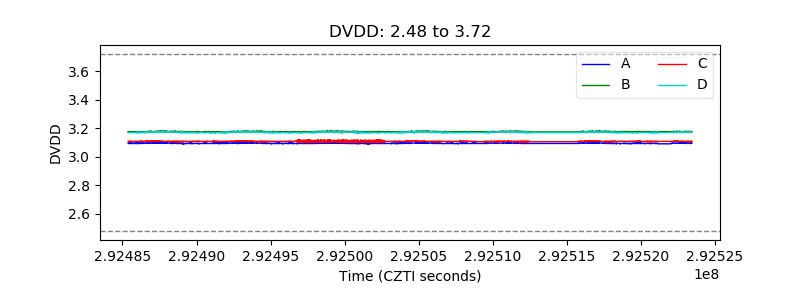 |
| Temperature 1 | 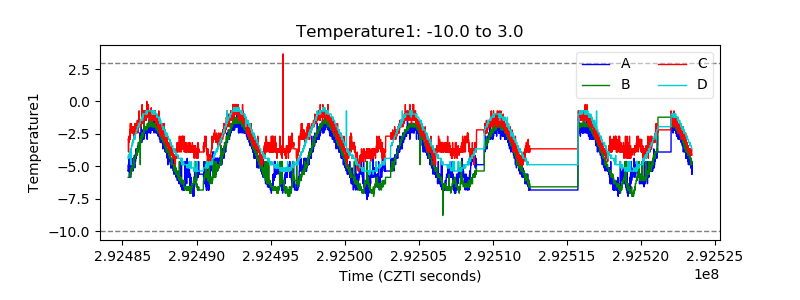 |
| Veto HV Monitor |  |
| Veto LLD | 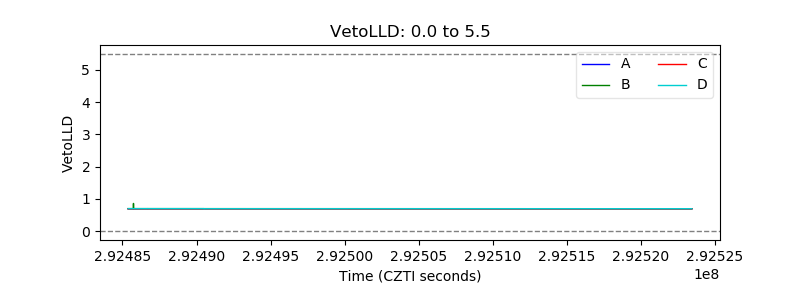 |
| Alpha Counter | 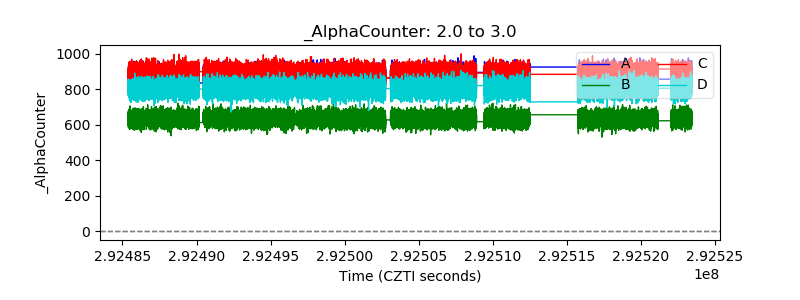 |
| _CPM_Rate | 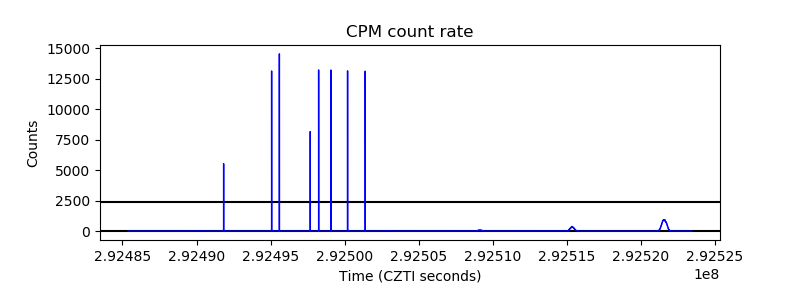 |
| CZT Counter | 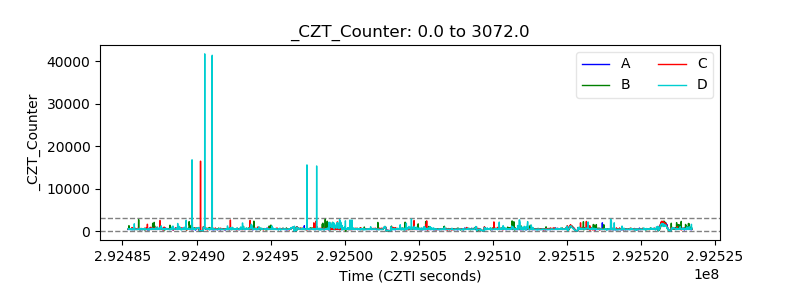 |
| +2.5 Volts monitor |  |
| +5 Volts monitor |  |
| _ROLL_ROT | 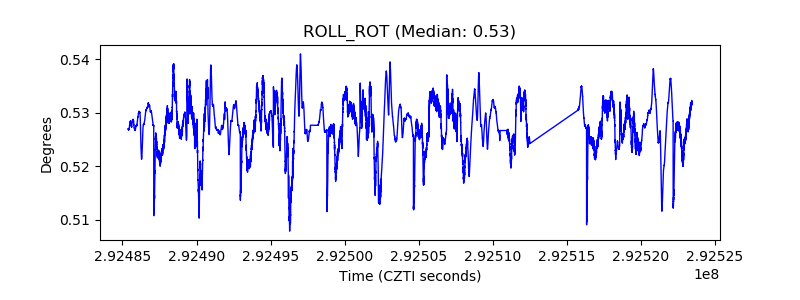 |
| _Roll_DEC | 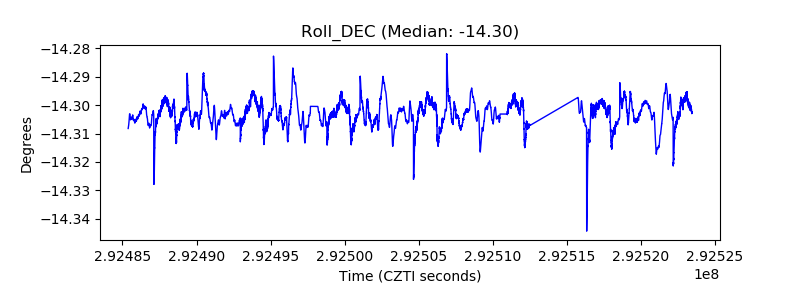 |
| _Roll_RA | 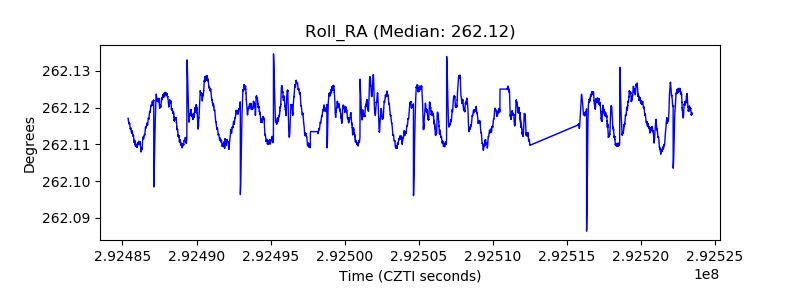 |
| Veto Counter | 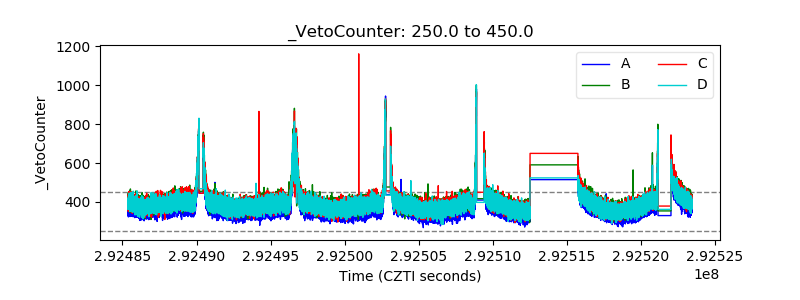 |