| Param | Original file | Final file |
|---|---|---|
| Filename | modeM0/AS1A05_046T01_9000002834_19089cztM0_level2.evt | modeM0/AS1A05_046T01_9000002834_19089cztM0_level2_quad_clean.evt |
| Size (bytes) | 514,154,880 | 92,499,840 |
| Size | 490.3 MB | 88.2 MB |
| Events in quadrant A | 3,455,794 | 588,468 |
| Events in quadrant B | 4,585,272 | 597,792 |
| Events in quadrant C | 3,525,013 | 580,376 |
| Events in quadrant D | 3,545,371 | 562,599 |
| Mode SS | |||
|---|---|---|---|
| Quadrant | BADHDUFLAG | Total packets | Discarded packets |
| A | 0 | 140 | 0 |
| B | 0 | 140 | 0 |
| C | 0 | 140 | 0 |
| D | 0 | 140 | 0 |
| Mode M0 | |||
|---|---|---|---|
| Quadrant | BADHDUFLAG | Total packets | Discarded packets |
| A | 0 | 14654 | 2 |
| B | 0 | 18268 | 2 |
| C | 0 | 14794 | 2 |
| D | 0 | 15086 | 2 |
| Mode M9 | |||
|---|---|---|---|
| Quadrant | BADHDUFLAG | Total packets | Discarded packets |
| A | 0 | 21 | 0 |
| B | 0 | 21 | 0 |
| C | 0 | 21 | 0 |
| D | 0 | 21 | 0 |
| Quadrant | Total seconds | Saturated seconds | Saturation percentage |
|---|---|---|---|
| A | 6770 | 119 | 1.757755% |
| B | 6770 | 349 | 5.155096% |
| C | 6770 | 140 | 2.067947% |
| D | 6771 | 106 | 1.565500% |
Noise dominated data is calculated using 1-second bins in cleaned event files. If a bin has >2000 counts, and if more than 50% of those come from <1% of pixels, then it is considered to be noise-dominated and hence unusable.
| Quadrant | # 1 sec bins | Bins with >0 counts | Bins with >2000 counts | High rate bins dominated by noise | Noise dominated (total time) | Noise dominated (detector-on time) | Marked lightcurve |
|---|---|---|---|---|---|---|---|
| A | 8915 | 6771 | 20 | 20 | 0.22% | 0.30% | 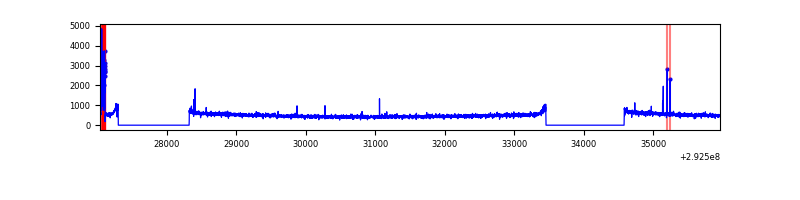 |
| B | 8915 | 6771 | 95 | 95 | 1.07% | 1.40% | 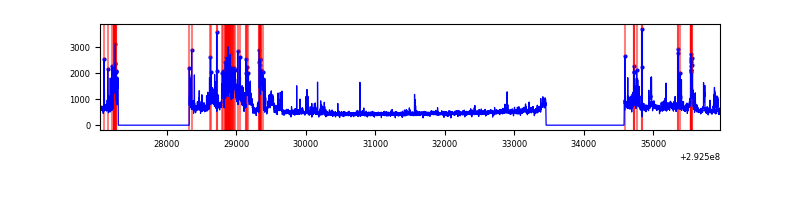 |
| C | 8915 | 6772 | 1 | 1 | 0.01% | 0.01% | 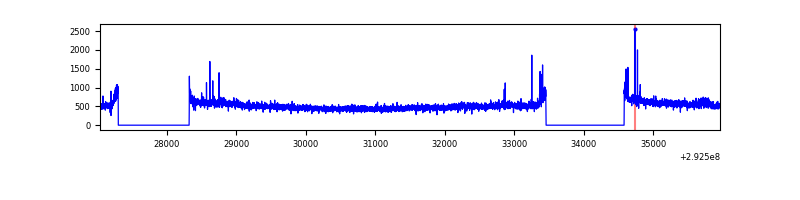 |
| D | 8916 | 6772 | 23 | 23 | 0.26% | 0.34% | 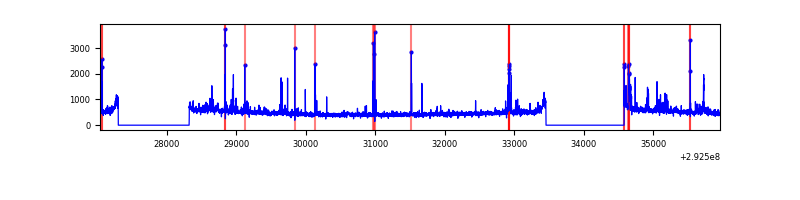 |
Top three noisy pixels from each quadrant. If the there are fewer than three noisy pixels in the level2.evt file, extra rows are filled as -1
| Pixel properties | Quadrant properties | ||||||
|---|---|---|---|---|---|---|---|
| Quadrant | DetID | PixID | Counts | Sigma | Mean | Median | Sigma |
| A | 9 | 143 | 91179 | 516.56 | 868 | 851 | 174.9 |
| A | 15 | 174 | 19938 | 109.15 | 868 | 851 | 174.9 |
| A | 13 | 254 | 7990 | 40.83 | 868 | 851 | 174.9 |
| B | 3 | 112 | 874350 | 5281.61 | 864 | 843 | 165.4 |
| B | 6 | 36 | 69722 | 416.47 | 864 | 843 | 165.4 |
| B | 0 | 189 | 57825 | 344.54 | 864 | 843 | 165.4 |
| C | 14 | 238 | 129663 | 647.84 | 842 | 849 | 198.8 |
| C | 3 | 233 | 85584 | 426.16 | 842 | 849 | 198.8 |
| C | 0 | 207 | 22690 | 109.84 | 842 | 849 | 198.8 |
| D | 1 | 52 | 142959 | 684.93 | 849 | 822 | 207.5 |
| D | 7 | 238 | 84274 | 402.14 | 849 | 822 | 207.5 |
| D | 7 | 96 | 34867 | 164.06 | 849 | 822 | 207.5 |
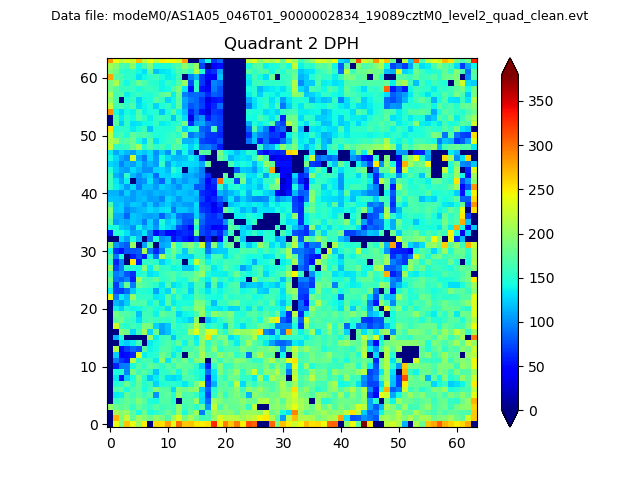
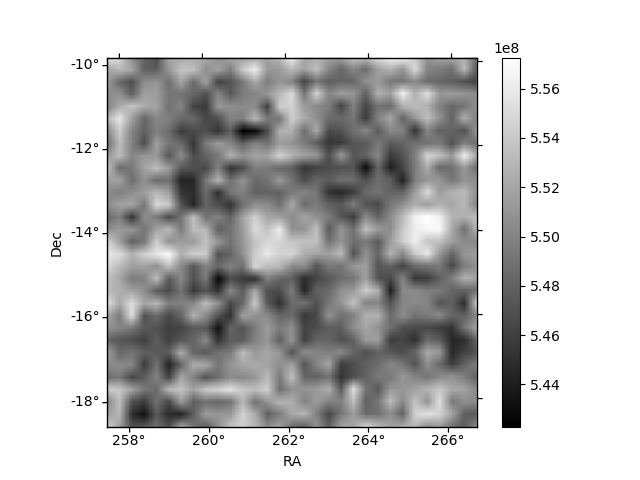
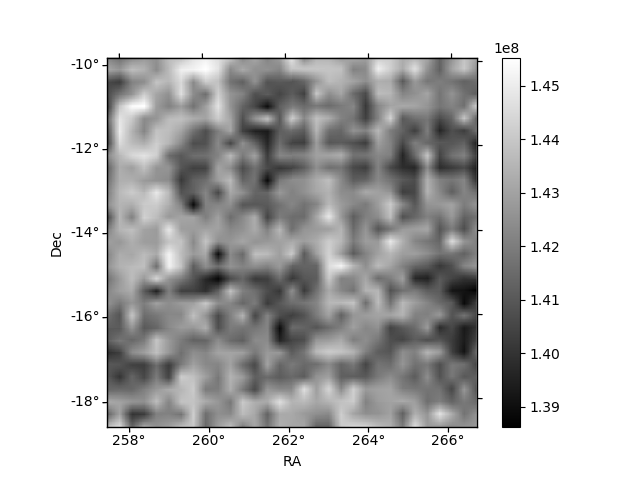
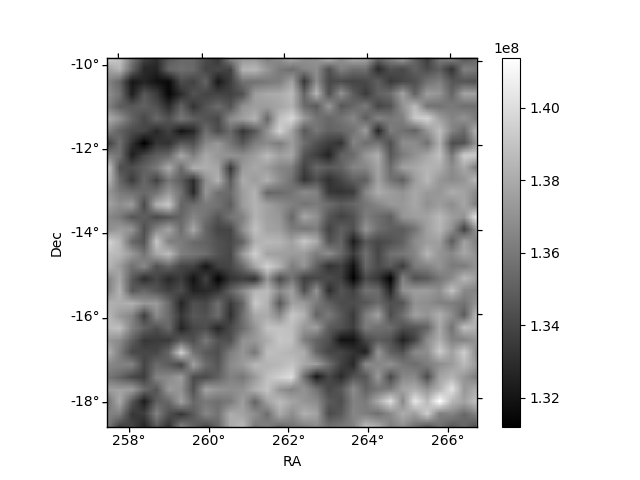
Histogram calculated using DETX and DETY for each event in the final _common_clean file
| Quadrant A | 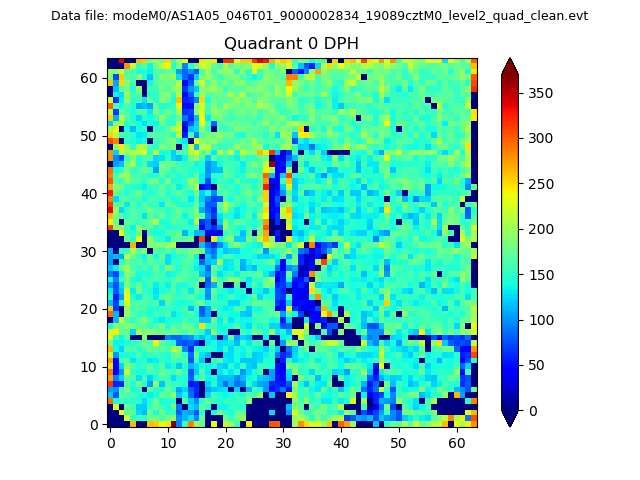 |
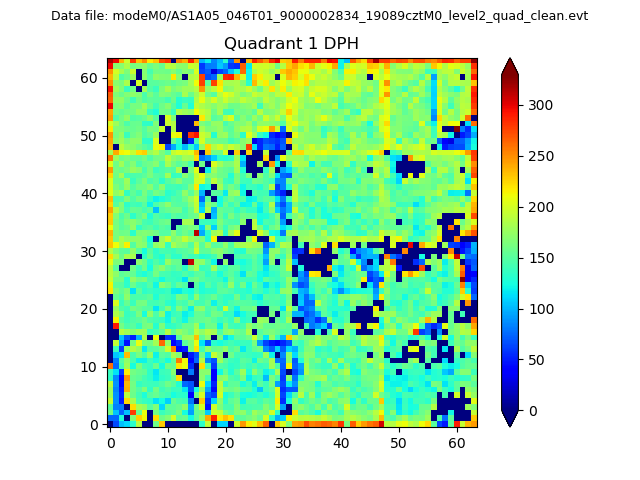 |
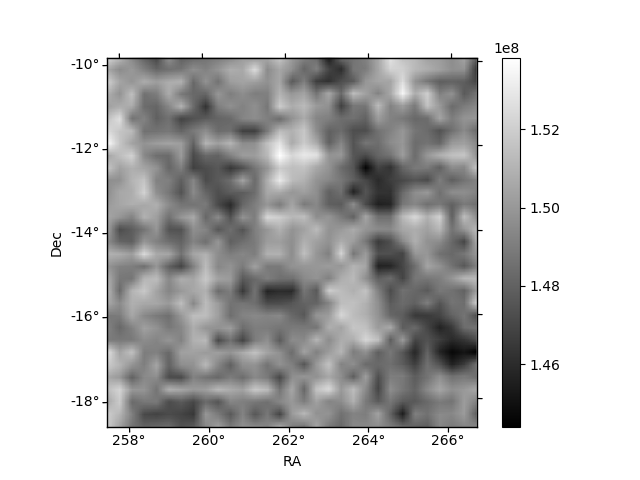
Quadrant B |
|---|---|---|---|
| Quadrant D | 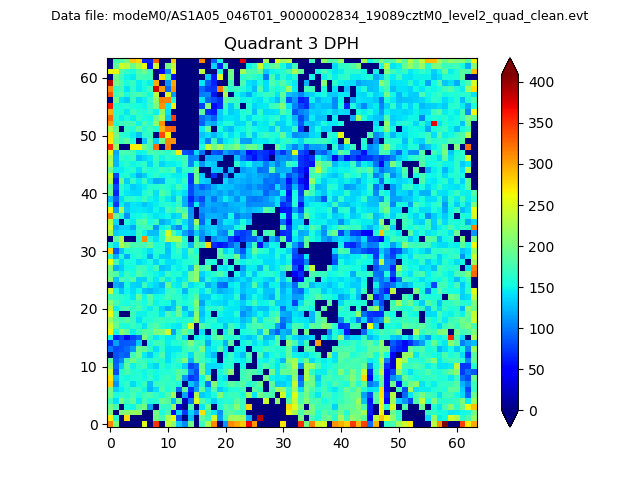 |
 |
Quadrant C |
| Plot type | Count rate plots | Images |
|---|---|---|
| Comparison with Poisson distribution Blue bars denote a histogram of data divided into 1 sec bins. Red curve is a Poisson curve with rate = median count rate of data. |
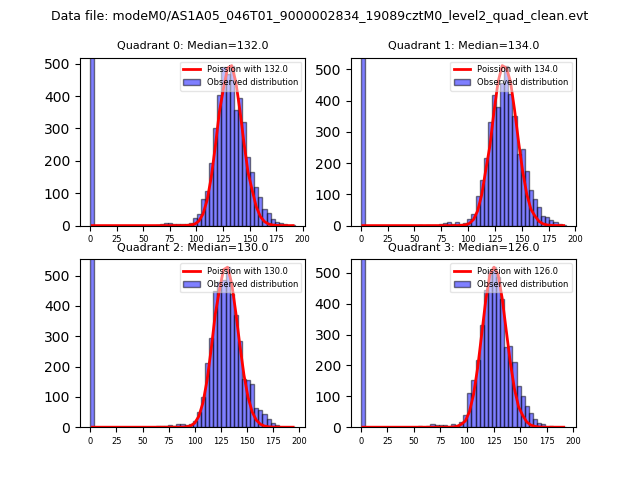 |
 |
| Quadrant-wise count rates Data is divided into 100 sec bins |
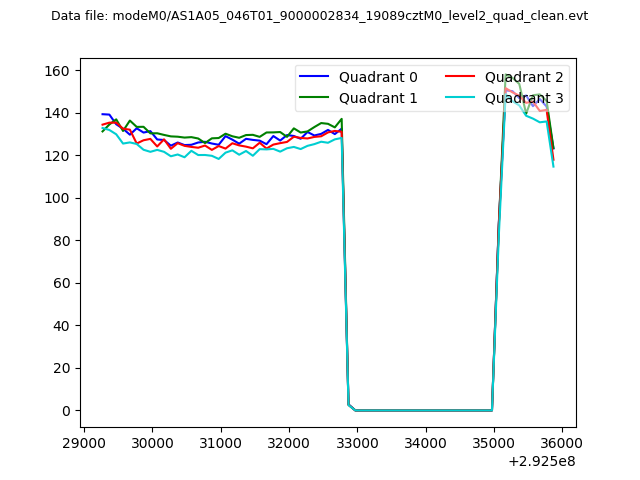 |
|
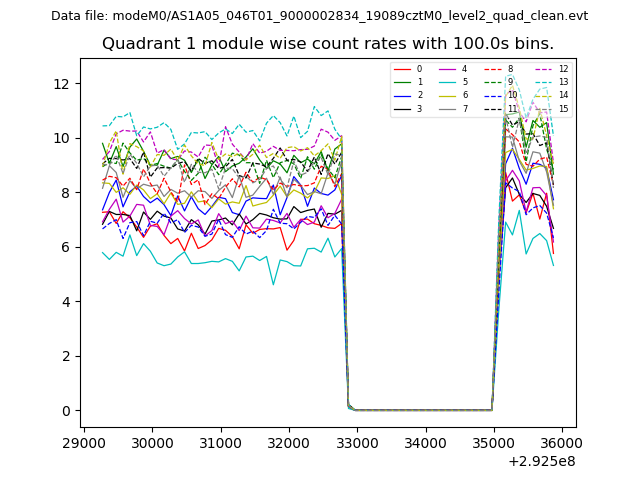
| Module-wise count rates for Quadrant A Data is divided into 100 sec bins |
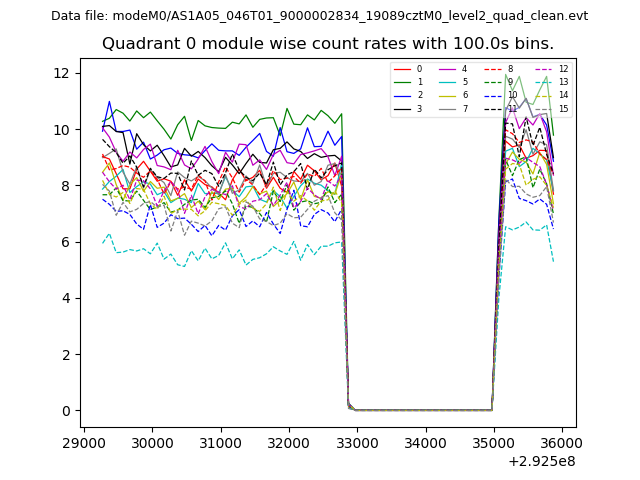 |
 |
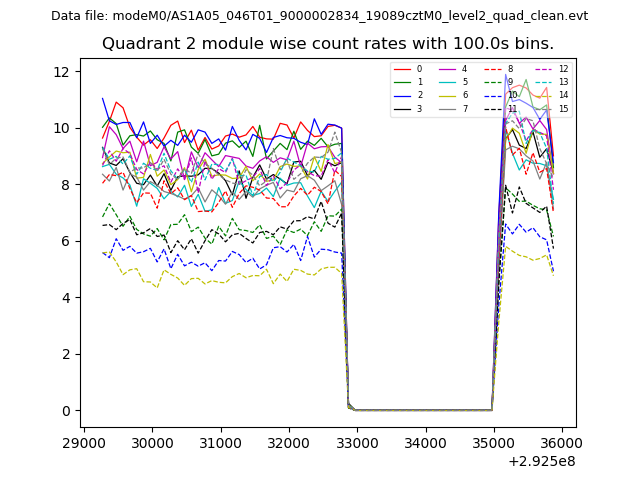
| Module-wise count rates for Quadrant B Data is divided into 100 sec bins |
 |
 |
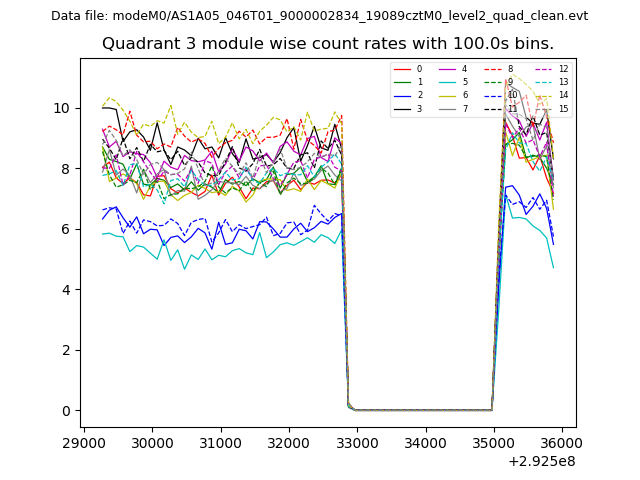
| Module-wise count rates for Quadrant C Data is divided into 100 sec bins |
 |
 |
| Module-wise count rates for Quadrant D Data is divided into 100 sec bins |
 |
 |
| Parameter | Plot |
|---|---|
| CZT HV Monitor | 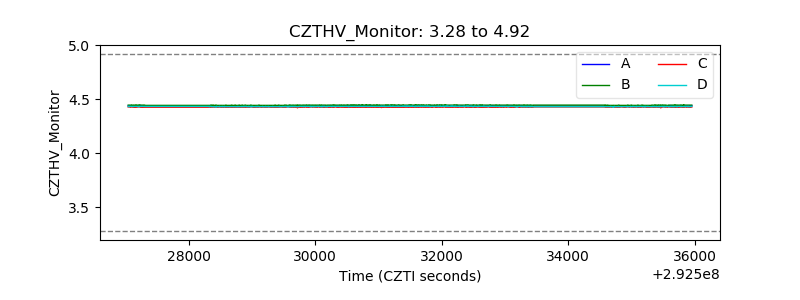 |
| D_VDD | 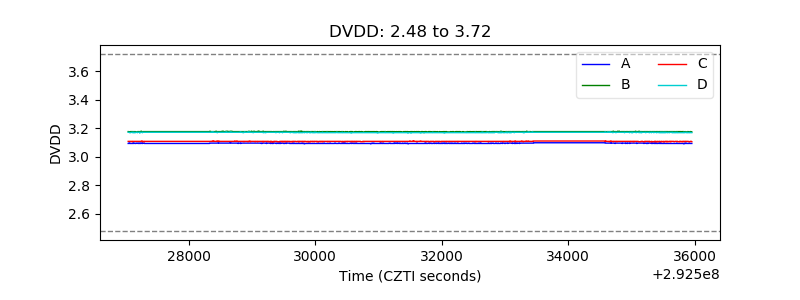 |
| Temperature 1 | 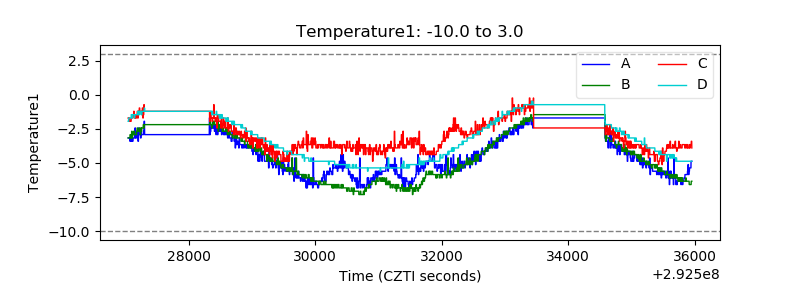 |
| Veto HV Monitor |  |
| Veto LLD | 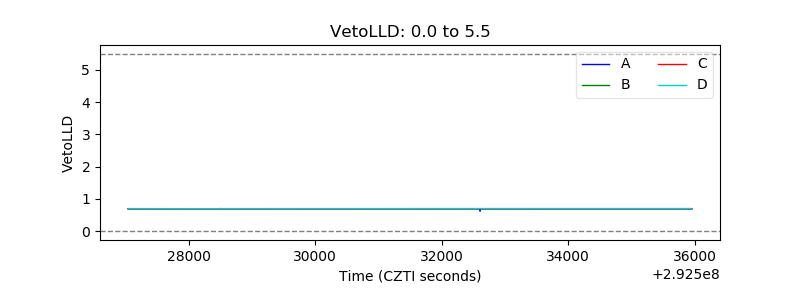 |
| Alpha Counter |  |
| _CPM_Rate | 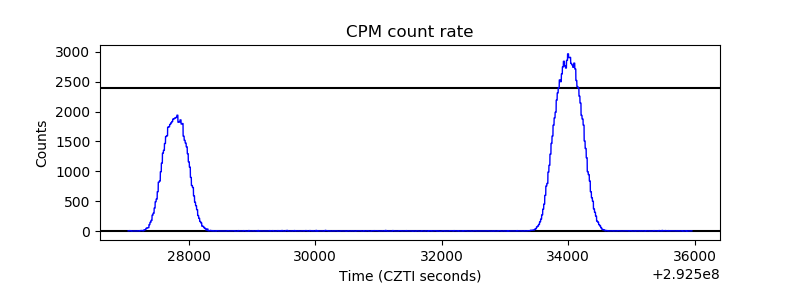 |
| CZT Counter | 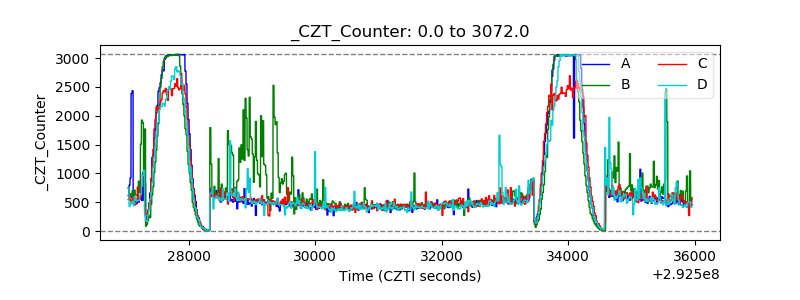 |
| +2.5 Volts monitor |  |
| +5 Volts monitor |  |
| _ROLL_ROT | 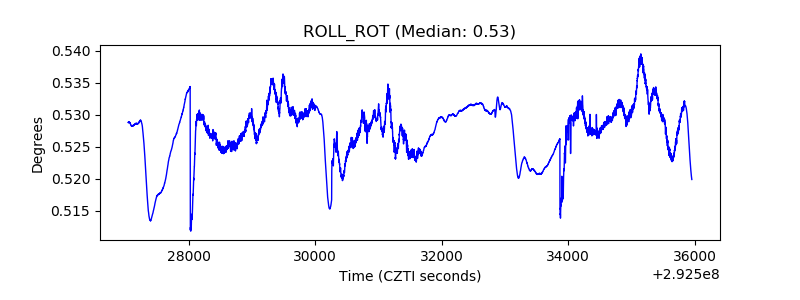 |
| _Roll_DEC | 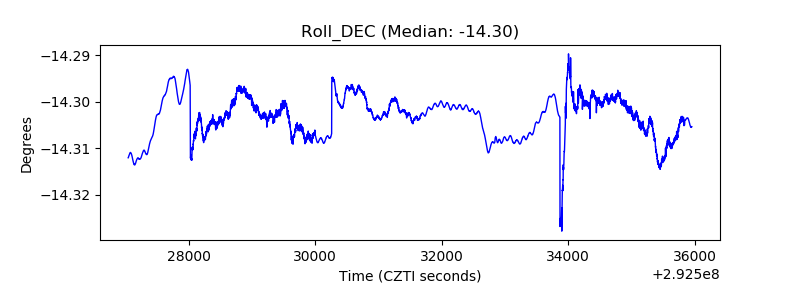 |
| _Roll_RA | 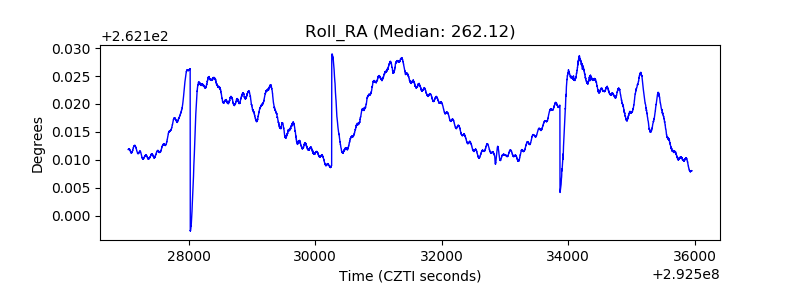 |
| Veto Counter | 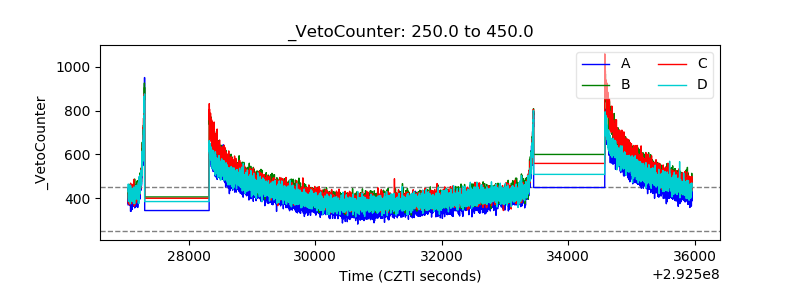 |