| Param | Original file | Final file |
|---|---|---|
| Filename | modeM0/AS1A05_046T01_9000002834_19091cztM0_level2.evt | modeM0/AS1A05_046T01_9000002834_19091cztM0_level2_quad_clean.evt |
| Size (bytes) | 437,120,640 | 107,300,160 |
| Size | 416.9 MB | 102.3 MB |
| Events in quadrant A | 3,077,987 | 707,685 |
| Events in quadrant B | 3,312,188 | 735,807 |
| Events in quadrant C | 3,305,456 | 705,991 |
| Events in quadrant D | 3,129,545 | 675,914 |
| Mode SS | |||
|---|---|---|---|
| Quadrant | BADHDUFLAG | Total packets | Discarded packets |
| A | 0 | 122 | 0 |
| B | 0 | 122 | 0 |
| C | 0 | 122 | 0 |
| D | 0 | 122 | 0 |
| Mode M0 | |||
|---|---|---|---|
| Quadrant | BADHDUFLAG | Total packets | Discarded packets |
| A | 0 | 12915 | 1 |
| B | 0 | 13634 | 1 |
| C | 0 | 13587 | 1 |
| D | 0 | 13222 | 1 |
| Mode M9 | |||
|---|---|---|---|
| Quadrant | BADHDUFLAG | Total packets | Discarded packets |
| A | 0 | 15 | 0 |
| B | 0 | 16 | 0 |
| C | 0 | 16 | 0 |
| D | 0 | 16 | 0 |
| Quadrant | Total seconds | Saturated seconds | Saturation percentage |
|---|---|---|---|
| A | 6083 | 17 | 0.279467% |
| B | 6083 | 64 | 1.052112% |
| C | 6083 | 82 | 1.348019% |
| D | 6082 | 26 | 0.427491% |
Noise dominated data is calculated using 1-second bins in cleaned event files. If a bin has >2000 counts, and if more than 50% of those come from <1% of pixels, then it is considered to be noise-dominated and hence unusable.
| Quadrant | # 1 sec bins | Bins with >0 counts | Bins with >2000 counts | High rate bins dominated by noise | Noise dominated (total time) | Noise dominated (detector-on time) | Marked lightcurve |
|---|---|---|---|---|---|---|---|
| A | 7413 | 6084 | 0 | 0 | 0.00% | 0.00% | 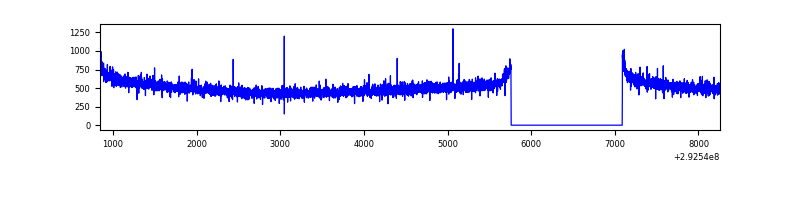 |
| B | 7413 | 6084 | 10 | 10 | 0.13% | 0.16% | 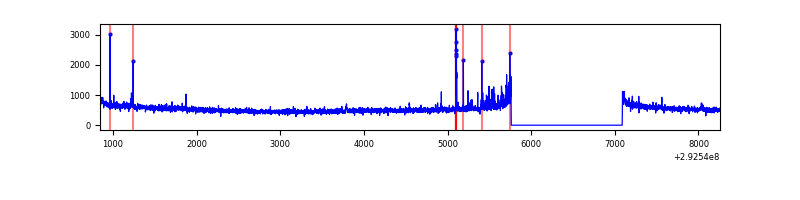 |
| C | 7413 | 6084 | 2 | 2 | 0.03% | 0.03% | 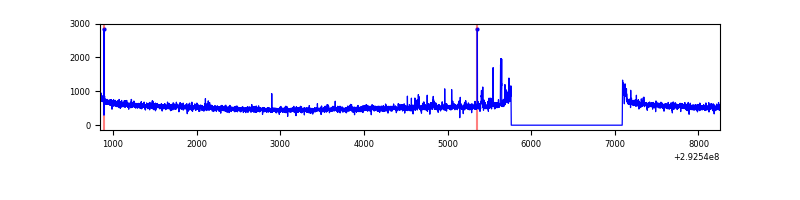 |
| D | 7412 | 6083 | 12 | 12 | 0.16% | 0.20% | 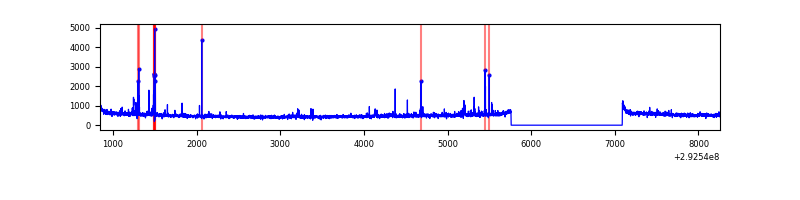 |
Top three noisy pixels from each quadrant. If the there are fewer than three noisy pixels in the level2.evt file, extra rows are filled as -1
| Pixel properties | Quadrant properties | ||||||
|---|---|---|---|---|---|---|---|
| Quadrant | DetID | PixID | Counts | Sigma | Mean | Median | Sigma |
| A | 13 | 254 | 9065 | 51.5 | 797 | 781 | 160.8 |
| A | 0 | 226 | 7012 | 38.74 | 797 | 781 | 160.8 |
| A | 3 | 137 | 5936 | 32.05 | 797 | 781 | 160.8 |
| B | 3 | 112 | 50282 | 330.31 | 807 | 789 | 149.8 |
| B | 7 | 220 | 38865 | 254.12 | 807 | 789 | 149.8 |
| B | 0 | 189 | 24368 | 157.36 | 807 | 789 | 149.8 |
| C | 14 | 238 | 123125 | 671.33 | 781 | 791 | 182.2 |
| C | 3 | 233 | 122331 | 666.97 | 781 | 791 | 182.2 |
| C | 0 | 207 | 13970 | 72.32 | 781 | 791 | 182.2 |
| D | 1 | 52 | 85882 | 452.89 | 780 | 758 | 188.0 |
| D | 7 | 96 | 48106 | 251.91 | 780 | 758 | 188.0 |
| D | 11 | 176 | 44858 | 234.63 | 780 | 758 | 188.0 |
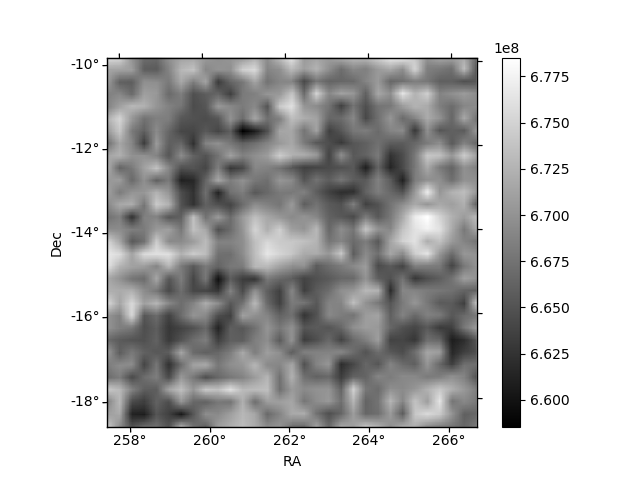
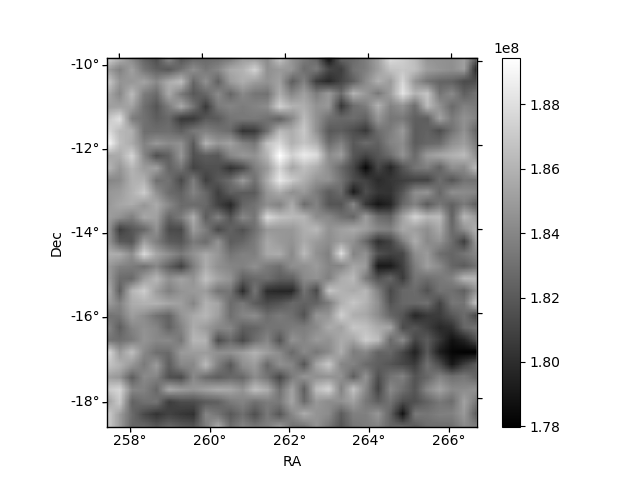
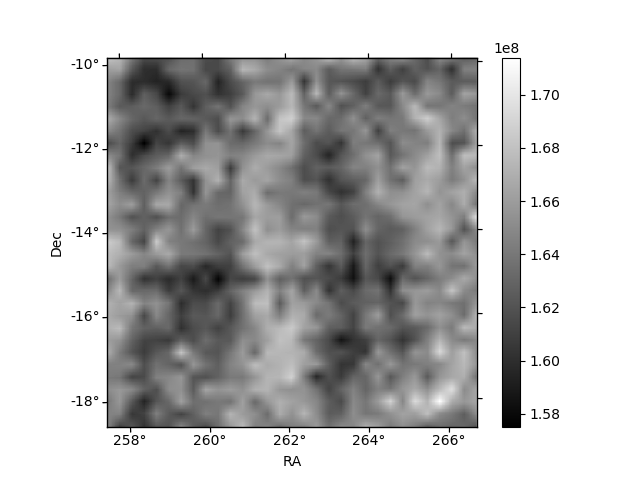
Histogram calculated using DETX and DETY for each event in the final _common_clean file
| Quadrant A | 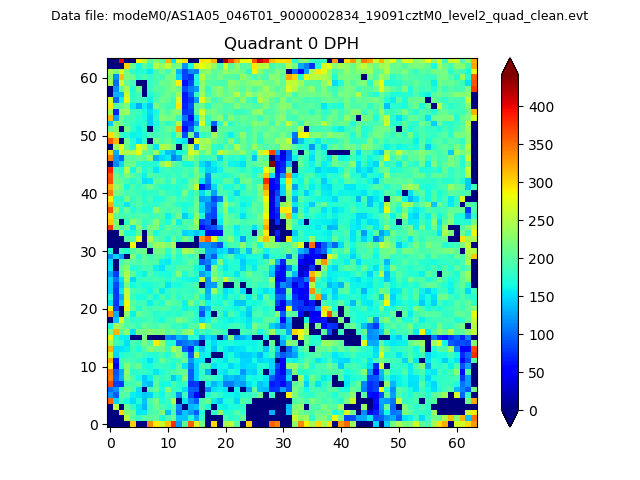 |
 |
Quadrant B |
|---|---|---|---|
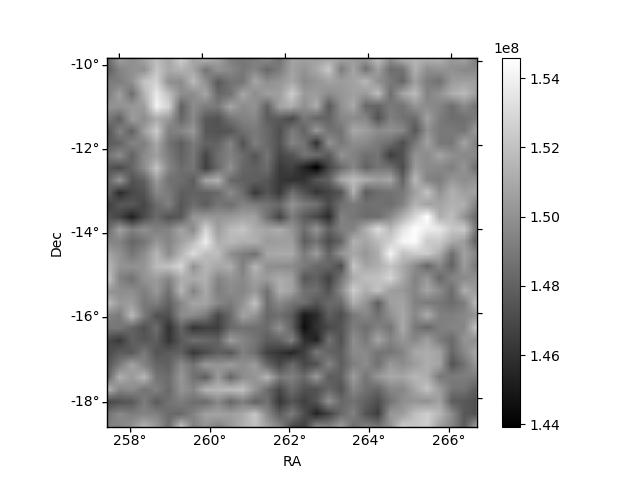
| Quadrant D | 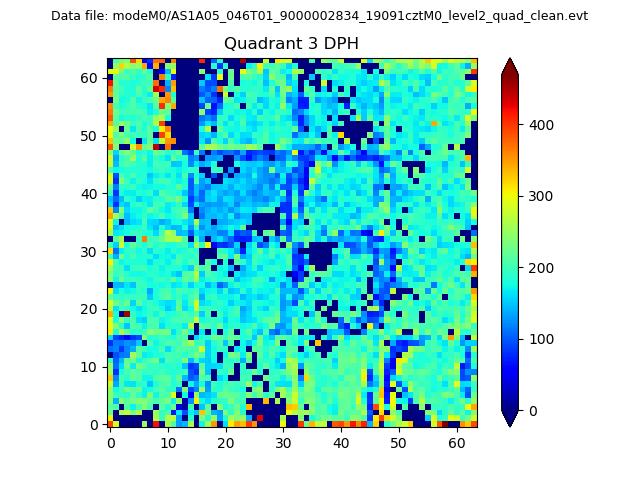 |
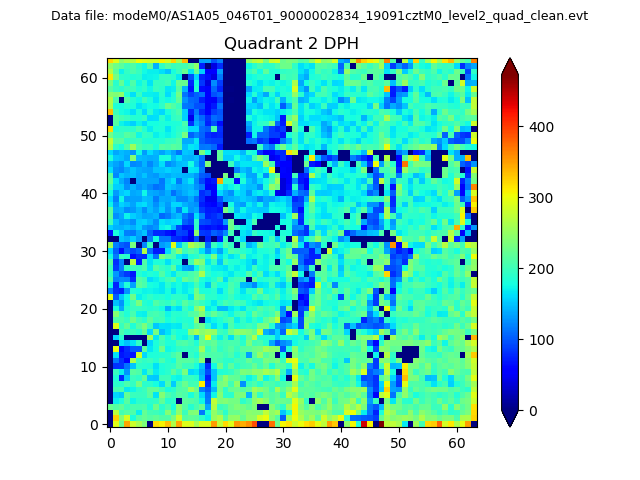 |
Quadrant C |
| Plot type | Count rate plots | Images |
|---|---|---|
| Comparison with Poisson distribution Blue bars denote a histogram of data divided into 1 sec bins. Red curve is a Poisson curve with rate = median count rate of data. |
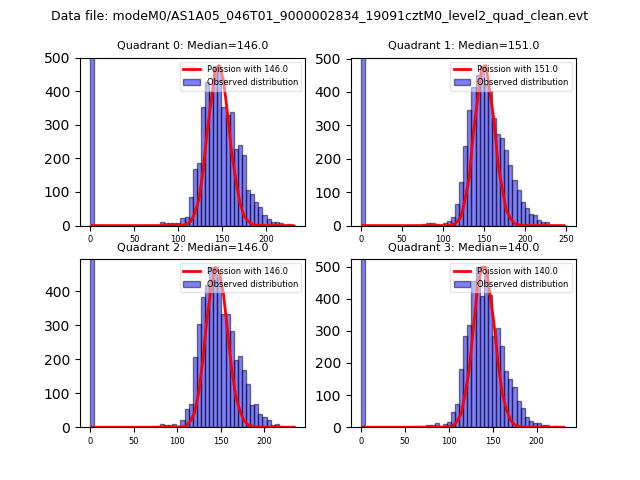 |
 |
| Quadrant-wise count rates Data is divided into 100 sec bins |
 |
|
| Module-wise count rates for Quadrant A Data is divided into 100 sec bins |
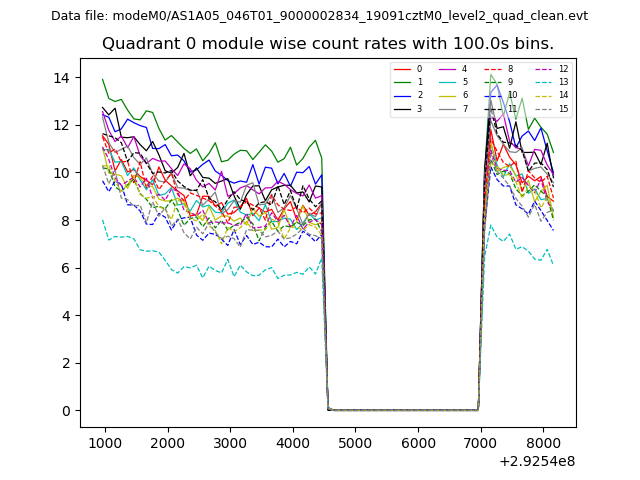 |
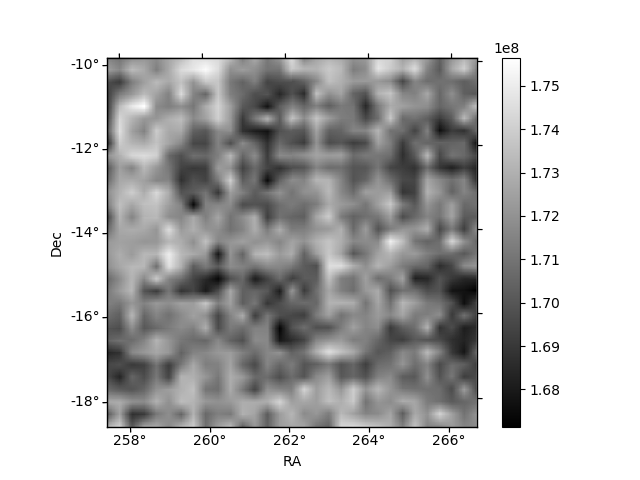 |
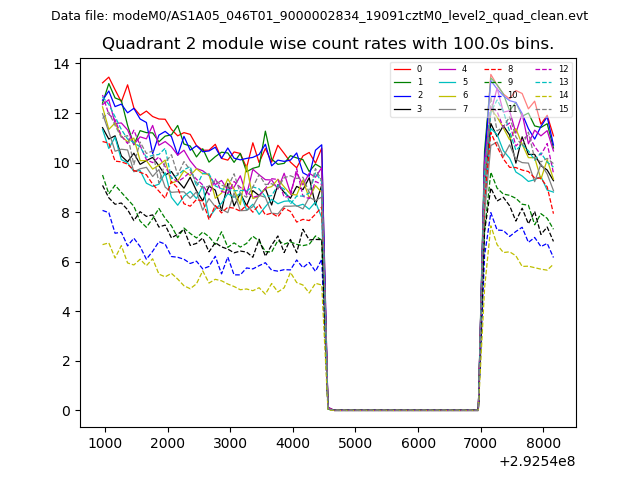
| Module-wise count rates for Quadrant B Data is divided into 100 sec bins |
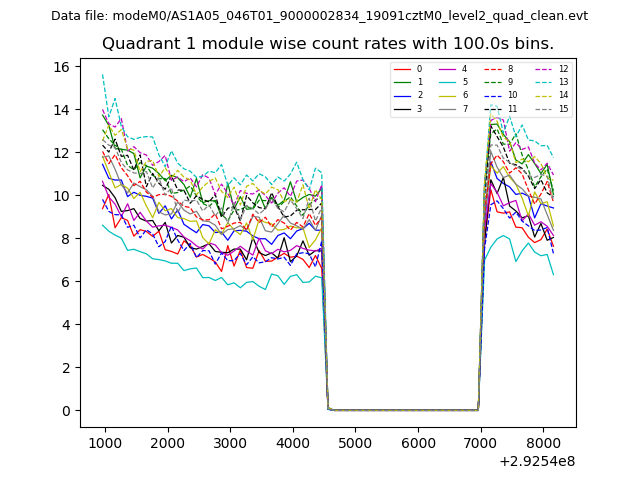 |
 |
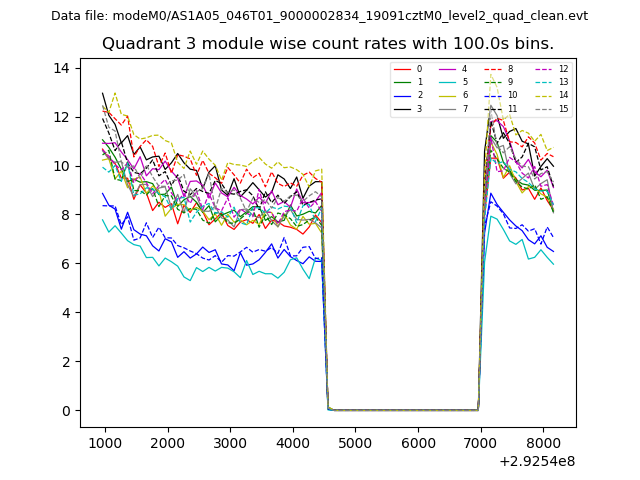
| Module-wise count rates for Quadrant C Data is divided into 100 sec bins |
 |
 |
| Module-wise count rates for Quadrant D Data is divided into 100 sec bins |
 |
 |
| Parameter | Plot |
|---|---|
| CZT HV Monitor | 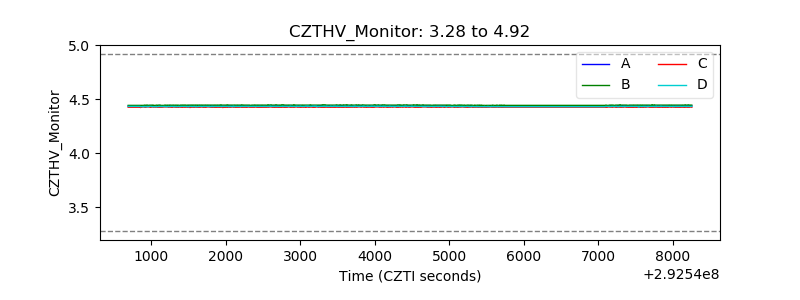 |
| D_VDD | 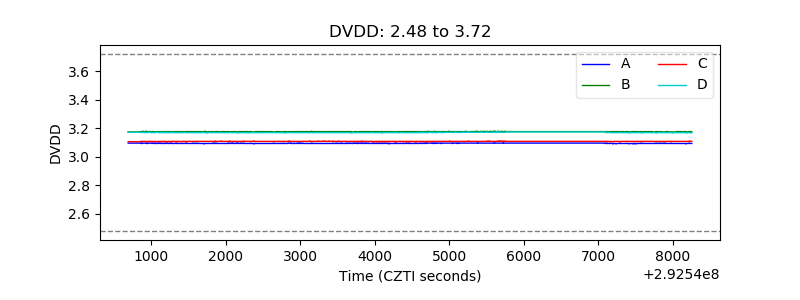 |
| Temperature 1 | 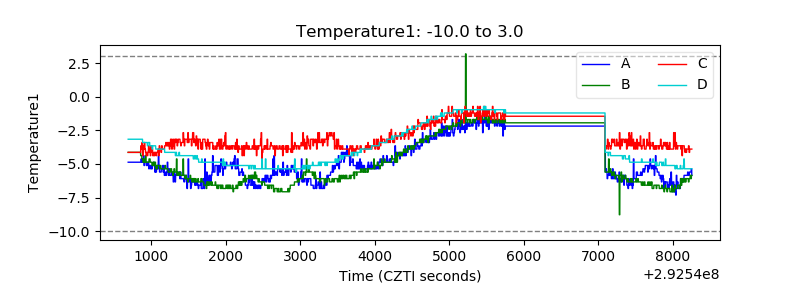 |
| Veto HV Monitor | 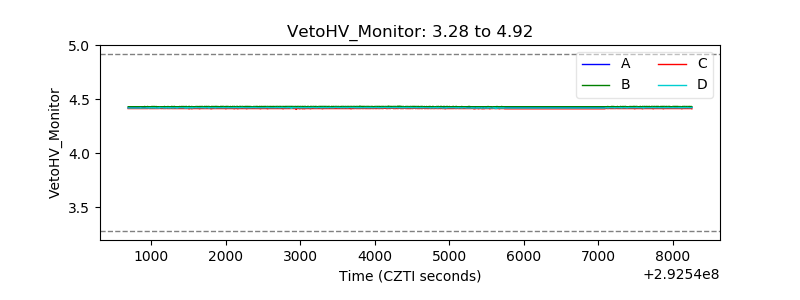 |
| Veto LLD | 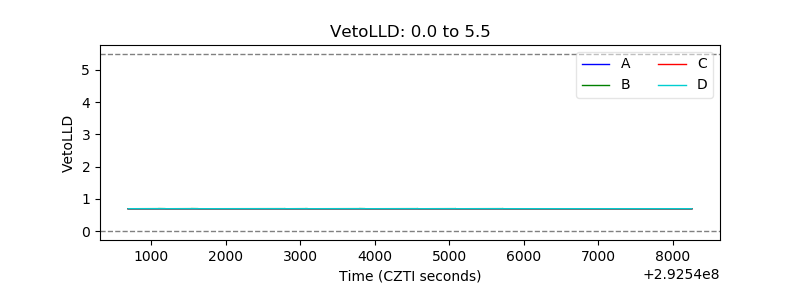 |
| Alpha Counter | 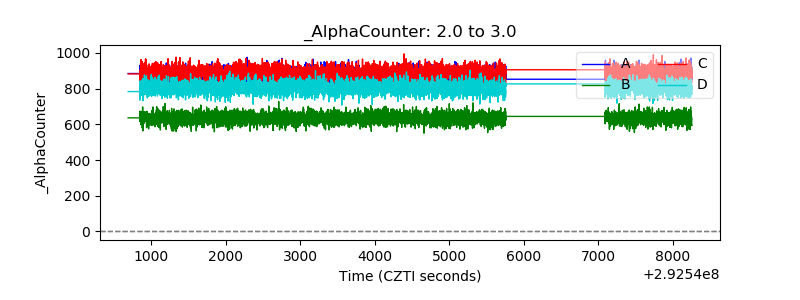 |
| _CPM_Rate | 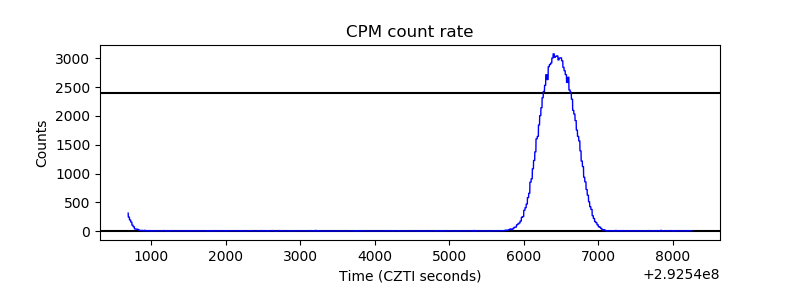 |
| CZT Counter |  |
| +2.5 Volts monitor |  |
| +5 Volts monitor |  |
| _ROLL_ROT | 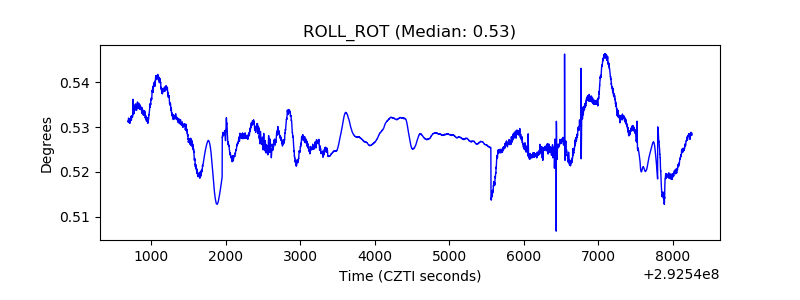 |
| _Roll_DEC | 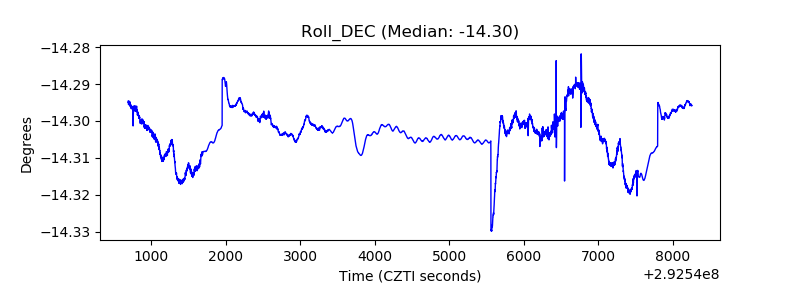 |
| _Roll_RA | 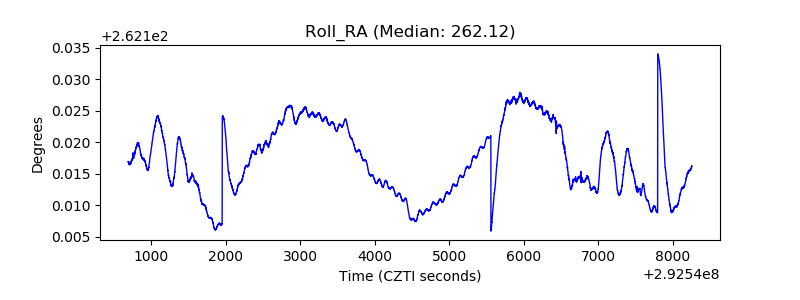 |
| Veto Counter | 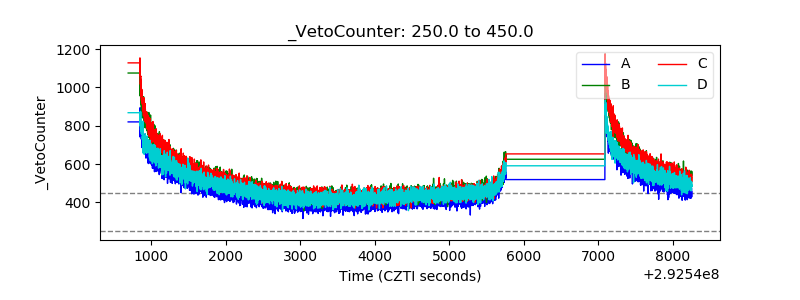 |