| Param | Original file | Final file |
|---|---|---|
| Filename | modeM0/AS1A05_046T01_9000002834_19092cztM0_level2.evt | modeM0/AS1A05_046T01_9000002834_19092cztM0_level2_quad_clean.evt |
| Size (bytes) | 462,142,080 | 105,940,800 |
| Size | 440.7 MB | 101.0 MB |
| Events in quadrant A | 3,150,229 | 692,513 |
| Events in quadrant B | 3,616,214 | 721,285 |
| Events in quadrant C | 3,479,816 | 693,379 |
| Events in quadrant D | 3,323,340 | 663,145 |
| Mode SS | |||
|---|---|---|---|
| Quadrant | BADHDUFLAG | Total packets | Discarded packets |
| A | 0 | 128 | 0 |
| B | 0 | 128 | 0 |
| C | 0 | 128 | 0 |
| D | 0 | 128 | 0 |
| Mode M0 | |||
|---|---|---|---|
| Quadrant | BADHDUFLAG | Total packets | Discarded packets |
| A | 0 | 13230 | 1 |
| B | 0 | 14621 | 1 |
| C | 0 | 14084 | 1 |
| D | 0 | 13844 | 1 |
| Mode M9 | |||
|---|---|---|---|
| Quadrant | BADHDUFLAG | Total packets | Discarded packets |
| A | 0 | 25 | 0 |
| B | 0 | 26 | 0 |
| C | 0 | 26 | 0 |
| D | 0 | 26 | 0 |
| Quadrant | Total seconds | Saturated seconds | Saturation percentage |
|---|---|---|---|
| A | 6278 | 23 | 0.366359% |
| B | 6278 | 187 | 2.978656% |
| C | 6278 | 109 | 1.736222% |
| D | 6278 | 29 | 0.461931% |
Noise dominated data is calculated using 1-second bins in cleaned event files. If a bin has >2000 counts, and if more than 50% of those come from <1% of pixels, then it is considered to be noise-dominated and hence unusable.
| Quadrant | # 1 sec bins | Bins with >0 counts | Bins with >2000 counts | High rate bins dominated by noise | Noise dominated (total time) | Noise dominated (detector-on time) | Marked lightcurve |
|---|---|---|---|---|---|---|---|
| A | 7603 | 6279 | 0 | 0 | 0.00% | 0.00% | 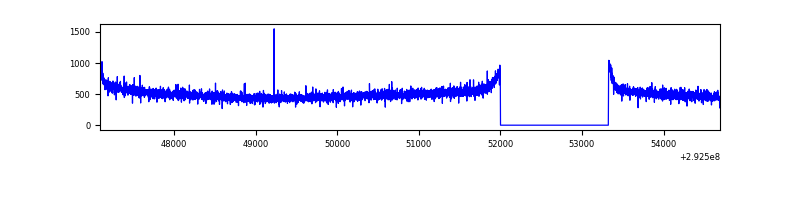 |
| B | 7603 | 6279 | 32 | 32 | 0.42% | 0.51% | 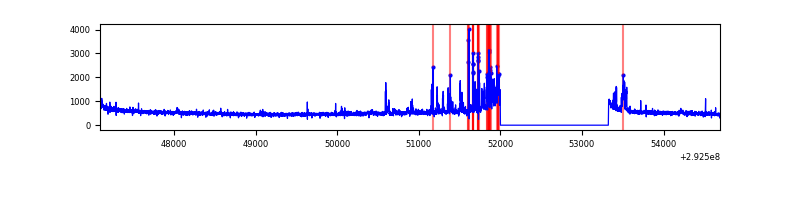 |
| C | 7603 | 6279 | 3 | 3 | 0.04% | 0.05% | 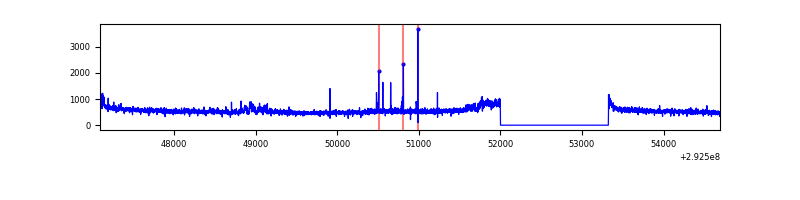 |
| D | 7603 | 6279 | 10 | 10 | 0.13% | 0.16% | 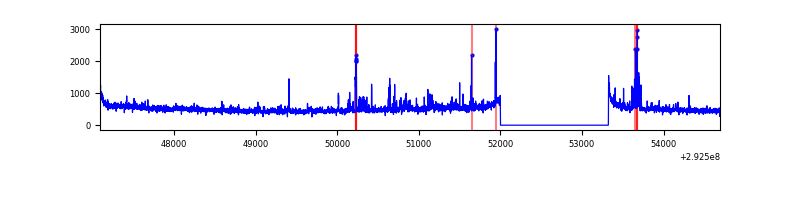 |
Top three noisy pixels from each quadrant. If the there are fewer than three noisy pixels in the level2.evt file, extra rows are filled as -1
| Pixel properties | Quadrant properties | ||||||
|---|---|---|---|---|---|---|---|
| Quadrant | DetID | PixID | Counts | Sigma | Mean | Median | Sigma |
| A | 13 | 254 | 7441 | 40.46 | 817 | 800 | 164.1 |
| A | 0 | 226 | 7093 | 38.34 | 817 | 800 | 164.1 |
| A | 3 | 137 | 5975 | 31.53 | 817 | 800 | 164.1 |
| B | 6 | 36 | 119643 | 773.35 | 820 | 802 | 153.7 |
| B | 4 | 216 | 98937 | 638.61 | 820 | 802 | 153.7 |
| B | 0 | 189 | 74485 | 479.49 | 820 | 802 | 153.7 |
| C | 3 | 233 | 201983 | 1075.19 | 802 | 812 | 187.1 |
| C | 14 | 238 | 125745 | 667.72 | 802 | 812 | 187.1 |
| C | 0 | 207 | 27588 | 143.11 | 802 | 812 | 187.1 |
| D | 1 | 52 | 169664 | 878.96 | 797 | 777 | 192.1 |
| D | 7 | 238 | 86110 | 444.11 | 797 | 777 | 192.1 |
| D | 11 | 176 | 31622 | 160.53 | 797 | 777 | 192.1 |
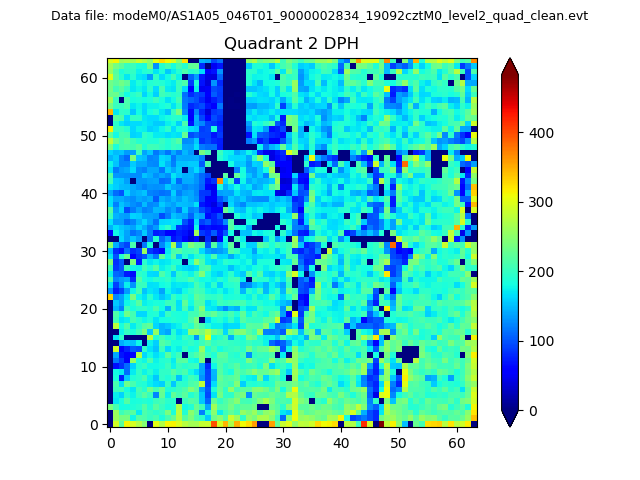
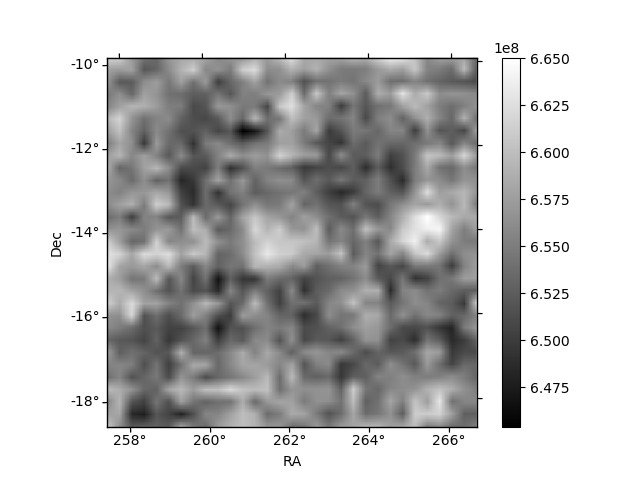
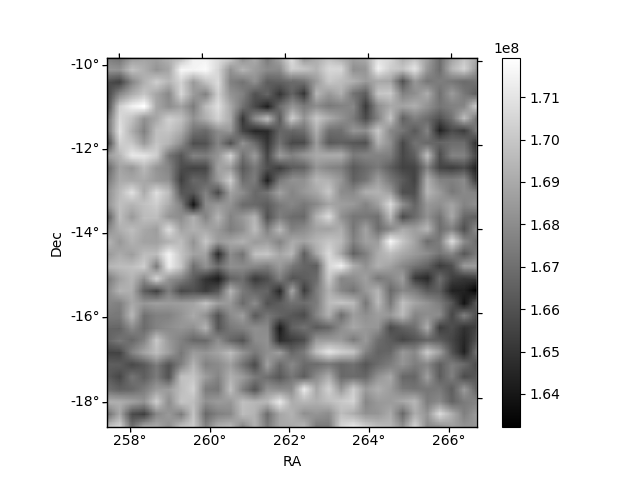
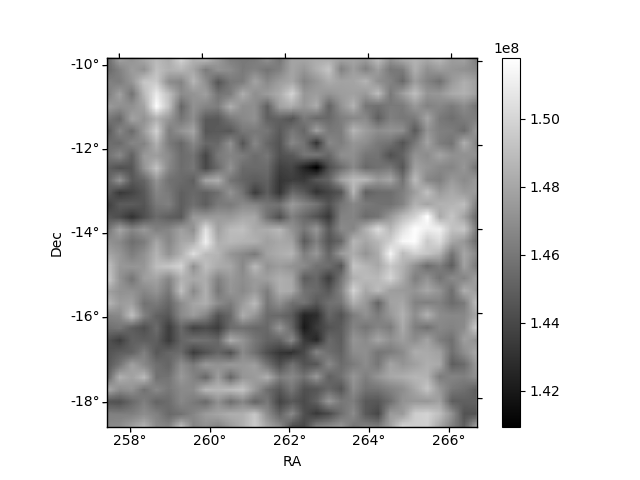
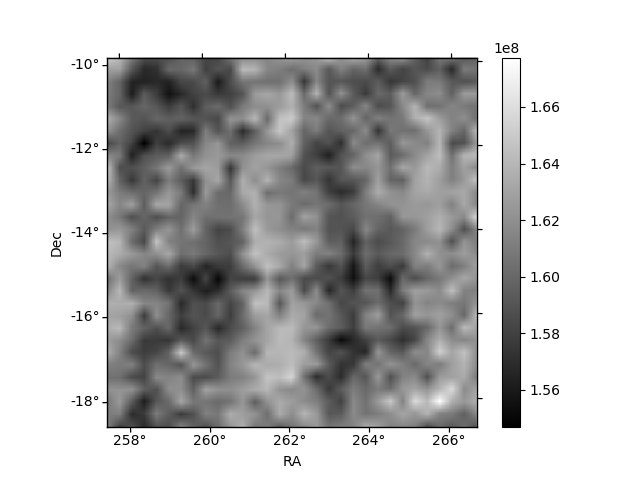
Histogram calculated using DETX and DETY for each event in the final _common_clean file
| Quadrant A | 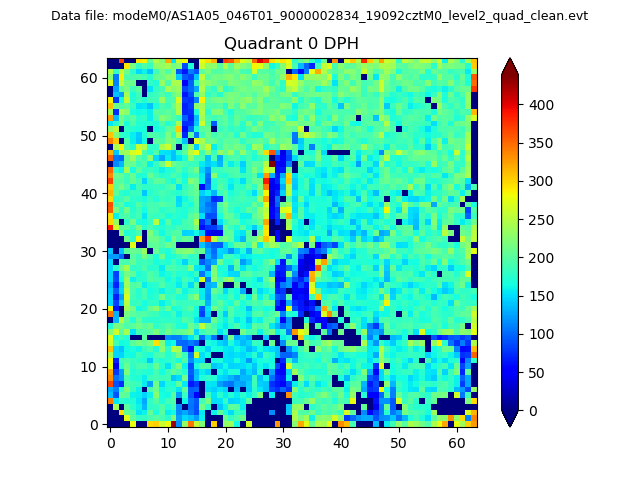 |
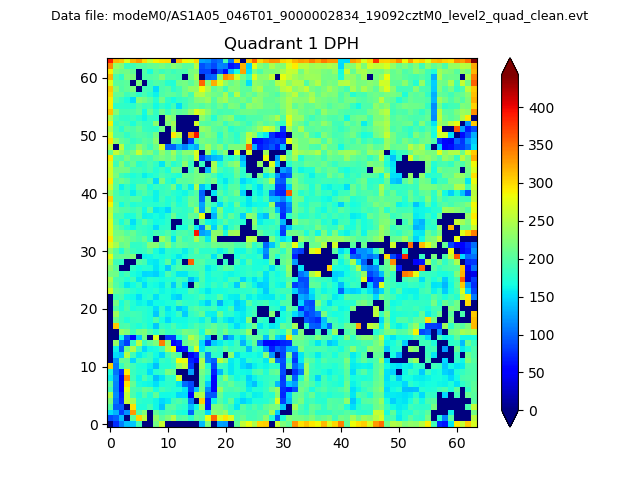 |
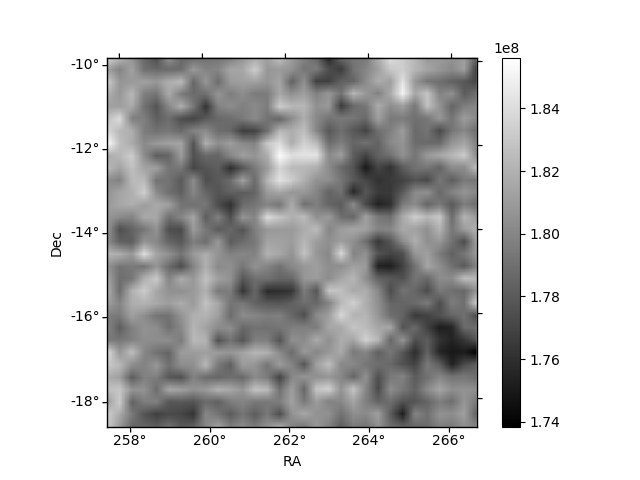
Quadrant B |
|---|---|---|---|
| Quadrant D | 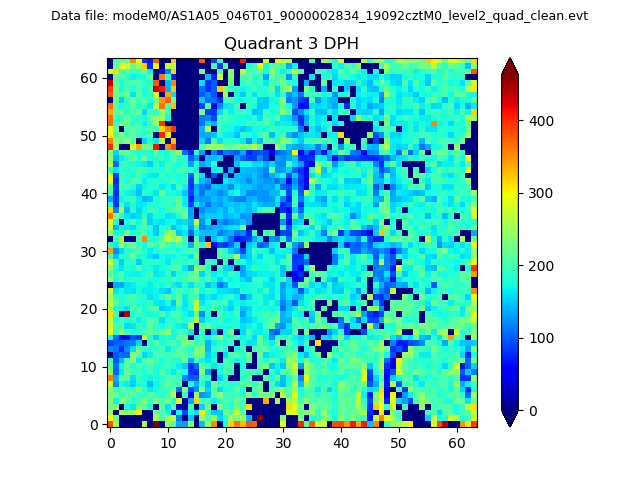 |
 |
Quadrant C |
| Plot type | Count rate plots | Images |
|---|---|---|
| Comparison with Poisson distribution Blue bars denote a histogram of data divided into 1 sec bins. Red curve is a Poisson curve with rate = median count rate of data. |
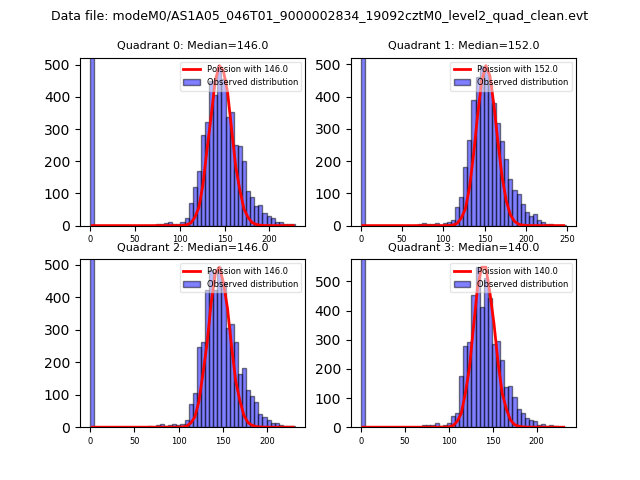 |
 |
| Quadrant-wise count rates Data is divided into 100 sec bins |
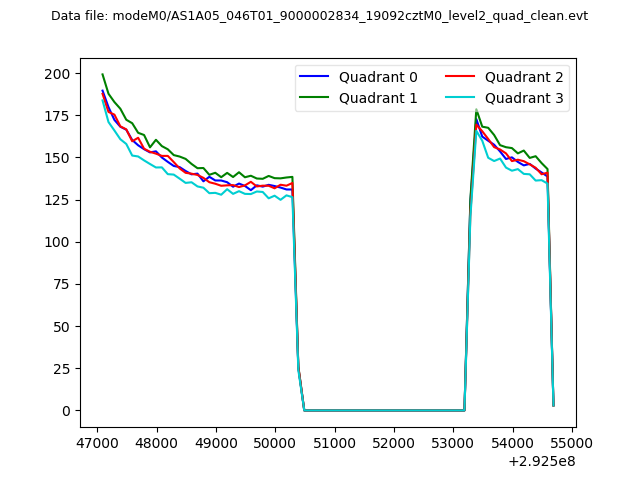 |
|
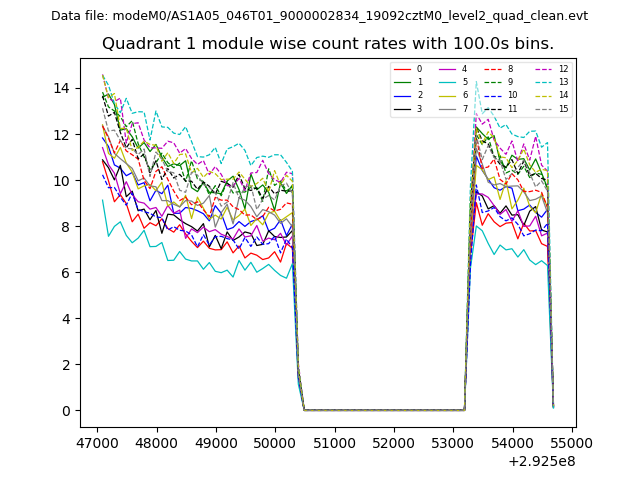
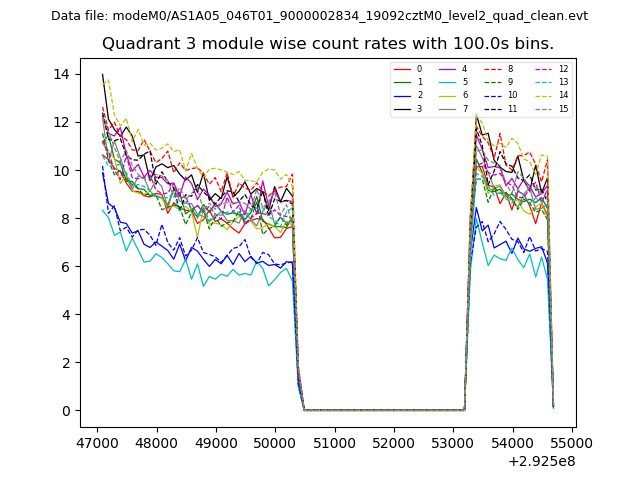
| Module-wise count rates for Quadrant A Data is divided into 100 sec bins |
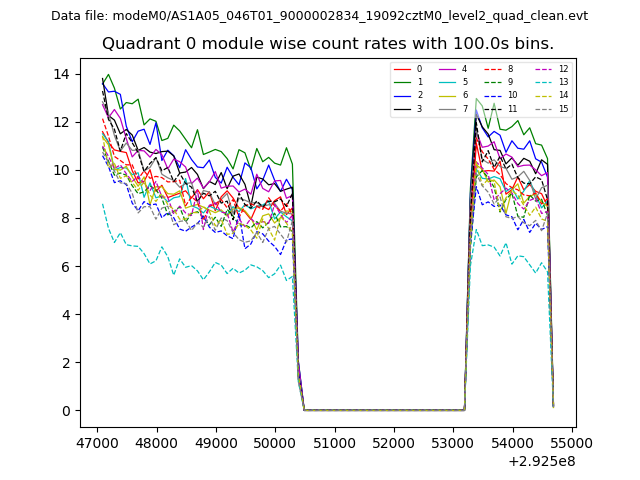 |
 |
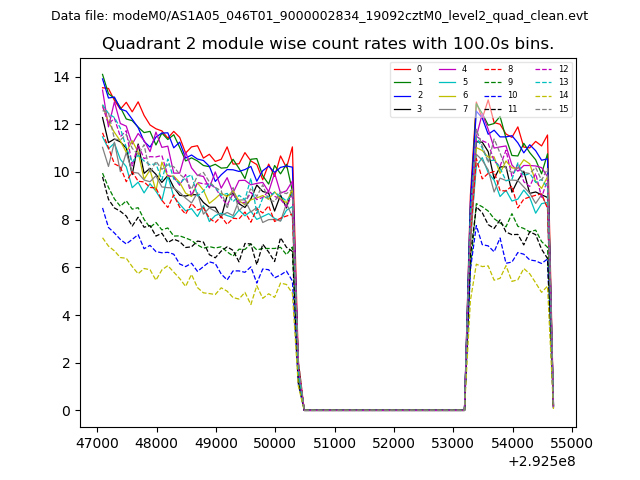
| Module-wise count rates for Quadrant B Data is divided into 100 sec bins |
 |
 |
| Module-wise count rates for Quadrant C Data is divided into 100 sec bins |
 |
 |
| Module-wise count rates for Quadrant D Data is divided into 100 sec bins |
 |
 |
| Parameter | Plot |
|---|---|
| CZT HV Monitor | 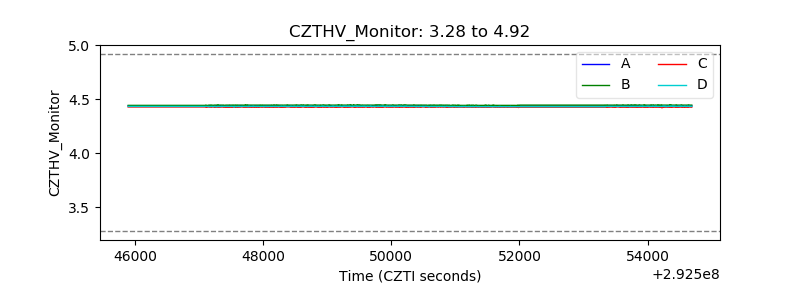 |
| D_VDD | 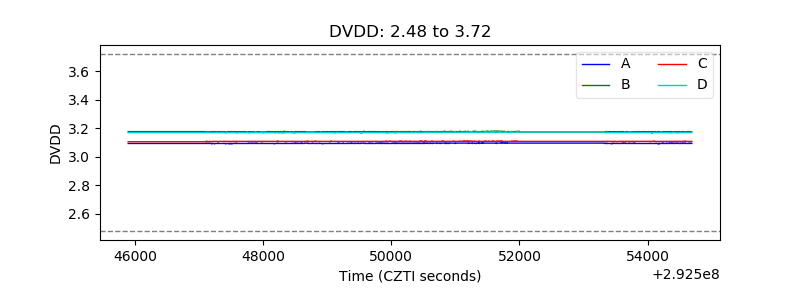 |
| Temperature 1 |  |
| Veto HV Monitor | 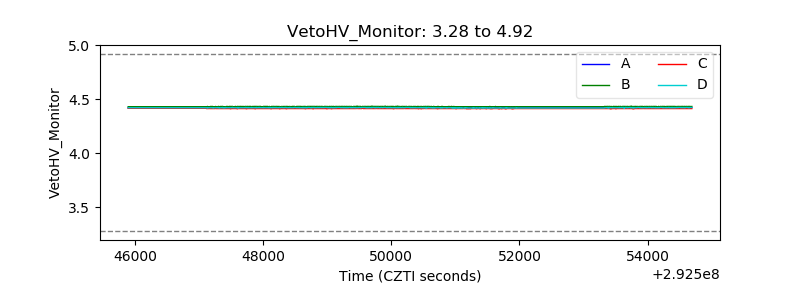 |
| Veto LLD | 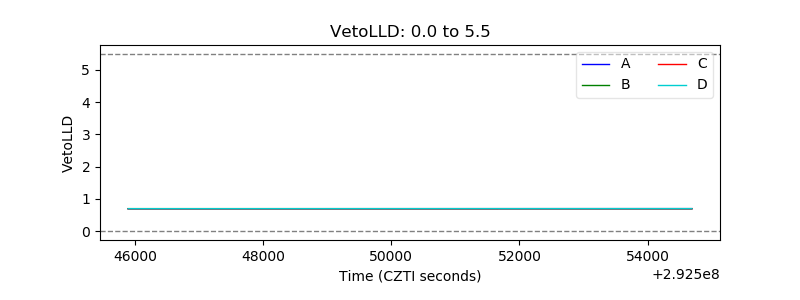 |
| Alpha Counter | 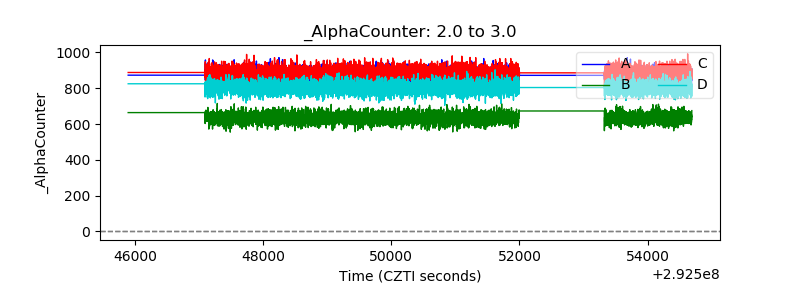 |
| _CPM_Rate | 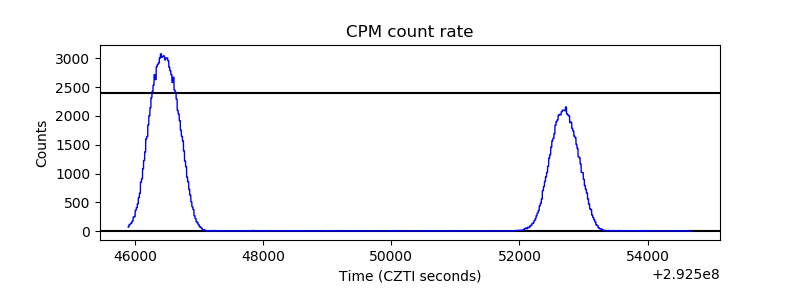 |
| CZT Counter | 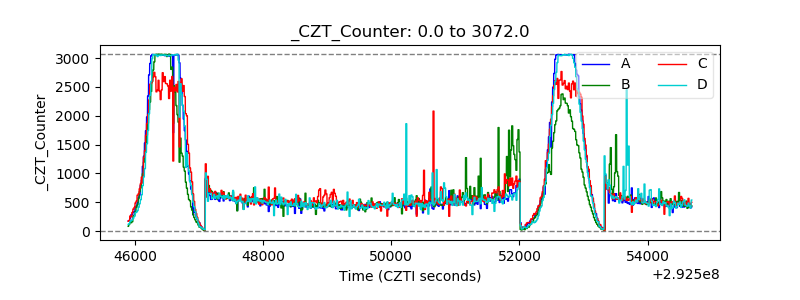 |
| +2.5 Volts monitor |  |
| +5 Volts monitor | 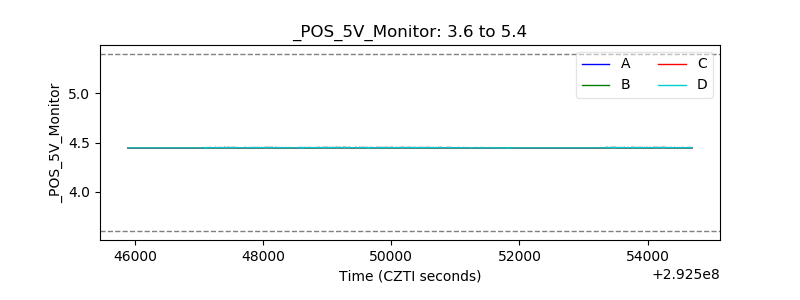 |
| _ROLL_ROT | 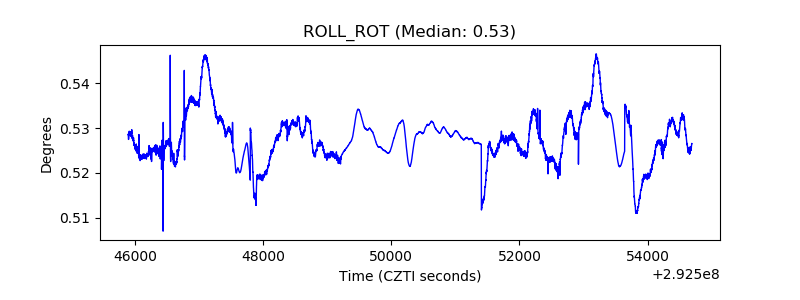 |
| _Roll_DEC | 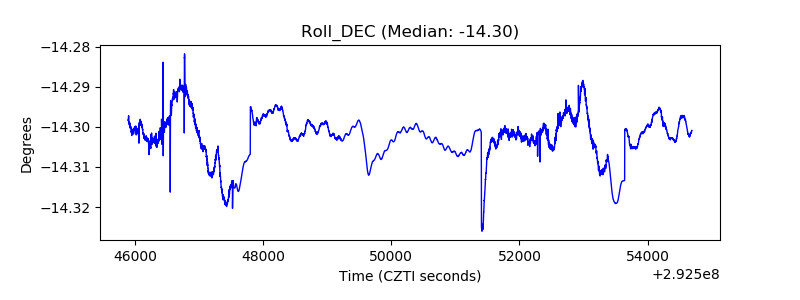 |
| _Roll_RA | 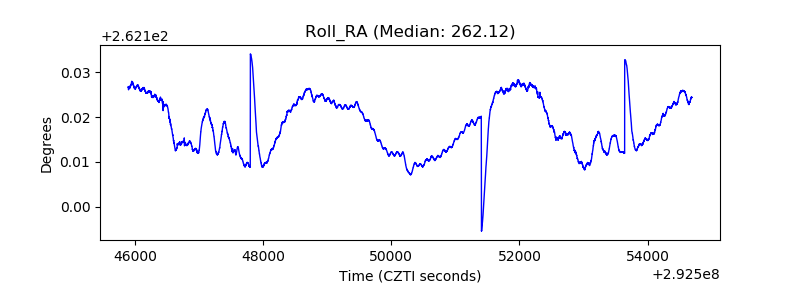 |
| Veto Counter | 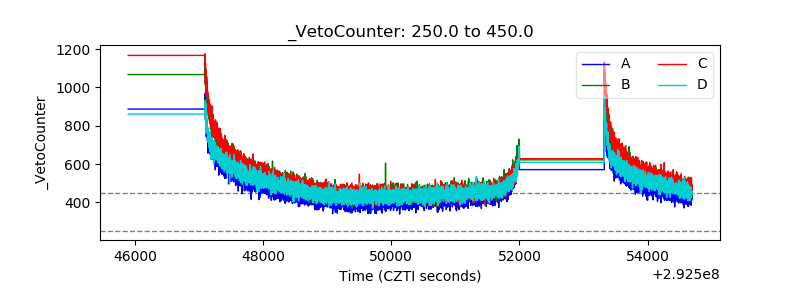 |