| Param | Original file | Final file |
|---|---|---|
| Filename | modeM0/AS1T03_098T01_9000002836cztM0_level2.fits | modeM0/AS1T03_098T01_9000002836cztM0_level2_quad_clean.evt |
| Size (bytes) | 1,133,426,880 | 1,158,022,080 |
| Size | 1.1 GB | 1.1 GB |
| Events in quadrant A | 6,929,360 | 6,994,855 |
| Events in quadrant B | 6,643,468 | 7,013,614 |
| Events in quadrant C | 6,867,468 | 6,834,739 |
| Events in quadrant D | 5,699,696 | 6,048,834 |
| Mode M9 | |||
|---|---|---|---|
| Quadrant | BADHDUFLAG | Total packets | Discarded packets |
| A | 0 | 169 | 0 |
| B | 0 | 169 | 0 |
| C | 0 | 169 | 0 |
| D | 0 | 169 | 0 |
| Mode M0 | |||
|---|---|---|---|
| Quadrant | BADHDUFLAG | Total packets | Discarded packets |
| A | 0 | 246875 | 0 |
| B | 0 | 269083 | 0 |
| C | 0 | 255523 | 0 |
| D | 0 | 365021 | 0 |
| Mode SS | |||
|---|---|---|---|
| Quadrant | BADHDUFLAG | Total packets | Discarded packets |
| A | 0 | 2428 | 0 |
| B | 0 | 2428 | 0 |
| C | 0 | 2428 | 0 |
| D | 0 | 2428 | 0 |
| Quadrant | Total seconds | Saturated seconds | Saturation percentage |
|---|---|---|---|
| A | 119384 | 1458 | 1.221269% |
| B | 119384 | 3109 | 2.604202% |
| C | 119384 | 2249 | 1.883837% |
| D | 119384 | 10341 | 8.661965% |
Noise dominated data is calculated using 1-second bins in cleaned event files. If a bin has >2000 counts, and if more than 50% of those come from <1% of pixels, then it is considered to be noise-dominated and hence unusable.
| Quadrant | # 1 sec bins | Bins with >0 counts | Bins with >2000 counts | High rate bins dominated by noise | Noise dominated (total time) | Noise dominated (detector-on time) | Marked lightcurve |
|---|---|---|---|---|---|---|---|
| A | 136240 | 119381 | 0 | 0 | 0.00% | 0.00% |  |
| B | 136240 | 119373 | 0 | 0 | 0.00% | 0.00% | 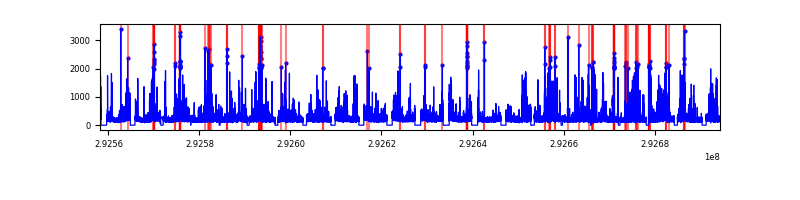 |
| C | 136240 | 119377 | 0 | 0 | 0.00% | 0.00% | 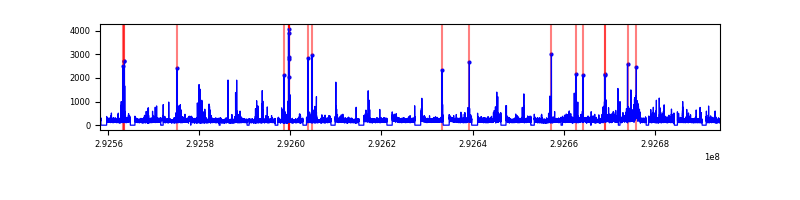 |
| D | 136240 | 119158 | 0 | 0 | 0.00% | 0.00% |  |
Top three noisy pixels from each quadrant. If the there are fewer than three noisy pixels in the level2.evt file, extra rows are filled as -1
| Pixel properties | Quadrant properties | ||||||
|---|---|---|---|---|---|---|---|
| Quadrant | DetID | PixID | Counts | Sigma | Mean | Median | Sigma |
| A | 0 | 29 | 6736 | 11.51 | 1800 | 1685 | 439.0 |
| A | 7 | 110 | 5574 | 8.86 | 1800 | 1685 | 439.0 |
| A | 0 | 30 | 5193 | 7.99 | 1800 | 1685 | 439.0 |
| B | 2 | 9 | 5619 | 11.47 | 1757 | 1671 | 344.2 |
| B | 2 | 8 | 4572 | 8.43 | 1757 | 1671 | 344.2 |
| B | 5 | 128 | 4346 | 7.77 | 1757 | 1671 | 344.2 |
| C | 1 | 80 | 5370 | 7.98 | 1811 | 1692 | 460.9 |
| C | 1 | 81 | 5286 | 7.8 | 1811 | 1692 | 460.9 |
| C | 12 | 241 | 4749 | 6.63 | 1811 | 1692 | 460.9 |
| D | 10 | 190 | 4413 | 6.77 | 1628 | 1482 | 432.7 |
| D | 3 | 14 | 4125 | 6.11 | 1628 | 1482 | 432.7 |
| D | 10 | 189 | 4077 | 6.0 | 1628 | 1482 | 432.7 |
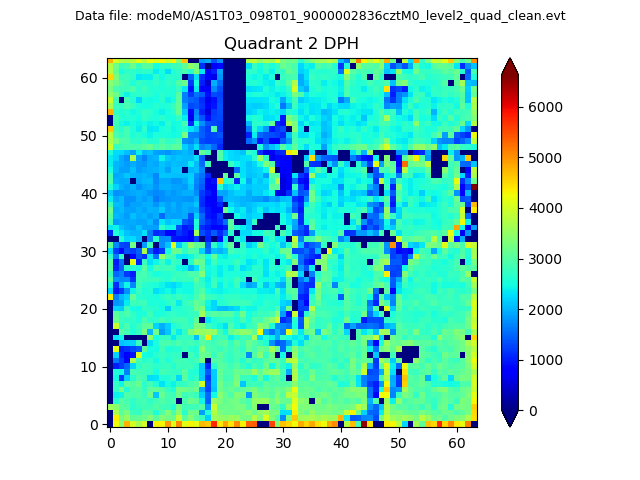
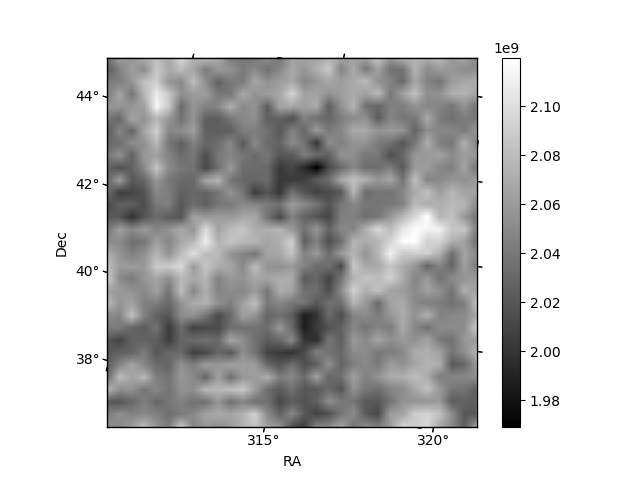
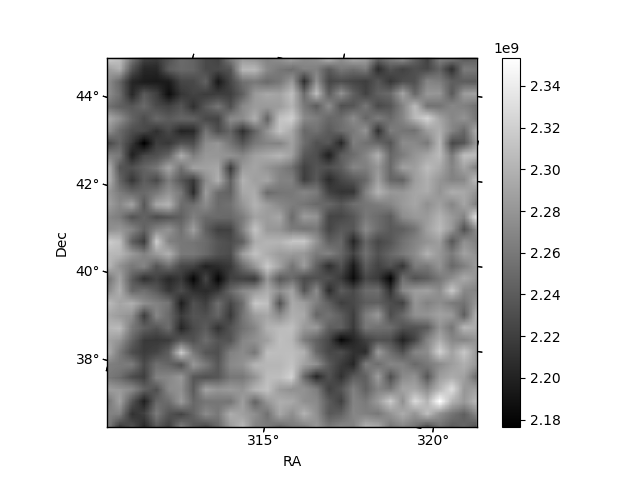
Histogram calculated using DETX and DETY for each event in the final _common_clean file
| Quadrant A | 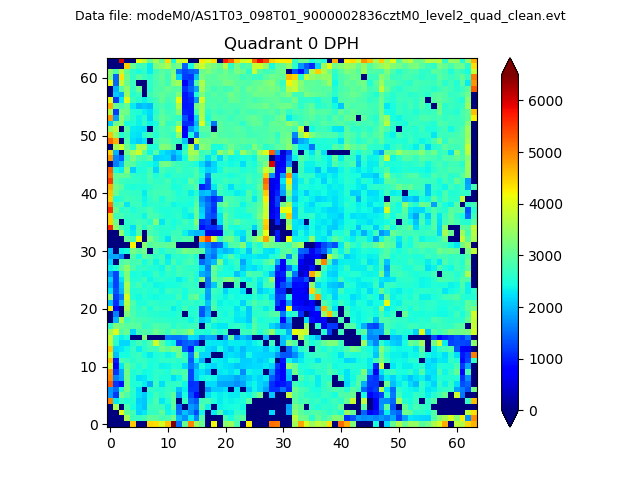 |
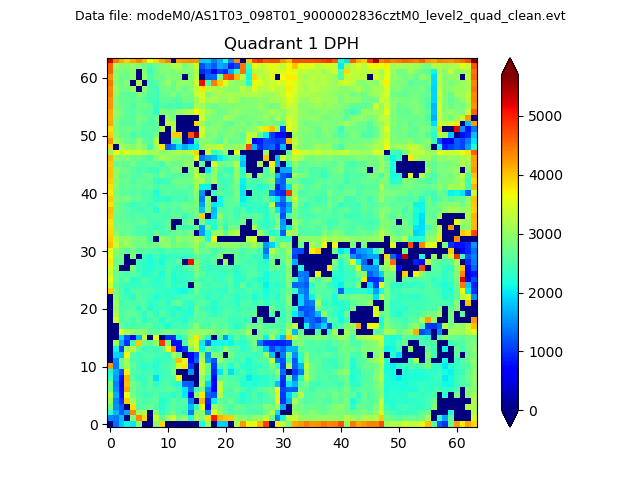 |
Quadrant B |
|---|---|---|---|
| Quadrant D | 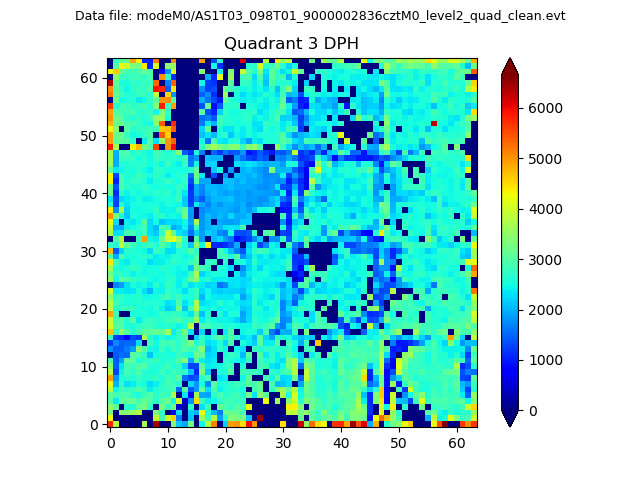 |
 |
Quadrant C |
| Plot type | Count rate plots | Images |
|---|---|---|
| Comparison with Poisson distribution Blue bars denote a histogram of data divided into 1 sec bins. Red curve is a Poisson curve with rate = median count rate of data. |
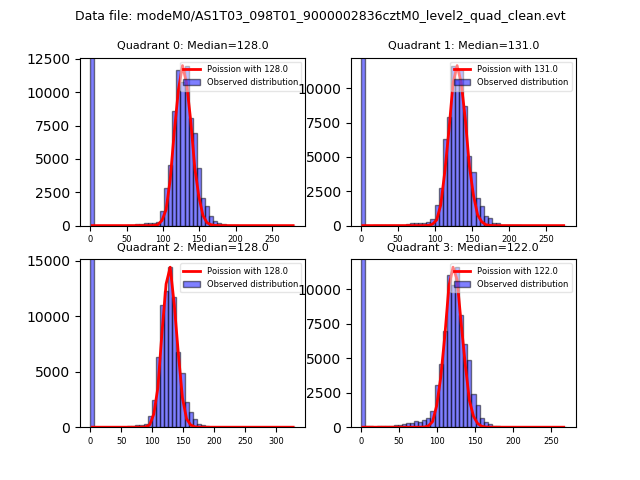 |
 |
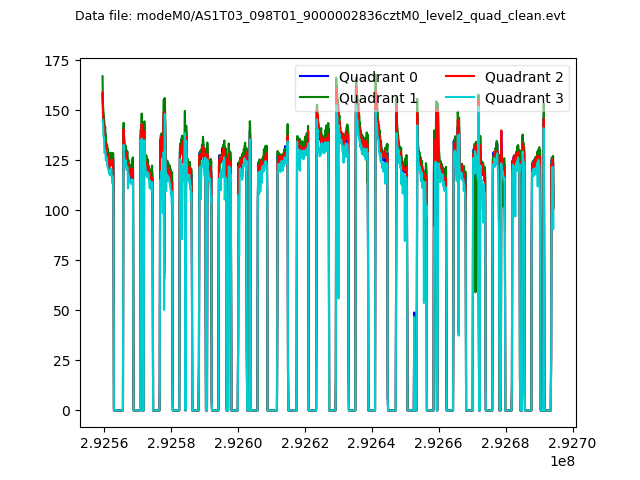
| Quadrant-wise count rates Data is divided into 100 sec bins |
 |
|
| Module-wise count rates for Quadrant A Data is divided into 100 sec bins |
 |
 |
| Module-wise count rates for Quadrant B Data is divided into 100 sec bins |
 |
 |
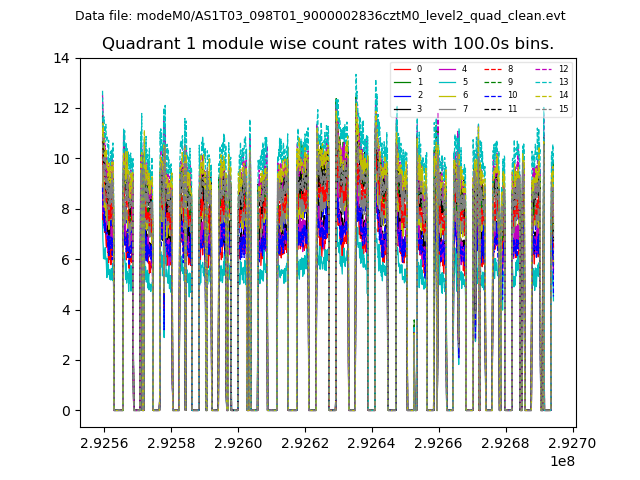
| Module-wise count rates for Quadrant C Data is divided into 100 sec bins |
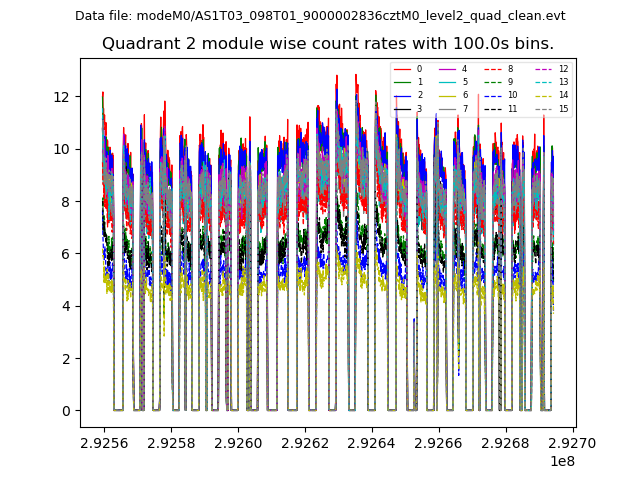 |
 |
| Module-wise count rates for Quadrant D Data is divided into 100 sec bins |
 |
 |
| Parameter | Plot |
|---|---|
| CZT HV Monitor | 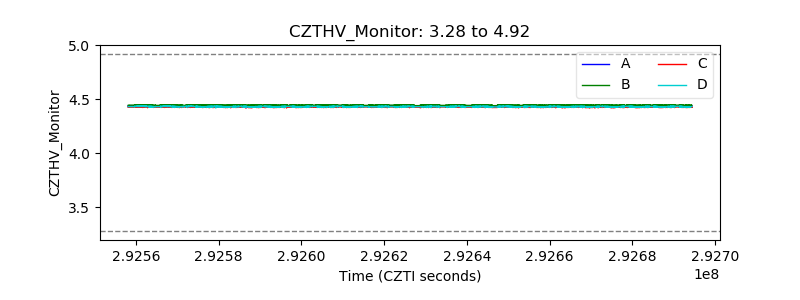 |
| D_VDD | 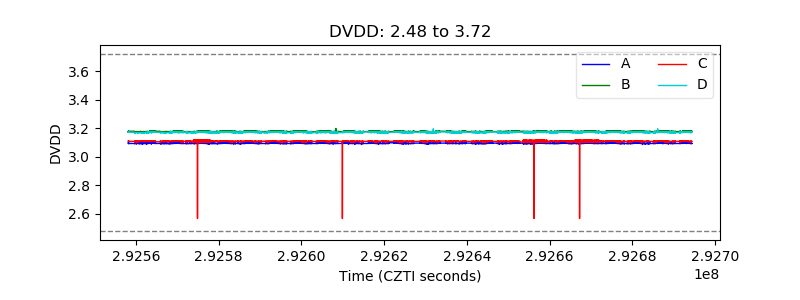 |
| Temperature 1 |  |
| Veto HV Monitor | 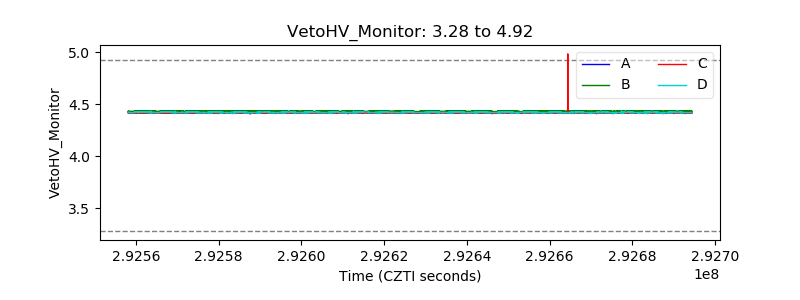 |
| Veto LLD | 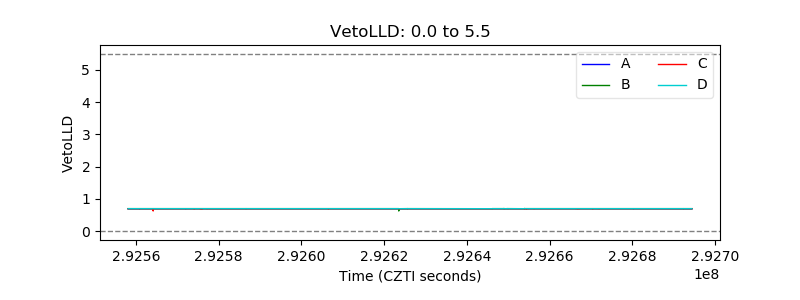 |
| Alpha Counter | 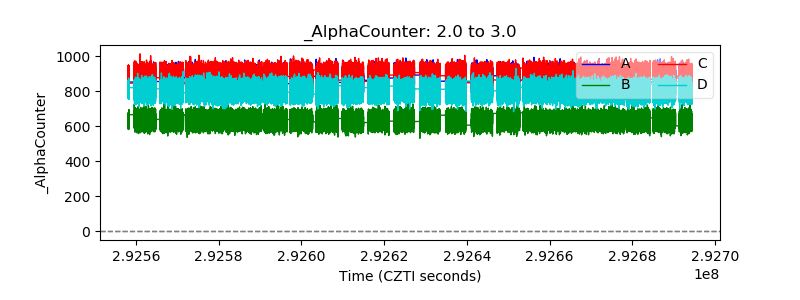 |
| _CPM_Rate | 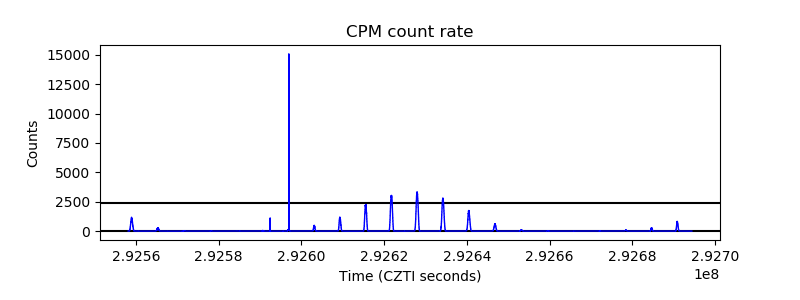 |
| CZT Counter | 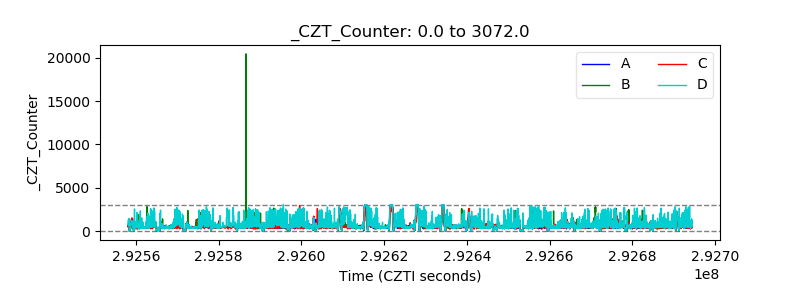 |
| +2.5 Volts monitor |  |
| +5 Volts monitor | 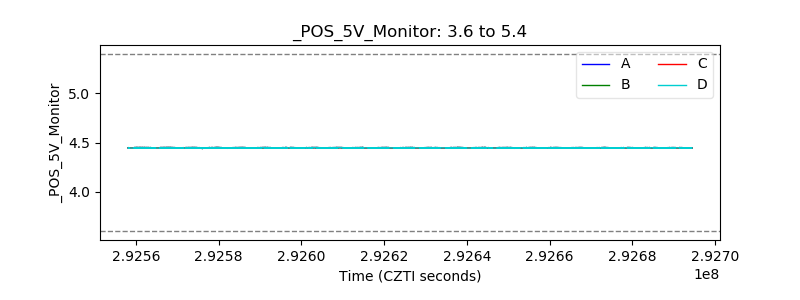 |
| _ROLL_ROT | 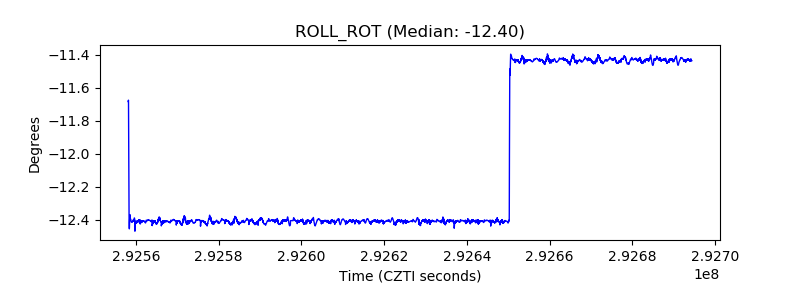 |
| _Roll_DEC | 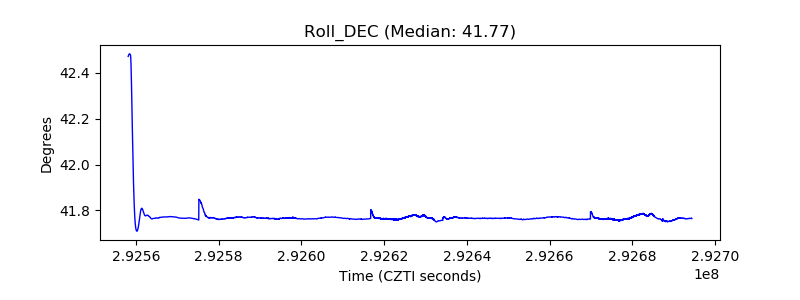 |
| _Roll_RA | 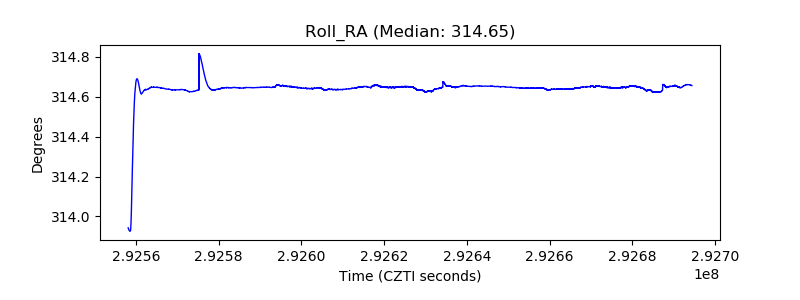 |
| Veto Counter | 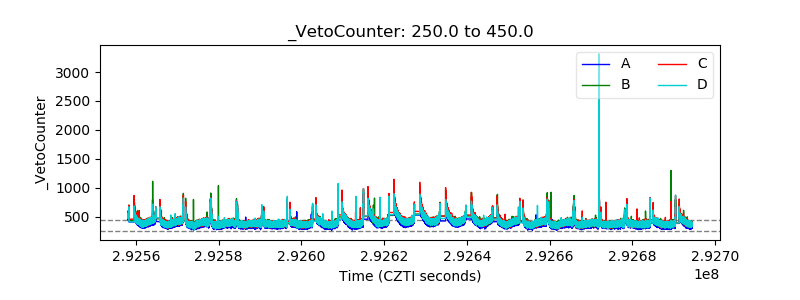 |