| Param | Original file | Final file |
|---|---|---|
| Filename | modeM0/AS1T03_098T01_9000002836_19093cztM0_level2.evt | modeM0/AS1T03_098T01_9000002836_19093cztM0_level2_quad_clean.evt |
| Size (bytes) | 116,925,120 | 27,809,280 |
| Size | 111.5 MB | 26.5 MB |
| Events in quadrant A | 753,582 | 184,095 |
| Events in quadrant B | 867,014 | 189,399 |
| Events in quadrant C | 795,381 | 182,605 |
| Events in quadrant D | 1,020,438 | 174,370 |
| Mode M9 | |||
|---|---|---|---|
| Quadrant | BADHDUFLAG | Total packets | Discarded packets |
| A | 0 | 13 | 0 |
| B | 0 | 13 | 0 |
| C | 0 | 13 | 0 |
| D | 0 | 13 | 0 |
| Mode M0 | |||
|---|---|---|---|
| Quadrant | BADHDUFLAG | Total packets | Discarded packets |
| A | 0 | 3234 | 1 |
| B | 0 | 3491 | 1 |
| C | 0 | 3304 | 1 |
| D | 0 | 4053 | 1 |
| Mode SS | |||
|---|---|---|---|
| Quadrant | BADHDUFLAG | Total packets | Discarded packets |
| A | 0 | 32 | 0 |
| B | 0 | 32 | 0 |
| C | 0 | 32 | 0 |
| D | 0 | 32 | 0 |
| Quadrant | Total seconds | Saturated seconds | Saturation percentage |
|---|---|---|---|
| A | 1501 | 9 | 0.599600% |
| B | 1501 | 51 | 3.397735% |
| C | 1501 | 47 | 3.131246% |
| D | 1501 | 49 | 3.264490% |
Noise dominated data is calculated using 1-second bins in cleaned event files. If a bin has >2000 counts, and if more than 50% of those come from <1% of pixels, then it is considered to be noise-dominated and hence unusable.
| Quadrant | # 1 sec bins | Bins with >0 counts | Bins with >2000 counts | High rate bins dominated by noise | Noise dominated (total time) | Noise dominated (detector-on time) | Marked lightcurve |
|---|---|---|---|---|---|---|---|
| A | 2766 | 1502 | 0 | 0 | 0.00% | 0.00% | 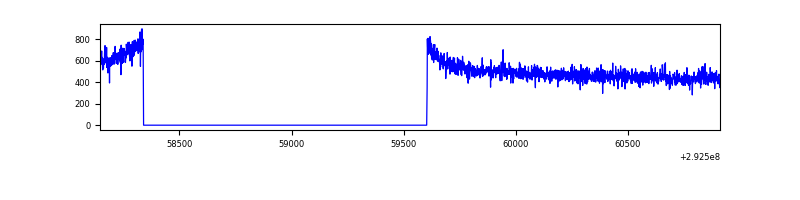 |
| B | 2766 | 1502 | 5 | 5 | 0.18% | 0.33% | 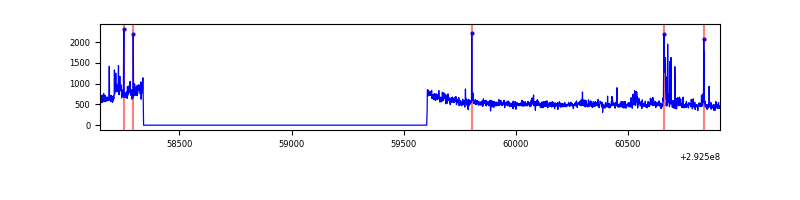 |
| C | 2766 | 1502 | 0 | 0 | 0.00% | 0.00% | 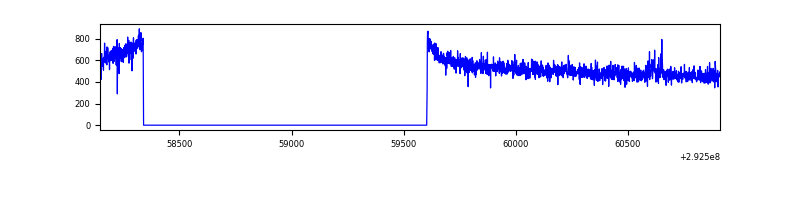 |
| D | 2766 | 1502 | 13 | 13 | 0.47% | 0.87% | 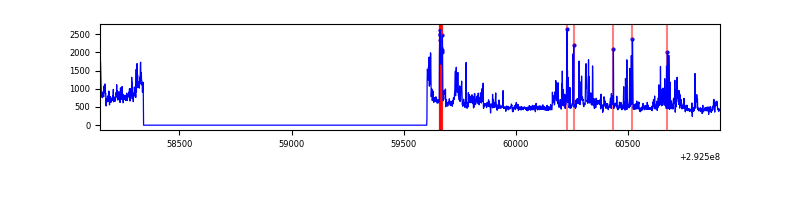 |
Top three noisy pixels from each quadrant. If the there are fewer than three noisy pixels in the level2.evt file, extra rows are filled as -1
| Pixel properties | Quadrant properties | ||||||
|---|---|---|---|---|---|---|---|
| Quadrant | DetID | PixID | Counts | Sigma | Mean | Median | Sigma |
| A | 13 | 254 | 1750 | 37.24 | 195 | 191 | 41.9 |
| A | 0 | 226 | 1685 | 35.69 | 195 | 191 | 41.9 |
| A | 12 | 194 | 1461 | 30.34 | 195 | 191 | 41.9 |
| B | 3 | 112 | 62340 | 1573.97 | 199 | 194 | 39.5 |
| B | 0 | 189 | 5729 | 140.18 | 199 | 194 | 39.5 |
| B | 10 | 245 | 4845 | 117.8 | 199 | 194 | 39.5 |
| C | 14 | 238 | 30364 | 647.11 | 193 | 194 | 46.6 |
| C | 7 | 220 | 4648 | 95.53 | 193 | 194 | 46.6 |
| C | 5 | 112 | 3323 | 67.11 | 193 | 194 | 46.6 |
| D | 7 | 238 | 144086 | 2988.3 | 190 | 183 | 48.2 |
| D | 1 | 52 | 106034 | 2198.11 | 190 | 183 | 48.2 |
| D | 11 | 176 | 40401 | 835.17 | 190 | 183 | 48.2 |
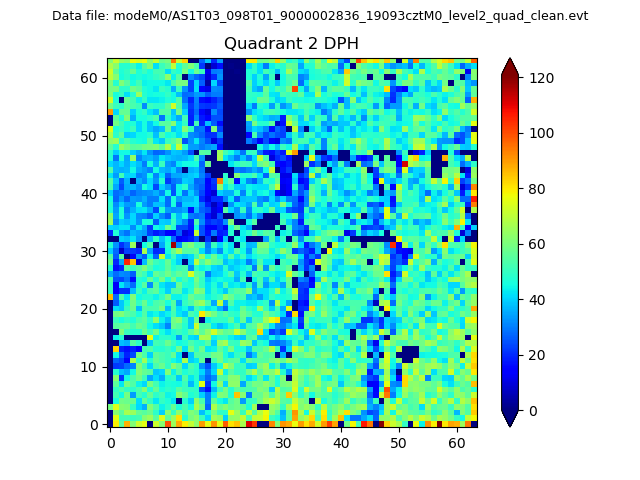
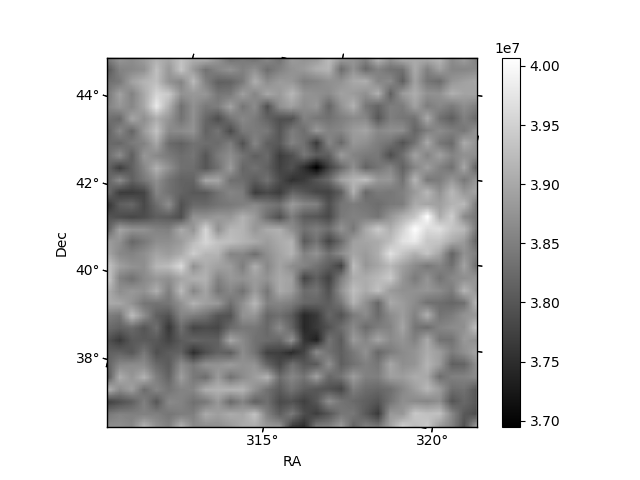
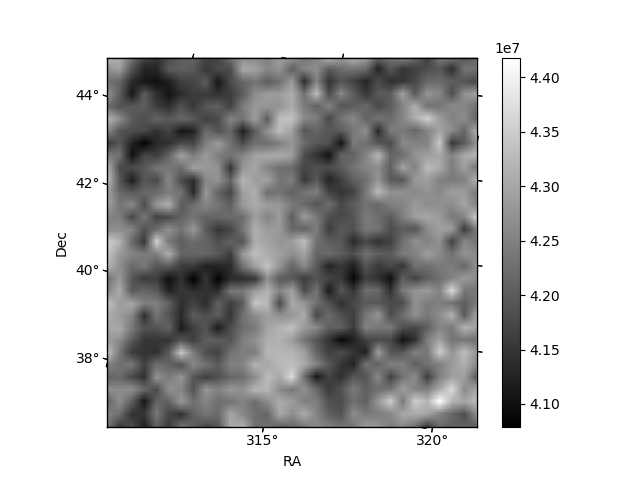
Histogram calculated using DETX and DETY for each event in the final _common_clean file
| Quadrant A | 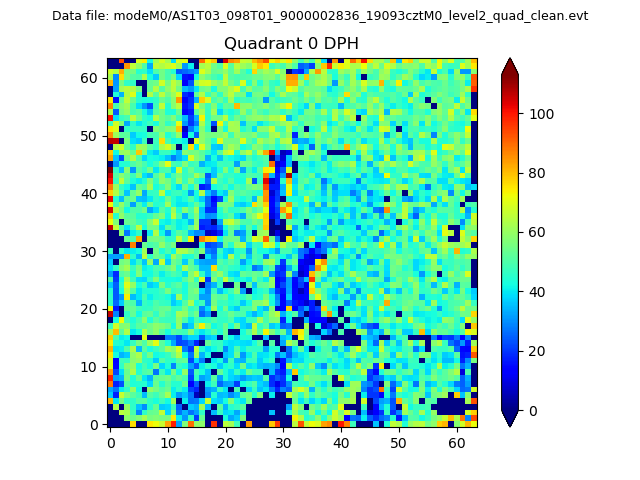 |
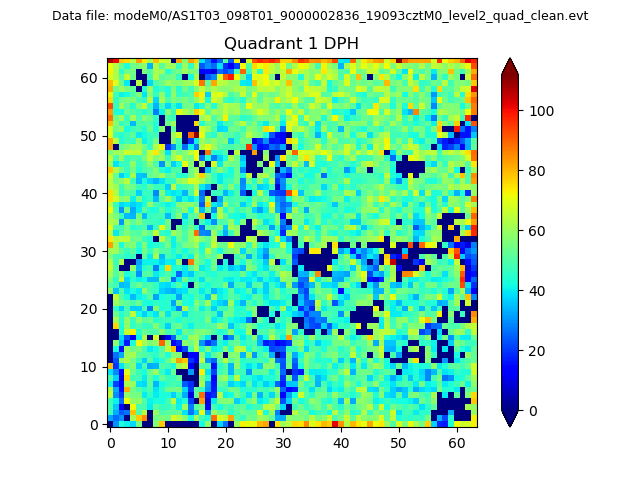 |
Quadrant B |
|---|---|---|---|
| Quadrant D | 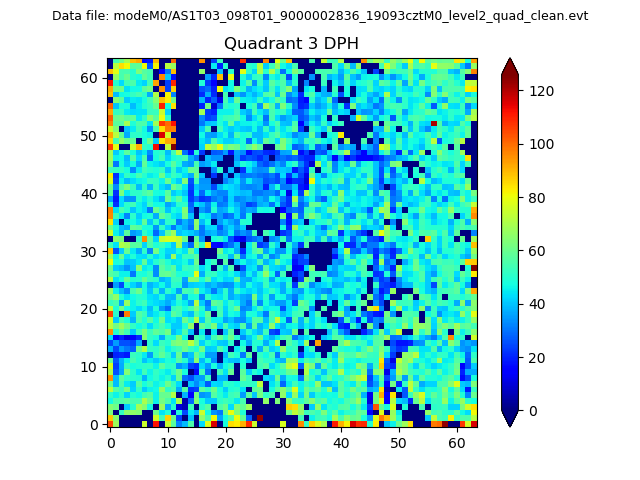 |
 |
Quadrant C |
| Plot type | Count rate plots | Images |
|---|---|---|
| Comparison with Poisson distribution Blue bars denote a histogram of data divided into 1 sec bins. Red curve is a Poisson curve with rate = median count rate of data. |
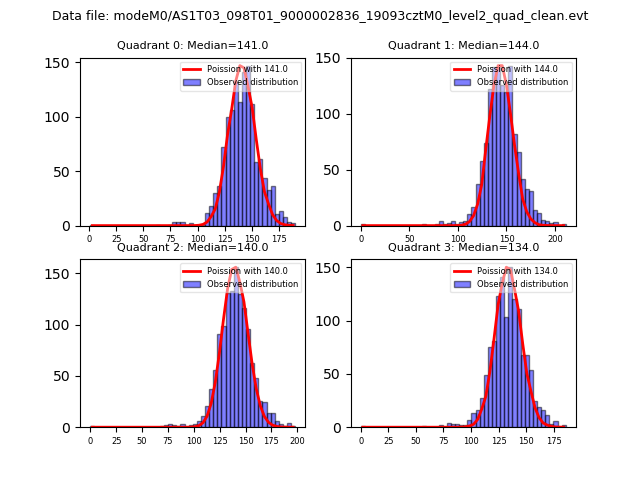 |
 |
| Quadrant-wise count rates Data is divided into 100 sec bins |
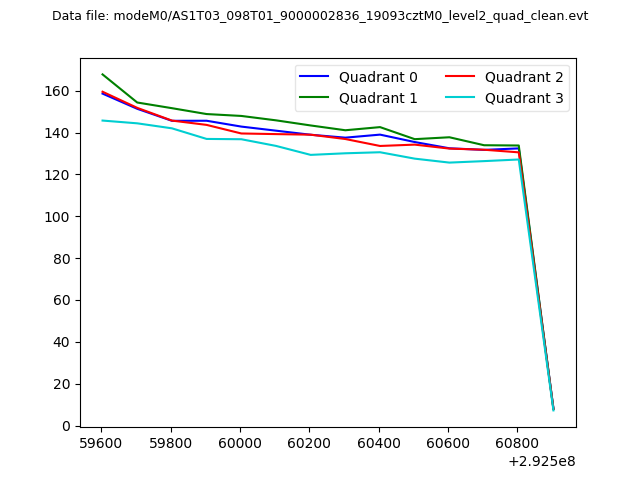 |
|
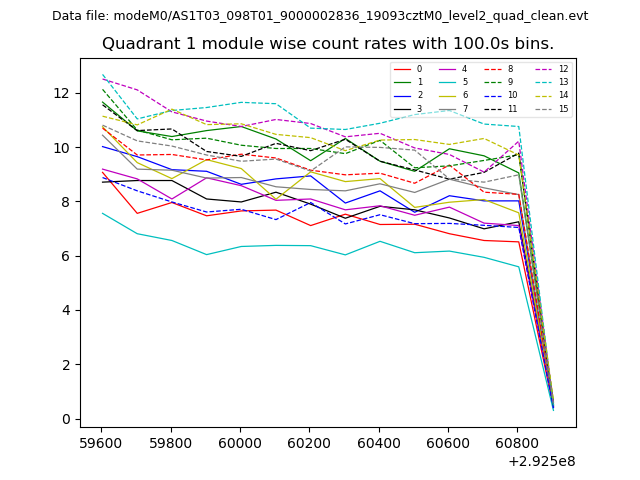
| Module-wise count rates for Quadrant A Data is divided into 100 sec bins |
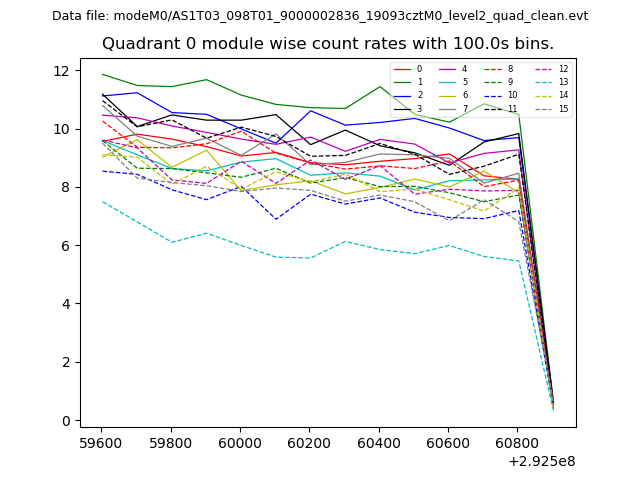 |
 |
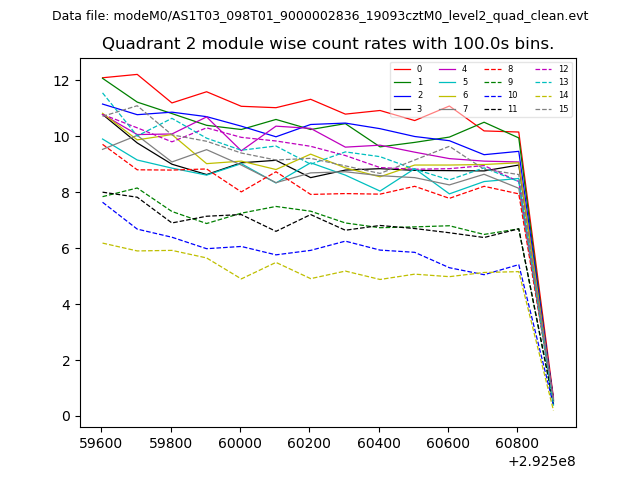
| Module-wise count rates for Quadrant B Data is divided into 100 sec bins |
 |
 |
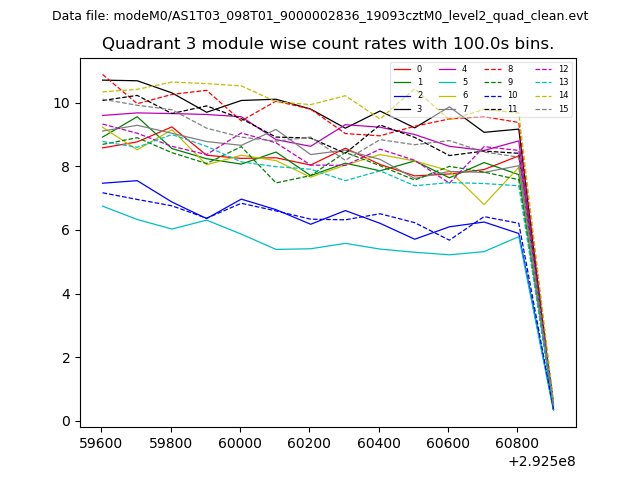
| Module-wise count rates for Quadrant C Data is divided into 100 sec bins |
 |
 |
| Module-wise count rates for Quadrant D Data is divided into 100 sec bins |
 |
 |
| Parameter | Plot |
|---|---|
| CZT HV Monitor |  |
| D_VDD | 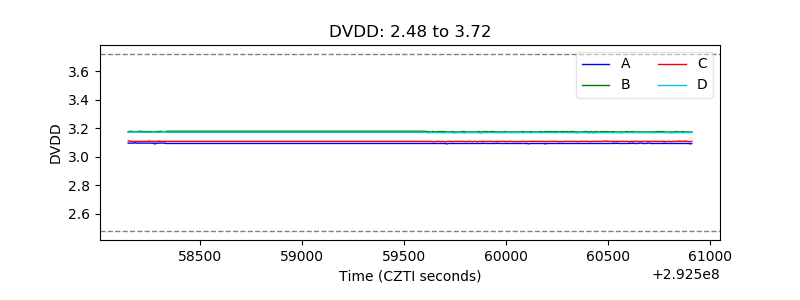 |
| Temperature 1 | 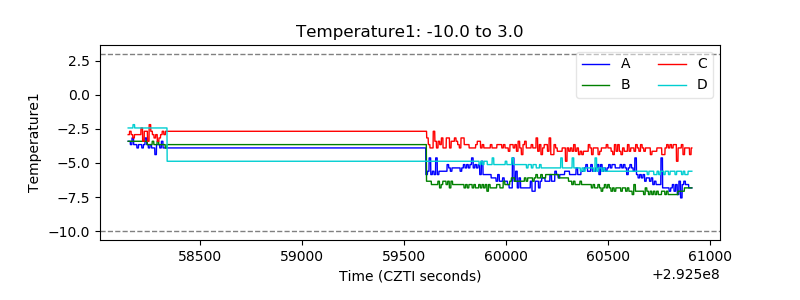 |
| Veto HV Monitor | 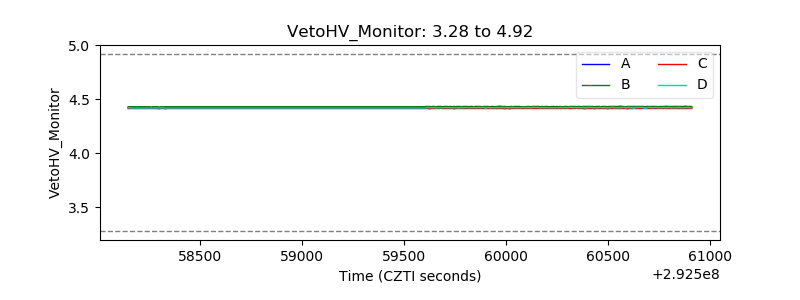 |
| Veto LLD | 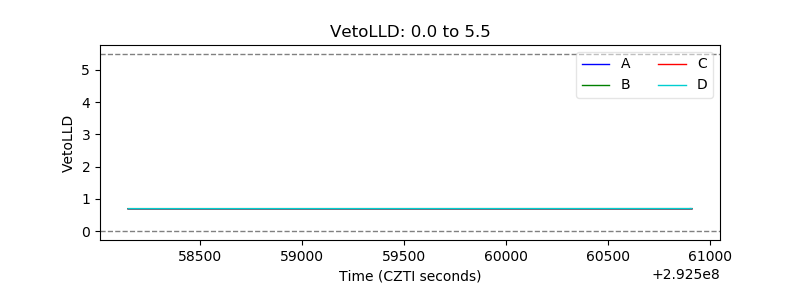 |
| Alpha Counter | 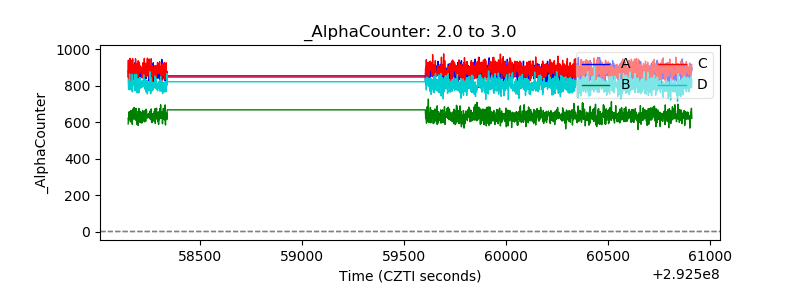 |
| _CPM_Rate | 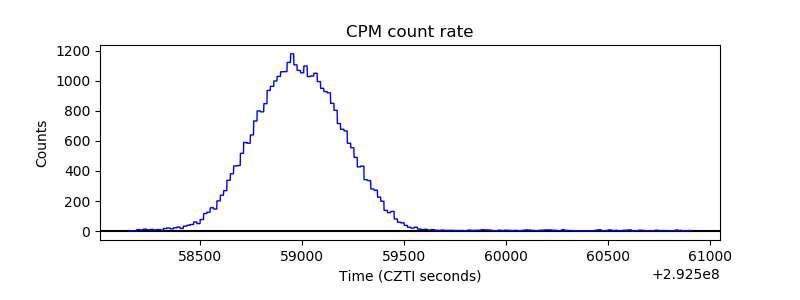 |
| CZT Counter |  |
| +2.5 Volts monitor |  |
| +5 Volts monitor |  |
| _ROLL_ROT | 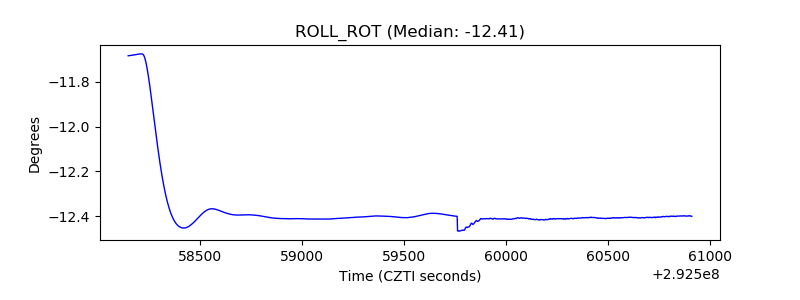 |
| _Roll_DEC | 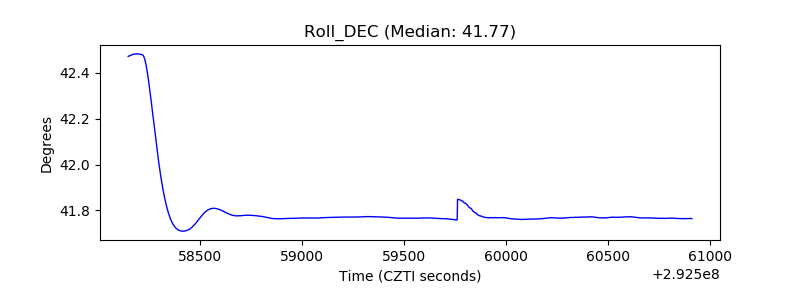 |
| _Roll_RA |  |
| Veto Counter | 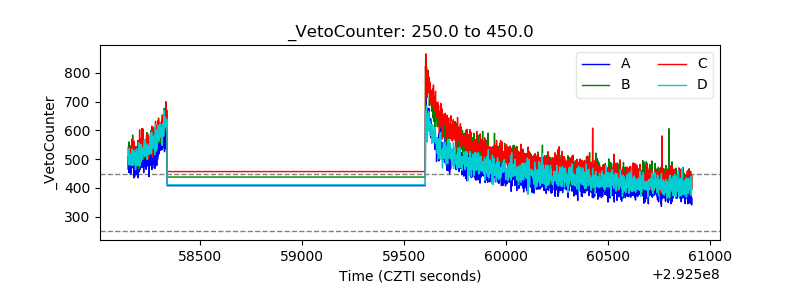 |