| Param | Original file | Final file |
|---|---|---|
| Filename | modeM0/AS1T03_098T01_9000002836_19095cztM0_level2.evt | modeM0/AS1T03_098T01_9000002836_19095cztM0_level2_quad_clean.evt |
| Size (bytes) | 487,765,440 | 88,790,400 |
| Size | 465.2 MB | 84.7 MB |
| Events in quadrant A | 3,046,452 | 558,669 |
| Events in quadrant B | 3,427,523 | 573,641 |
| Events in quadrant C | 3,100,320 | 556,366 |
| Events in quadrant D | 4,749,643 | 540,313 |
| Mode M9 | |||
|---|---|---|---|
| Quadrant | BADHDUFLAG | Total packets | Discarded packets |
| A | 0 | 5 | 0 |
| B | 0 | 5 | 0 |
| C | 0 | 5 | 0 |
| D | 0 | 5 | 0 |
| Mode M0 | |||
|---|---|---|---|
| Quadrant | BADHDUFLAG | Total packets | Discarded packets |
| A | 0 | 13598 | 1 |
| B | 0 | 14689 | 1 |
| C | 0 | 13686 | 1 |
| D | 0 | 18838 | 1 |
| Mode SS | |||
|---|---|---|---|
| Quadrant | BADHDUFLAG | Total packets | Discarded packets |
| A | 0 | 132 | 0 |
| B | 0 | 132 | 0 |
| C | 0 | 132 | 0 |
| D | 0 | 132 | 0 |
| Quadrant | Total seconds | Saturated seconds | Saturation percentage |
|---|---|---|---|
| A | 6593 | 61 | 0.925224% |
| B | 6594 | 142 | 2.153473% |
| C | 6594 | 99 | 1.501365% |
| D | 6594 | 509 | 7.719139% |
Noise dominated data is calculated using 1-second bins in cleaned event files. If a bin has >2000 counts, and if more than 50% of those come from <1% of pixels, then it is considered to be noise-dominated and hence unusable.
| Quadrant | # 1 sec bins | Bins with >0 counts | Bins with >2000 counts | High rate bins dominated by noise | Noise dominated (total time) | Noise dominated (detector-on time) | Marked lightcurve |
|---|---|---|---|---|---|---|---|
| A | 7128 | 6594 | 0 | 0 | 0.00% | 0.00% | 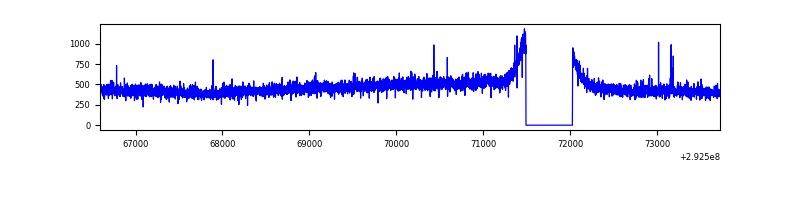 |
| B | 7129 | 6595 | 29 | 29 | 0.41% | 0.44% | 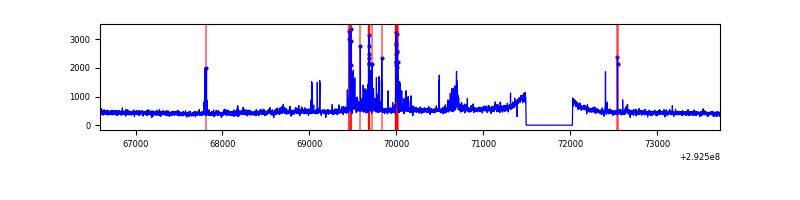 |
| C | 7129 | 6595 | 0 | 0 | 0.00% | 0.00% | 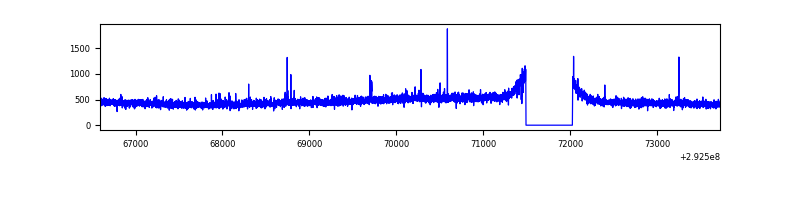 |
| D | 7129 | 6595 | 329 | 329 | 4.61% | 4.99% |  |
Top three noisy pixels from each quadrant. If the there are fewer than three noisy pixels in the level2.evt file, extra rows are filled as -1
| Pixel properties | Quadrant properties | ||||||
|---|---|---|---|---|---|---|---|
| Quadrant | DetID | PixID | Counts | Sigma | Mean | Median | Sigma |
| A | 9 | 143 | 9730 | 55.61 | 788 | 772 | 161.1 |
| A | 13 | 254 | 7039 | 38.91 | 788 | 772 | 161.1 |
| A | 0 | 226 | 6858 | 37.78 | 788 | 772 | 161.1 |
| B | 7 | 220 | 131002 | 862.14 | 787 | 768 | 151.1 |
| B | 10 | 245 | 66962 | 438.2 | 787 | 768 | 151.1 |
| B | 4 | 216 | 55663 | 363.4 | 787 | 768 | 151.1 |
| C | 14 | 238 | 117713 | 659.22 | 755 | 760 | 177.4 |
| C | 0 | 207 | 17626 | 95.07 | 755 | 760 | 177.4 |
| C | 5 | 112 | 11962 | 63.14 | 755 | 760 | 177.4 |
| D | 7 | 238 | 1051191 | 5672.57 | 747 | 725 | 185.2 |
| D | 1 | 52 | 465684 | 2510.8 | 747 | 725 | 185.2 |
| D | 11 | 176 | 340050 | 1832.37 | 747 | 725 | 185.2 |
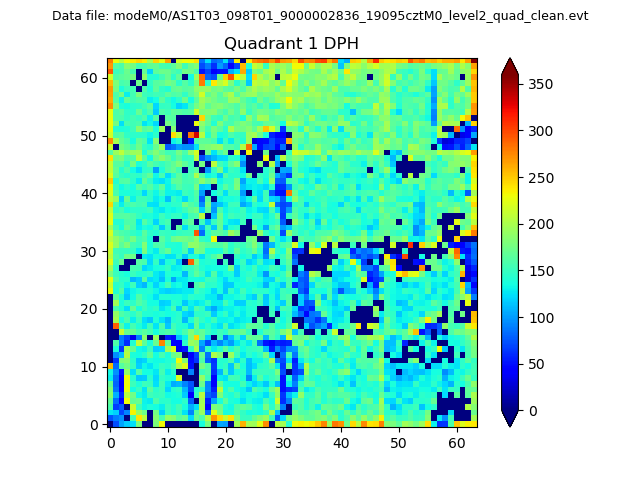
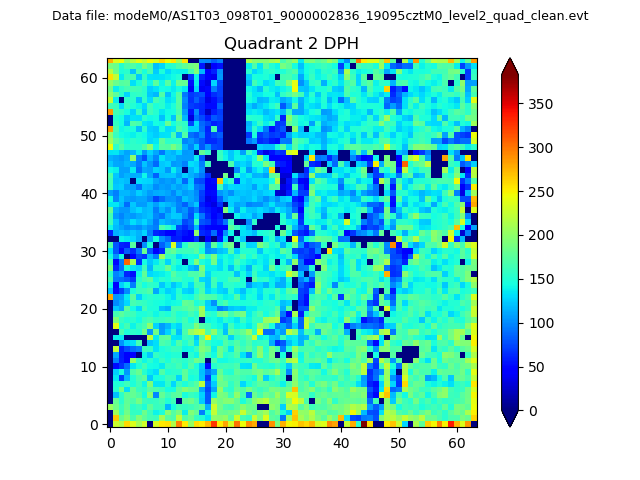
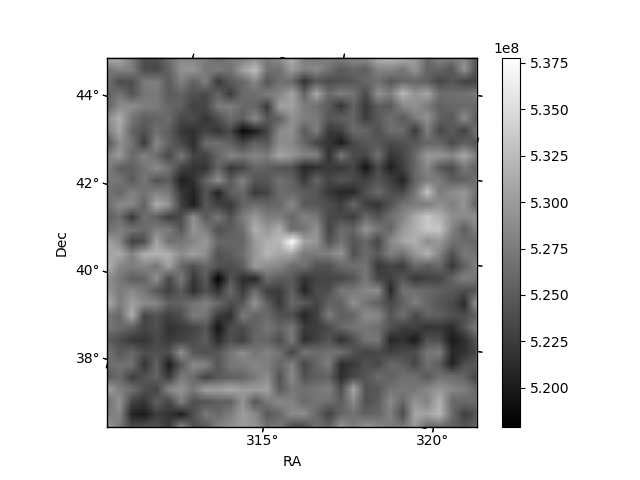
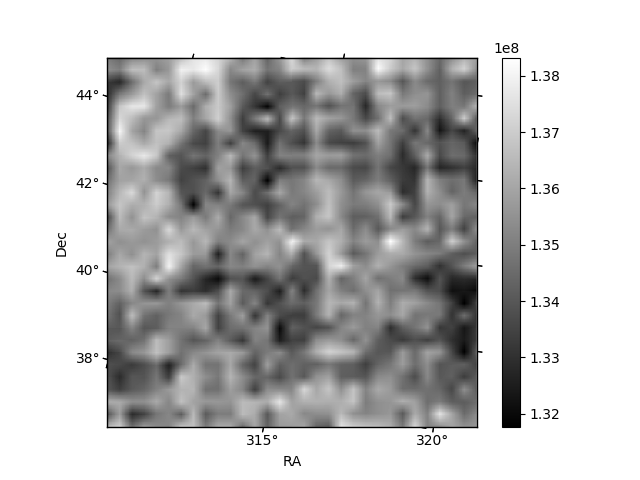
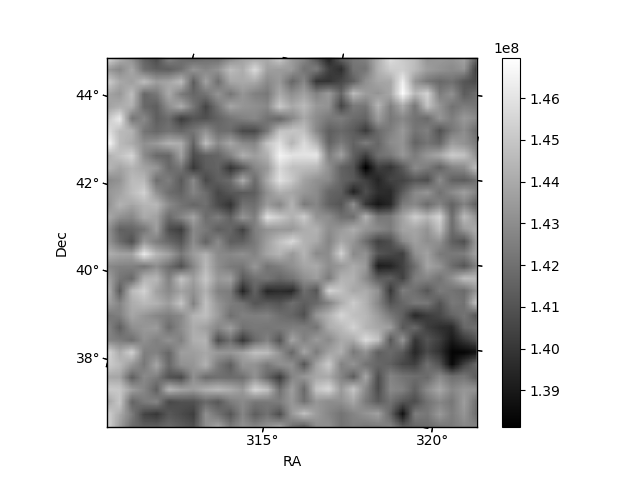
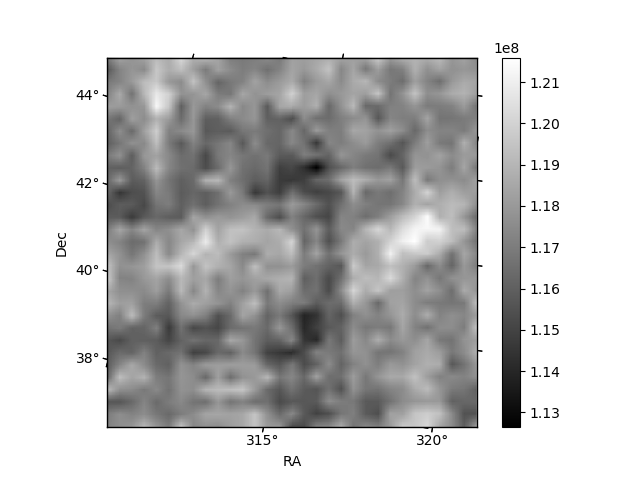
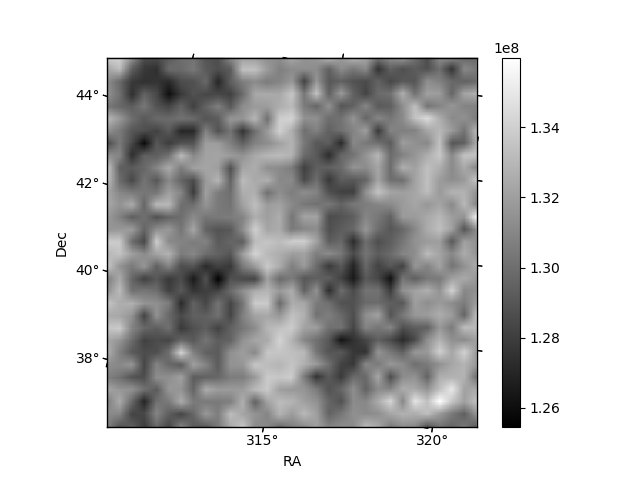
Histogram calculated using DETX and DETY for each event in the final _common_clean file
| Quadrant A | 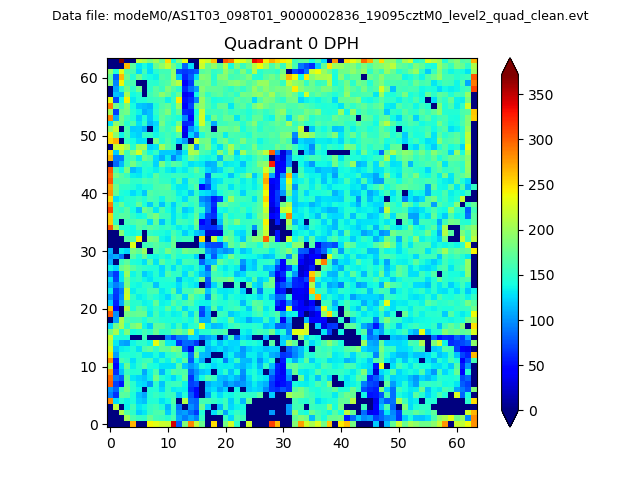 |
 |
Quadrant B |
|---|---|---|---|
| Quadrant D | 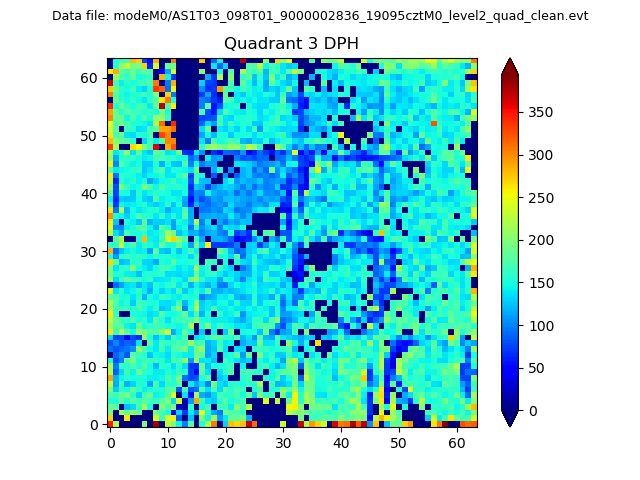 |
 |
Quadrant C |
| Plot type | Count rate plots | Images |
|---|---|---|
| Comparison with Poisson distribution Blue bars denote a histogram of data divided into 1 sec bins. Red curve is a Poisson curve with rate = median count rate of data. |
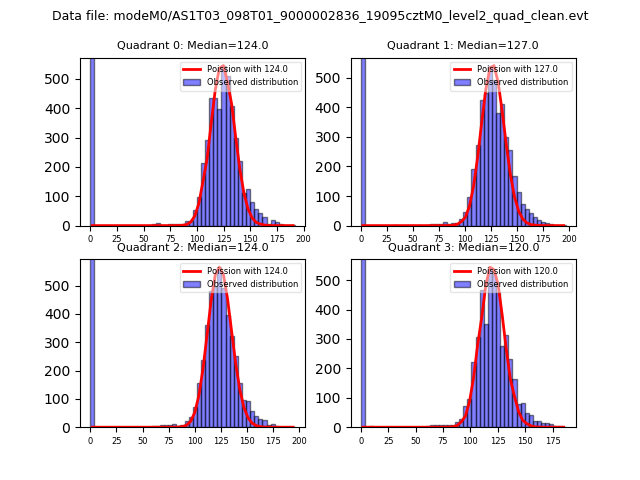 |
 |
| Quadrant-wise count rates Data is divided into 100 sec bins |
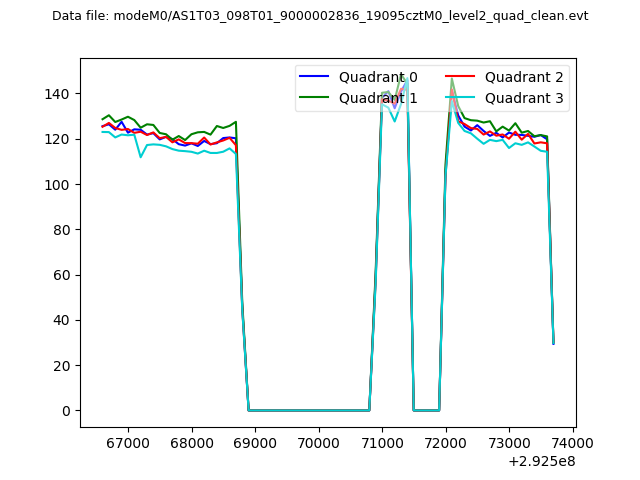 |
|
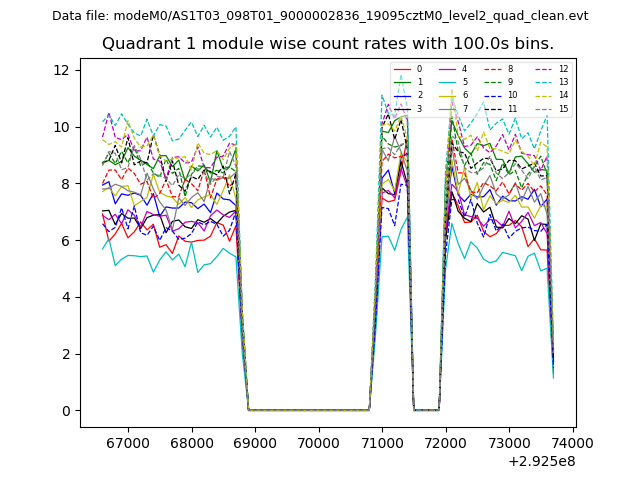
| Module-wise count rates for Quadrant A Data is divided into 100 sec bins |
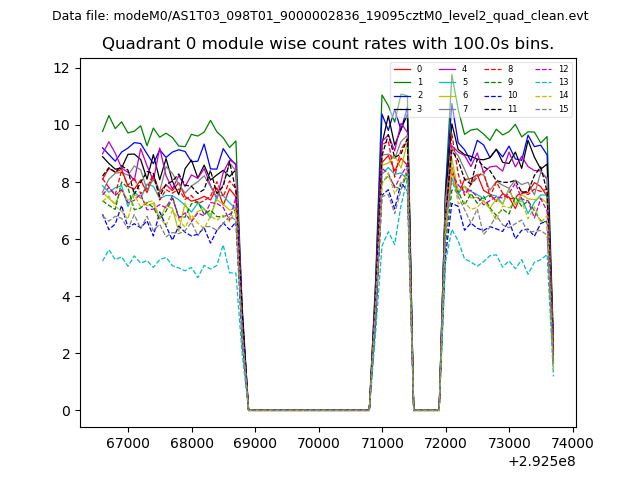 |
 |
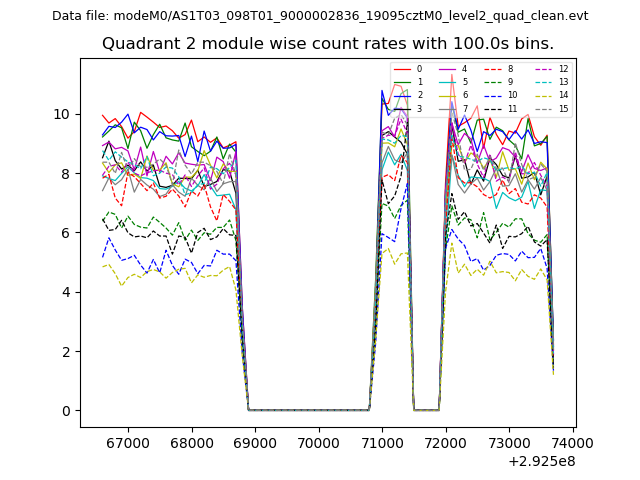
| Module-wise count rates for Quadrant B Data is divided into 100 sec bins |
 |
 |
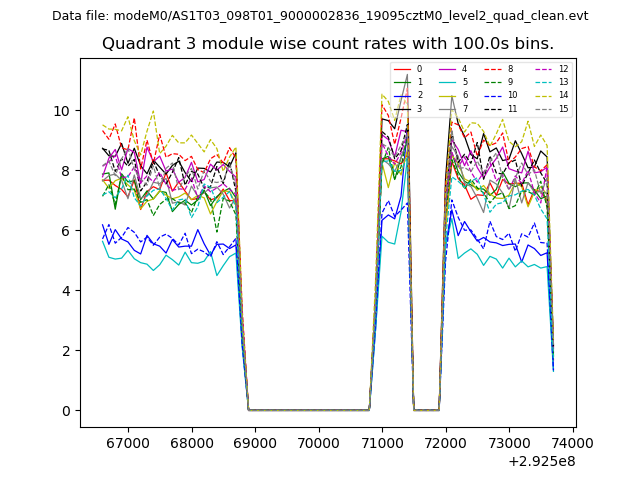
| Module-wise count rates for Quadrant C Data is divided into 100 sec bins |
 |
 |
| Module-wise count rates for Quadrant D Data is divided into 100 sec bins |
 |
 |
| Parameter | Plot |
|---|---|
| CZT HV Monitor | 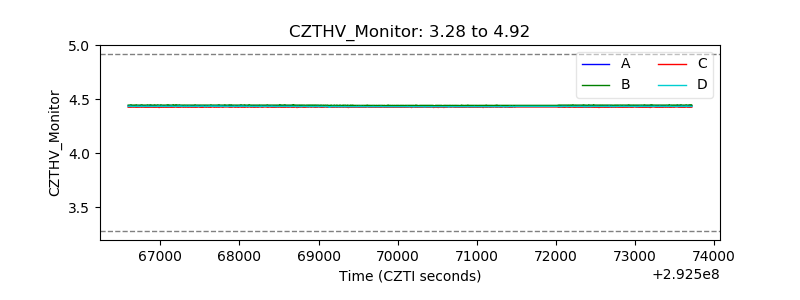 |
| D_VDD | 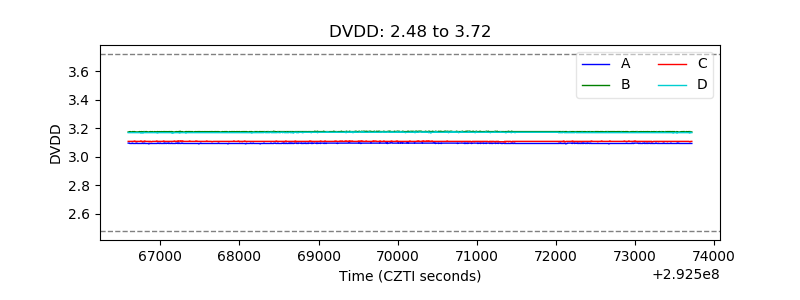 |
| Temperature 1 | 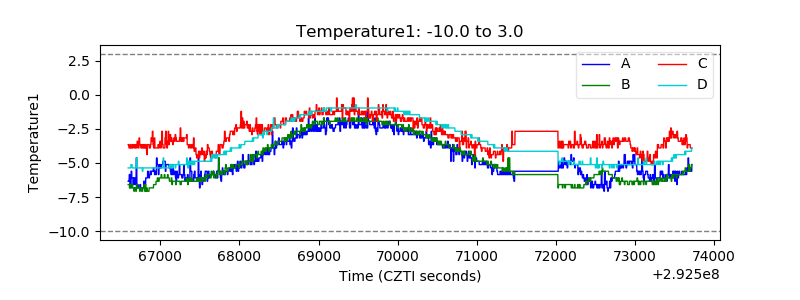 |
| Veto HV Monitor | 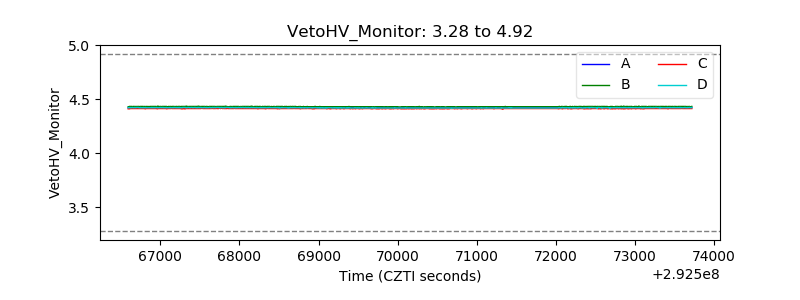 |
| Veto LLD | 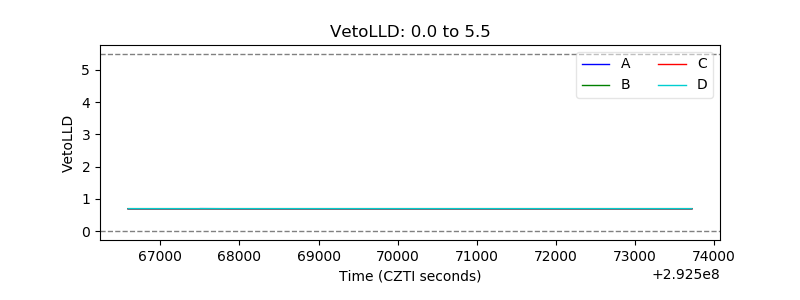 |
| Alpha Counter | 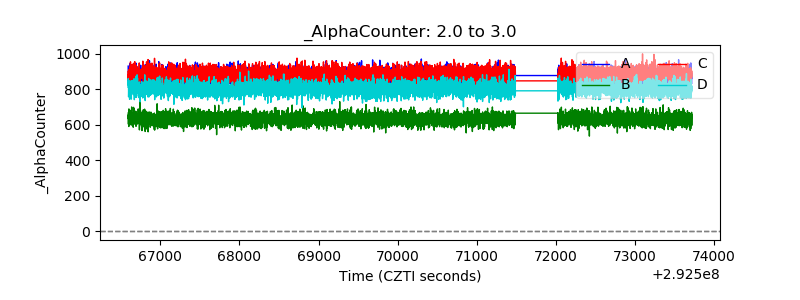 |
| _CPM_Rate | 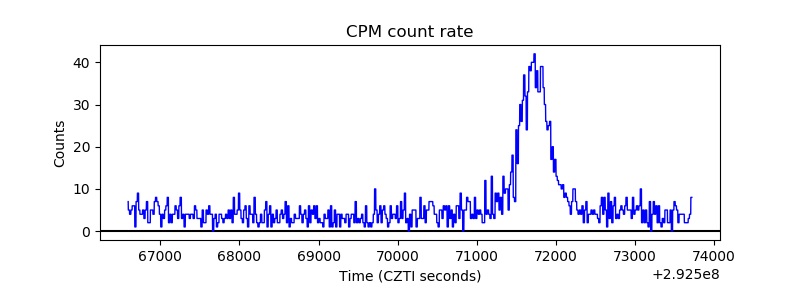 |
| CZT Counter | 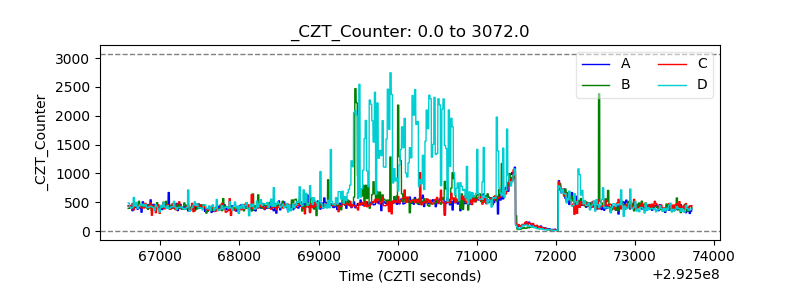 |
| +2.5 Volts monitor |  |
| +5 Volts monitor |  |
| _ROLL_ROT | 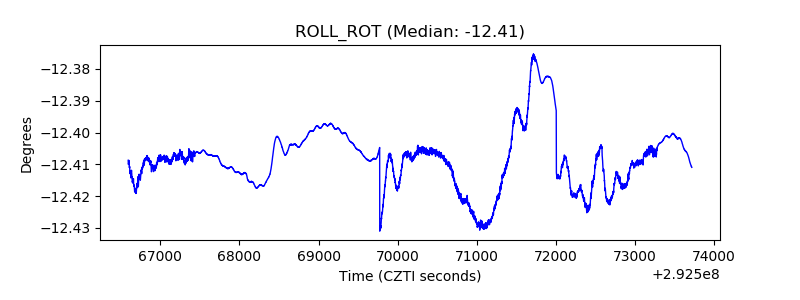 |
| _Roll_DEC | 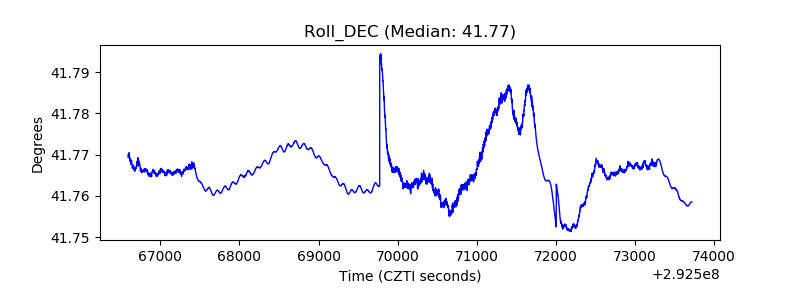 |
| _Roll_RA | 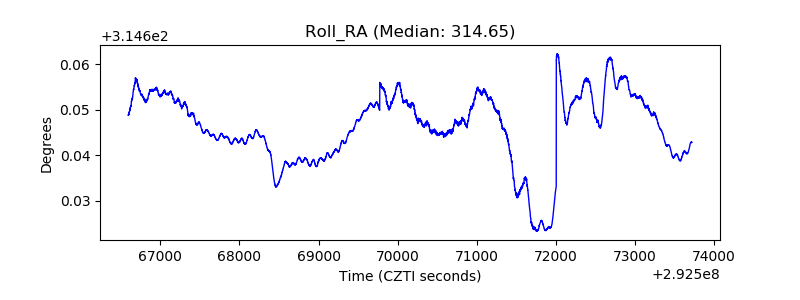 |
| Veto Counter | 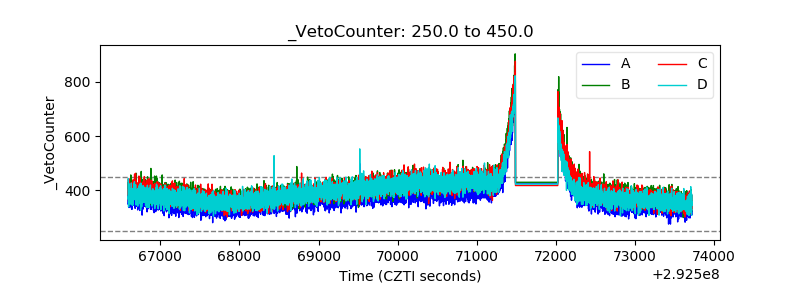 |