| Param | Original file | Final file |
|---|---|---|
| Filename | modeM0/AS1T03_098T01_9000002836_19096cztM0_level2.evt | modeM0/AS1T03_098T01_9000002836_19096cztM0_level2_quad_clean.evt |
| Size (bytes) | 572,964,480 | 101,194,560 |
| Size | 546.4 MB | 96.5 MB |
| Events in quadrant A | 3,419,003 | 648,202 |
| Events in quadrant B | 3,829,237 | 662,039 |
| Events in quadrant C | 3,554,869 | 641,768 |
| Events in quadrant D | 6,053,688 | 604,016 |
| Mode M9 | |||
|---|---|---|---|
| Quadrant | BADHDUFLAG | Total packets | Discarded packets |
| A | 0 | 1 | 0 |
| B | 0 | 1 | 0 |
| C | 0 | 1 | 0 |
| D | 0 | 1 | 0 |
| Mode M0 | |||
|---|---|---|---|
| Quadrant | BADHDUFLAG | Total packets | Discarded packets |
| A | 0 | 15173 | 1 |
| B | 0 | 16244 | 1 |
| C | 0 | 15421 | 1 |
| D | 0 | 23280 | 1 |
| Mode SS | |||
|---|---|---|---|
| Quadrant | BADHDUFLAG | Total packets | Discarded packets |
| A | 0 | 148 | 0 |
| B | 0 | 148 | 0 |
| C | 0 | 148 | 0 |
| D | 0 | 148 | 0 |
| Quadrant | Total seconds | Saturated seconds | Saturation percentage |
|---|---|---|---|
| A | 7298 | 256 | 3.507810% |
| B | 7299 | 288 | 3.945746% |
| C | 7299 | 254 | 3.479929% |
| D | 7299 | 911 | 12.481162% |
Noise dominated data is calculated using 1-second bins in cleaned event files. If a bin has >2000 counts, and if more than 50% of those come from <1% of pixels, then it is considered to be noise-dominated and hence unusable.
| Quadrant | # 1 sec bins | Bins with >0 counts | Bins with >2000 counts | High rate bins dominated by noise | Noise dominated (total time) | Noise dominated (detector-on time) | Marked lightcurve |
|---|---|---|---|---|---|---|---|
| A | 7348 | 7299 | 0 | 0 | 0.00% | 0.00% | 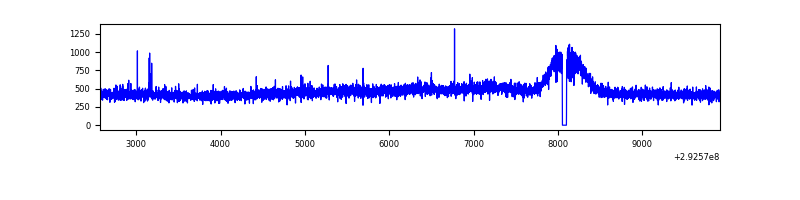 |
| B | 7349 | 7300 | 26 | 26 | 0.35% | 0.36% | 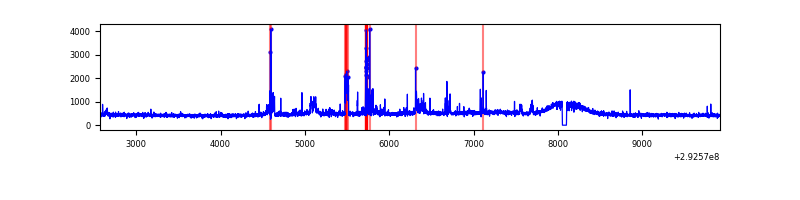 |
| C | 7349 | 7300 | 3 | 3 | 0.04% | 0.04% | 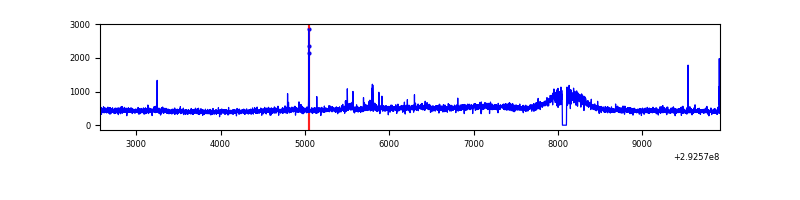 |
| D | 7349 | 7300 | 544 | 544 | 7.40% | 7.45% | 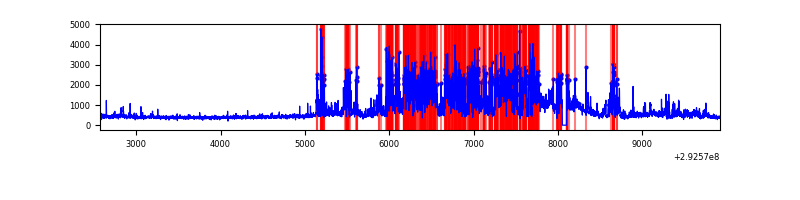 |
Top three noisy pixels from each quadrant. If the there are fewer than three noisy pixels in the level2.evt file, extra rows are filled as -1
| Pixel properties | Quadrant properties | ||||||
|---|---|---|---|---|---|---|---|
| Quadrant | DetID | PixID | Counts | Sigma | Mean | Median | Sigma |
| A | 0 | 226 | 7886 | 38.61 | 886 | 866 | 181.8 |
| A | 13 | 254 | 7415 | 36.02 | 886 | 866 | 181.8 |
| A | 3 | 137 | 7069 | 34.12 | 886 | 866 | 181.8 |
| B | 10 | 245 | 196141 | 1141.82 | 882 | 859 | 171.0 |
| B | 3 | 112 | 76778 | 443.9 | 882 | 859 | 171.0 |
| B | 0 | 189 | 33785 | 192.52 | 882 | 859 | 171.0 |
| C | 14 | 238 | 130445 | 648.63 | 846 | 850 | 199.8 |
| C | 7 | 220 | 46779 | 229.88 | 846 | 850 | 199.8 |
| C | 0 | 207 | 35300 | 172.42 | 846 | 850 | 199.8 |
| D | 7 | 238 | 2021211 | 9903.36 | 830 | 805 | 204.0 |
| D | 1 | 52 | 460447 | 2253.01 | 830 | 805 | 204.0 |
| D | 11 | 176 | 337861 | 1652.14 | 830 | 805 | 204.0 |
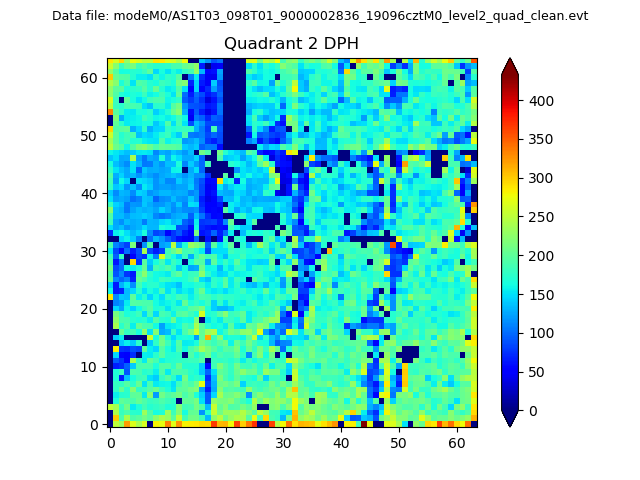
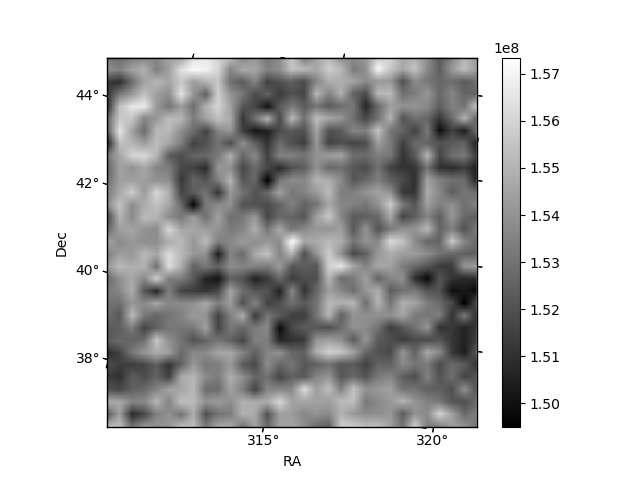
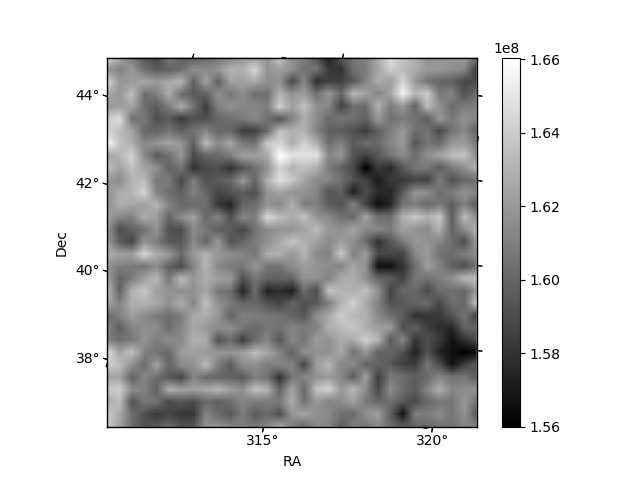
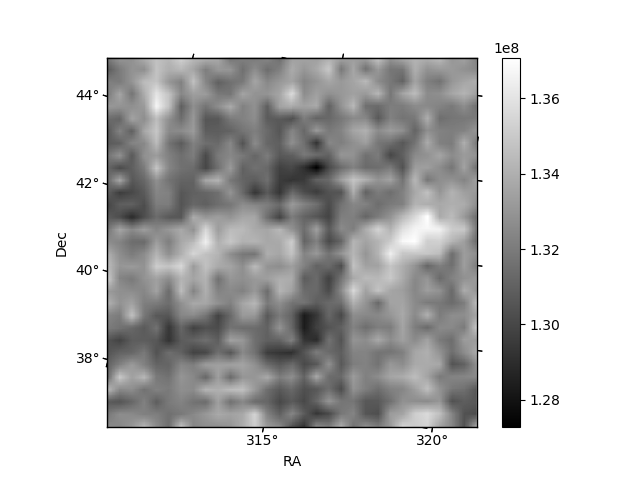
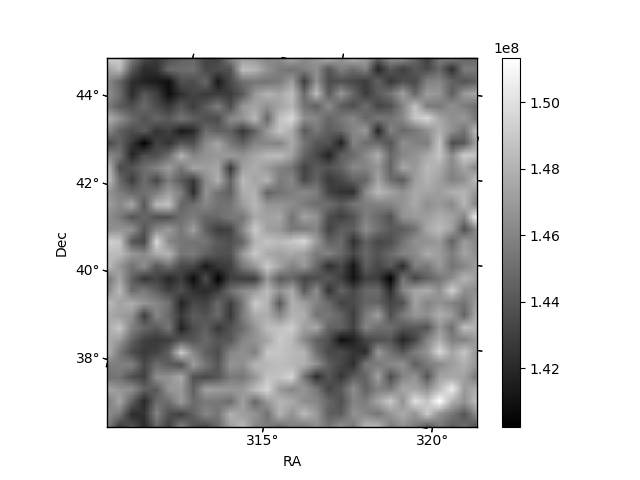
Histogram calculated using DETX and DETY for each event in the final _common_clean file
| Quadrant A | 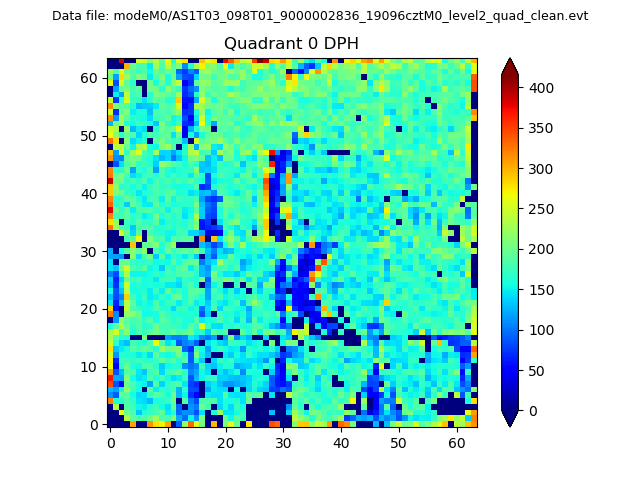 |
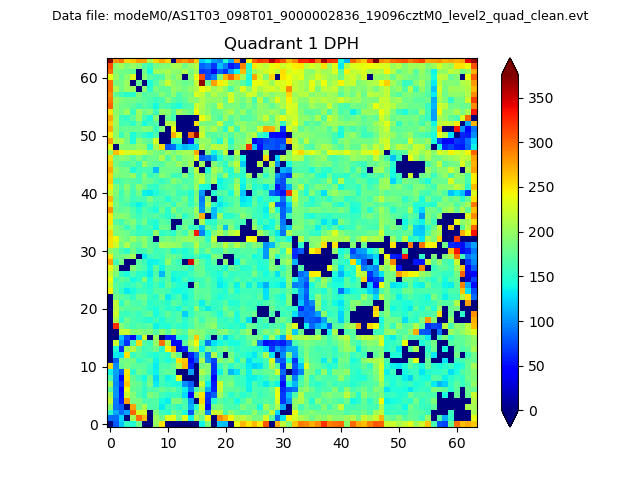 |
Quadrant B |
|---|---|---|---|
| Quadrant D | 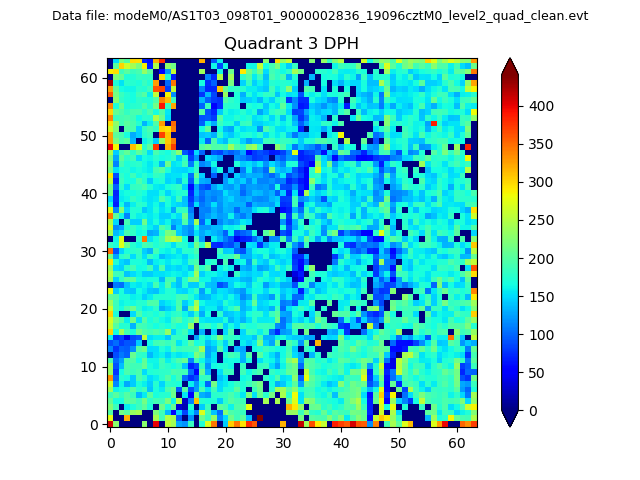 |
 |
Quadrant C |
| Plot type | Count rate plots | Images |
|---|---|---|
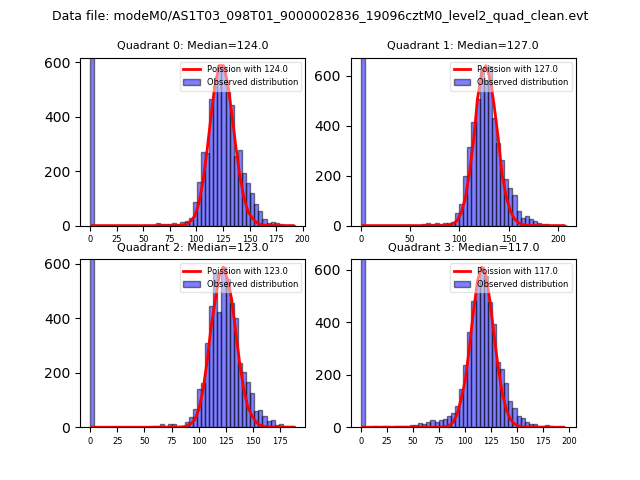
| Comparison with Poisson distribution Blue bars denote a histogram of data divided into 1 sec bins. Red curve is a Poisson curve with rate = median count rate of data. |
 |
 |
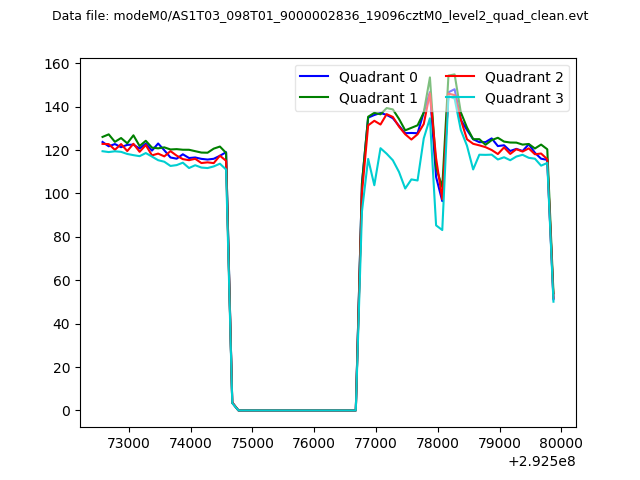
| Quadrant-wise count rates Data is divided into 100 sec bins |
 |
|
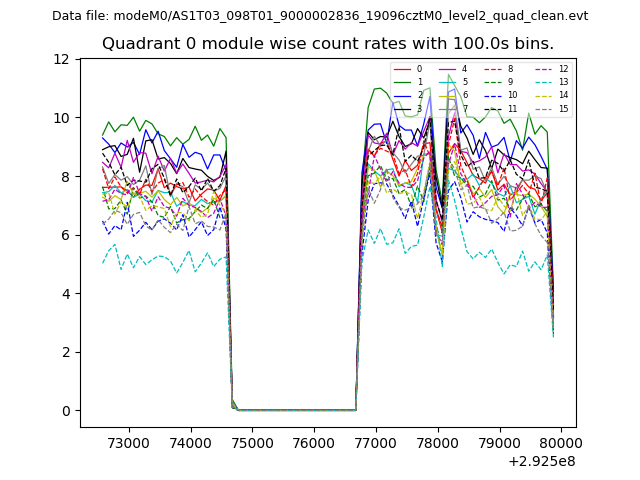
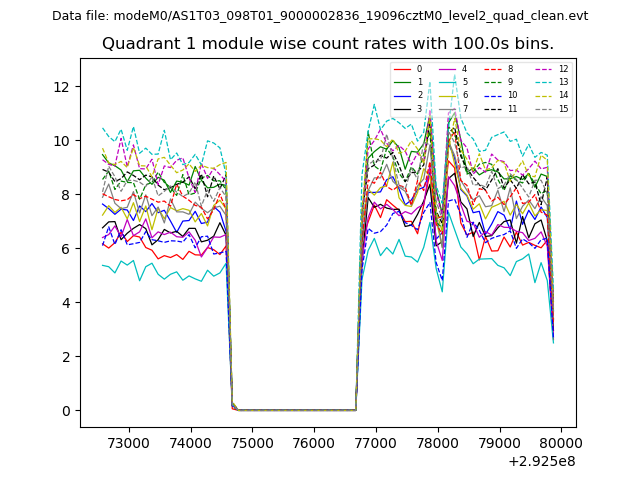
| Module-wise count rates for Quadrant A Data is divided into 100 sec bins |
 |
 |
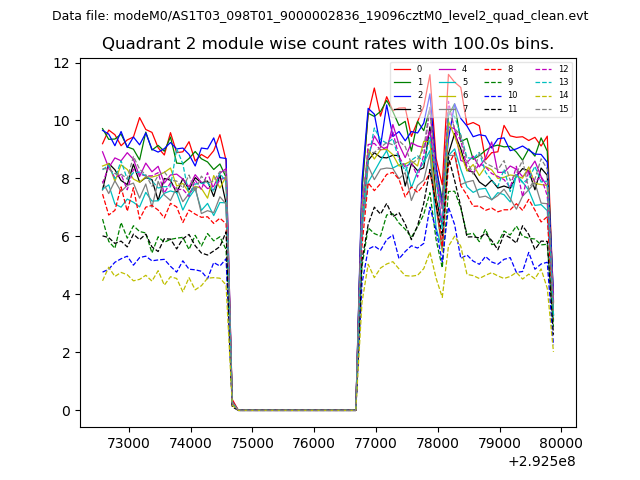
| Module-wise count rates for Quadrant B Data is divided into 100 sec bins |
 |
 |
| Module-wise count rates for Quadrant C Data is divided into 100 sec bins |
 |
 |
| Module-wise count rates for Quadrant D Data is divided into 100 sec bins |
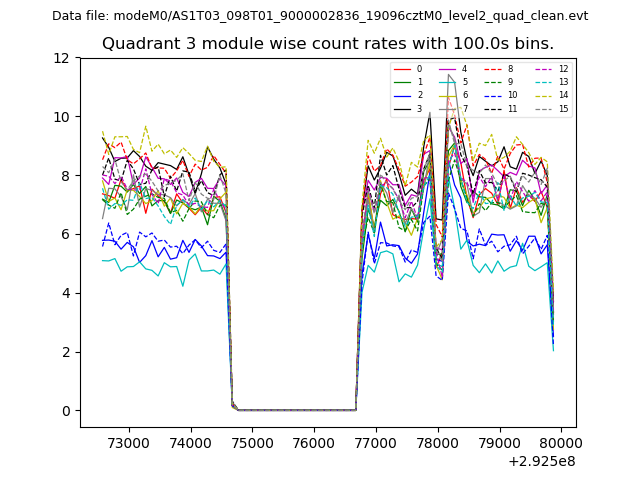 |
 |
| Parameter | Plot |
|---|---|
| CZT HV Monitor | 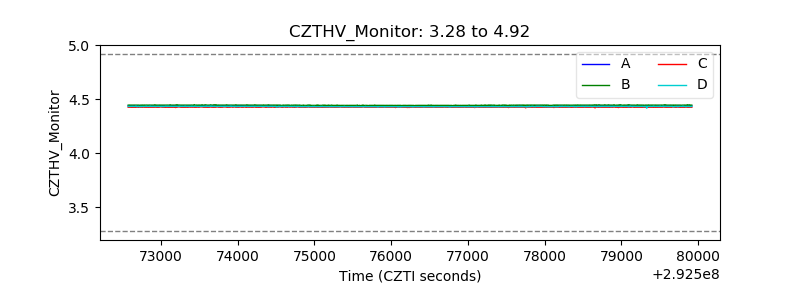 |
| D_VDD | 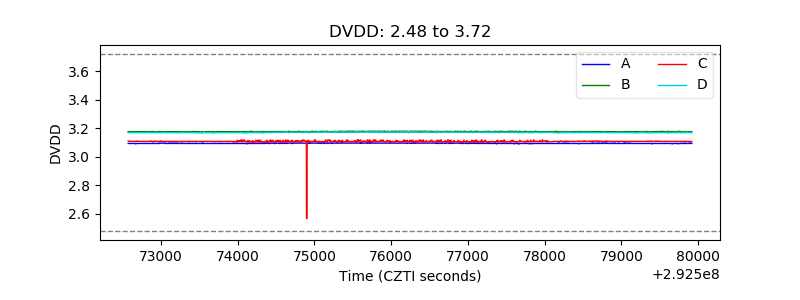 |
| Temperature 1 | 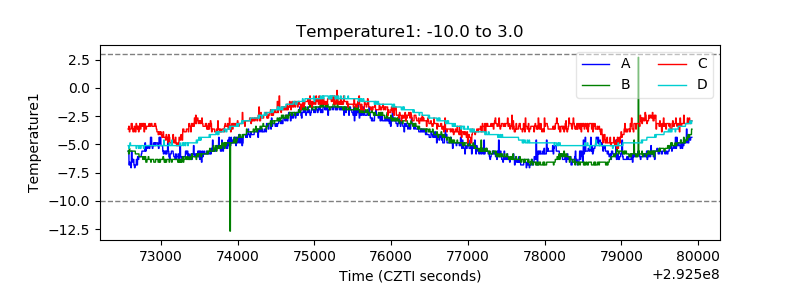 |
| Veto HV Monitor | 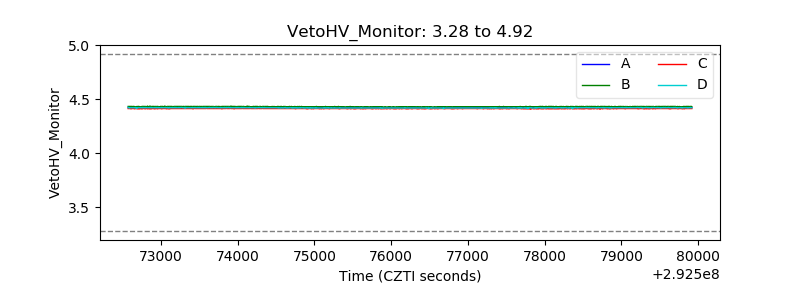 |
| Veto LLD | 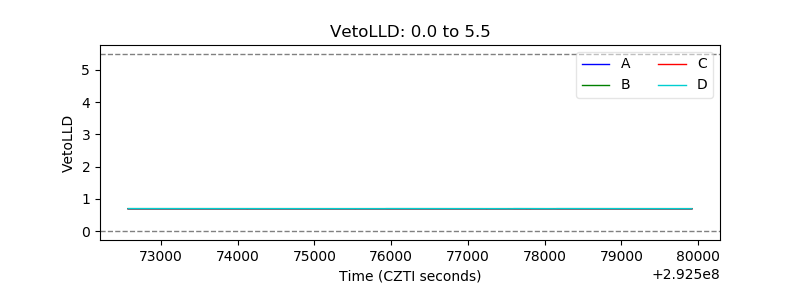 |
| Alpha Counter | 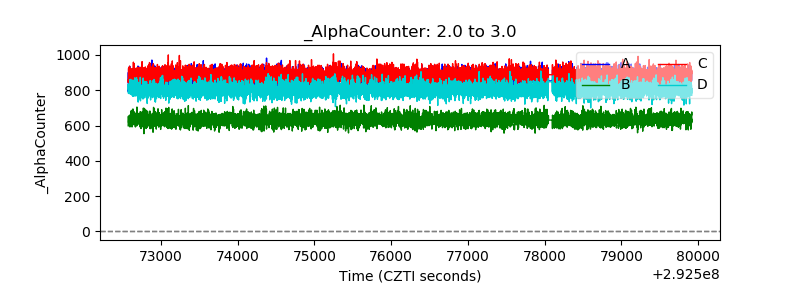 |
| _CPM_Rate | 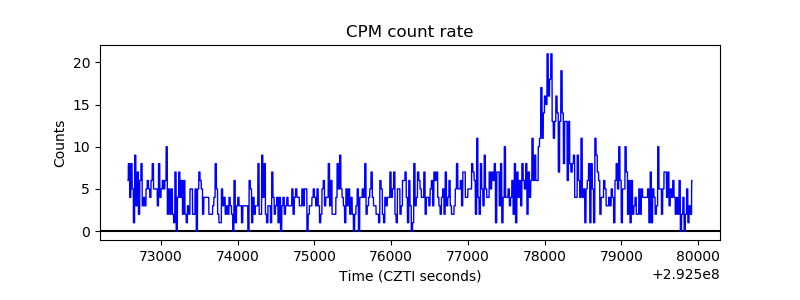 |
| CZT Counter | 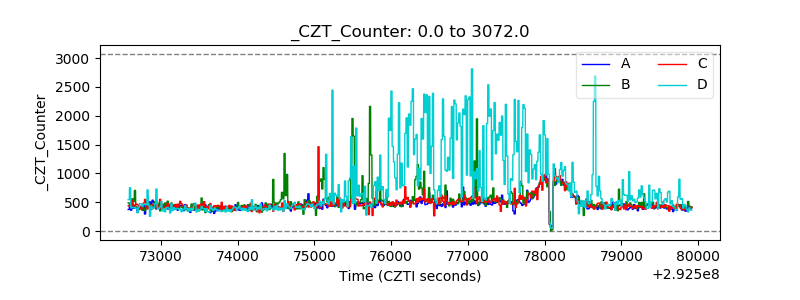 |
| +2.5 Volts monitor |  |
| +5 Volts monitor | 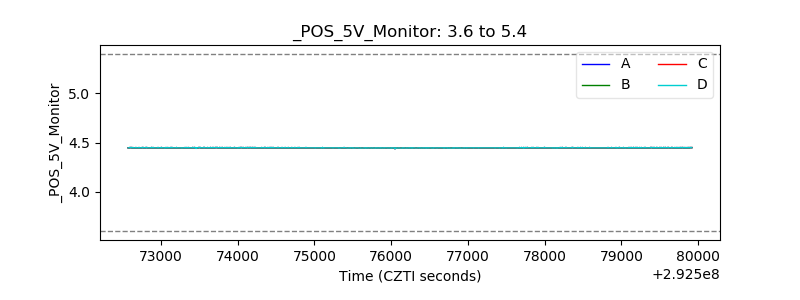 |
| _ROLL_ROT | 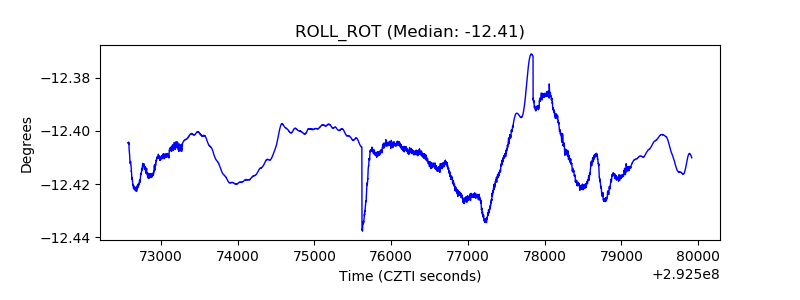 |
| _Roll_DEC | 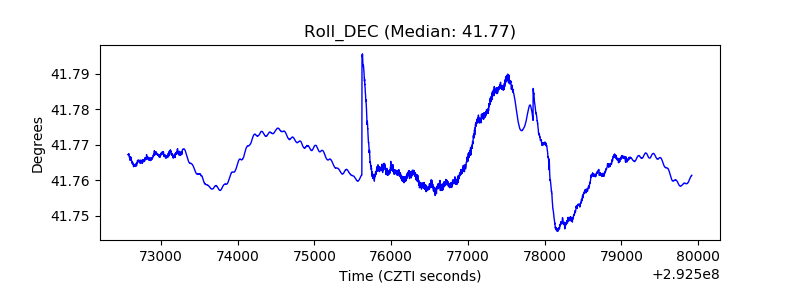 |
| _Roll_RA | 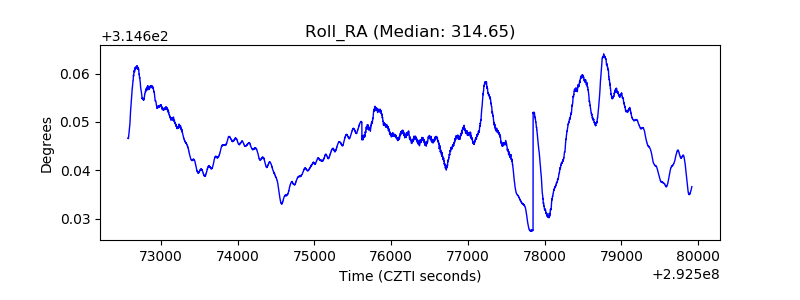 |
| Veto Counter | 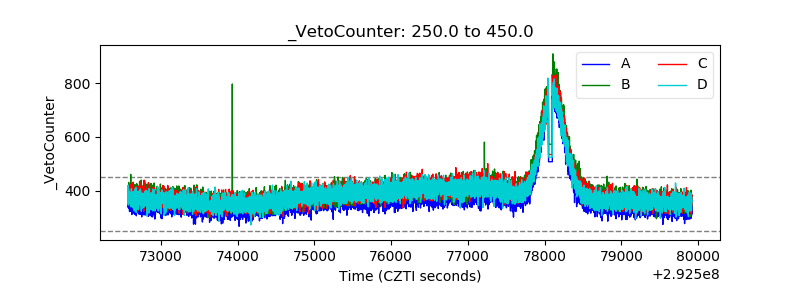 |