| Param | Original file | Final file |
|---|---|---|
| Filename | modeM0/AS1T03_098T01_9000002836_19100cztM0_level2.evt | modeM0/AS1T03_098T01_9000002836_19100cztM0_level2_quad_clean.evt |
| Size (bytes) | 1,454,232,960 | 215,611,200 |
| Size | 1.4 GB | 205.6 MB |
| Events in quadrant A | 8,458,515 | 1,340,363 |
| Events in quadrant B | 9,429,033 | 1,359,617 |
| Events in quadrant C | 8,599,243 | 1,325,535 |
| Events in quadrant D | 16,326,126 | 1,249,649 |
| Mode M9 | |||
|---|---|---|---|
| Quadrant | BADHDUFLAG | Total packets | Discarded packets |
| A | 0 | 19 | 0 |
| B | 0 | 19 | 0 |
| C | 0 | 19 | 0 |
| D | 0 | 19 | 0 |
| Mode M0 | |||
|---|---|---|---|
| Quadrant | BADHDUFLAG | Total packets | Discarded packets |
| A | 0 | 37024 | 3 |
| B | 0 | 39332 | 3 |
| C | 0 | 37281 | 3 |
| D | 0 | 60941 | 3 |
| Mode SS | |||
|---|---|---|---|
| Quadrant | BADHDUFLAG | Total packets | Discarded packets |
| A | 0 | 370 | 0 |
| B | 0 | 370 | 0 |
| C | 0 | 370 | 0 |
| D | 0 | 370 | 0 |
| Quadrant | Total seconds | Saturated seconds | Saturation percentage |
|---|---|---|---|
| A | 18206 | 150 | 0.823904% |
| B | 18206 | 331 | 1.818082% |
| C | 18207 | 232 | 1.274235% |
| D | 18207 | 1561 | 8.573626% |
Noise dominated data is calculated using 1-second bins in cleaned event files. If a bin has >2000 counts, and if more than 50% of those come from <1% of pixels, then it is considered to be noise-dominated and hence unusable.
| Quadrant | # 1 sec bins | Bins with >0 counts | Bins with >2000 counts | High rate bins dominated by noise | Noise dominated (total time) | Noise dominated (detector-on time) | Marked lightcurve |
|---|---|---|---|---|---|---|---|
| A | 20051 | 18209 | 0 | 0 | 0.00% | 0.00% | 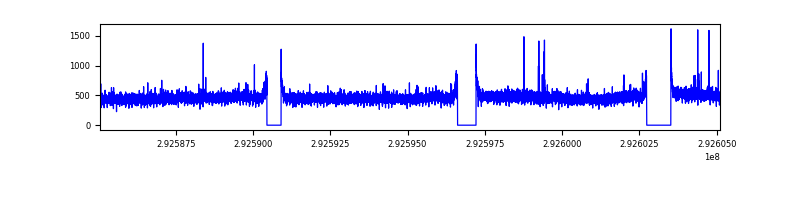 |
| B | 20051 | 18209 | 125 | 125 | 0.62% | 0.69% | 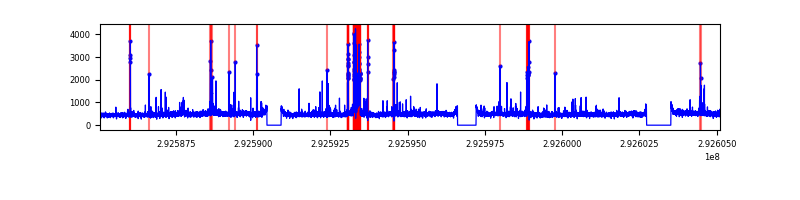 |
| C | 20052 | 18209 | 24 | 24 | 0.12% | 0.13% | 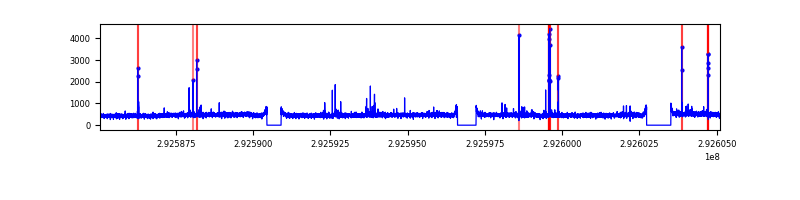 |
| D | 20052 | 18210 | 1207 | 1207 | 6.02% | 6.63% | 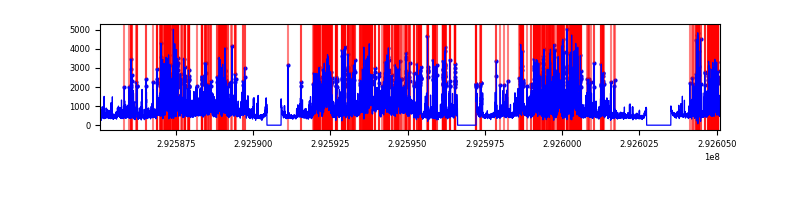 |
Top three noisy pixels from each quadrant. If the there are fewer than three noisy pixels in the level2.evt file, extra rows are filled as -1
| Pixel properties | Quadrant properties | ||||||
|---|---|---|---|---|---|---|---|
| Quadrant | DetID | PixID | Counts | Sigma | Mean | Median | Sigma |
| A | 8 | 192 | 67487 | 149.09 | 2167 | 2115 | 438.5 |
| A | 13 | 254 | 19881 | 40.52 | 2167 | 2115 | 438.5 |
| A | 0 | 226 | 18808 | 38.07 | 2167 | 2115 | 438.5 |
| B | 4 | 216 | 420336 | 1018.07 | 2159 | 2102 | 410.8 |
| B | 3 | 112 | 128192 | 306.93 | 2159 | 2102 | 410.8 |
| B | 7 | 220 | 87026 | 206.72 | 2159 | 2102 | 410.8 |
| C | 14 | 238 | 323045 | 661.28 | 2076 | 2086 | 485.4 |
| C | 0 | 207 | 145317 | 295.1 | 2076 | 2086 | 485.4 |
| C | 3 | 233 | 39494 | 77.07 | 2076 | 2086 | 485.4 |
| D | 7 | 238 | 3182803 | 6293.66 | 2054 | 1989 | 505.4 |
| D | 1 | 52 | 2327640 | 4601.61 | 2054 | 1989 | 505.4 |
| D | 11 | 176 | 2112399 | 4175.72 | 2054 | 1989 | 505.4 |
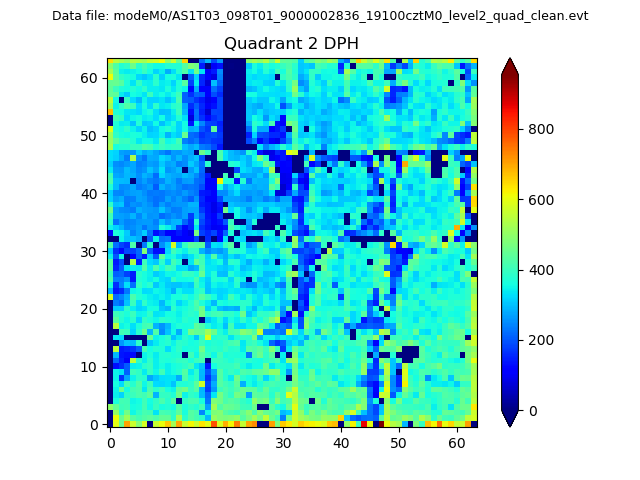
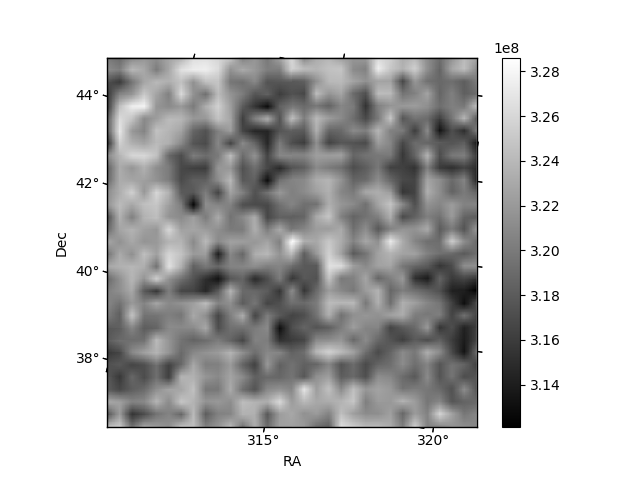
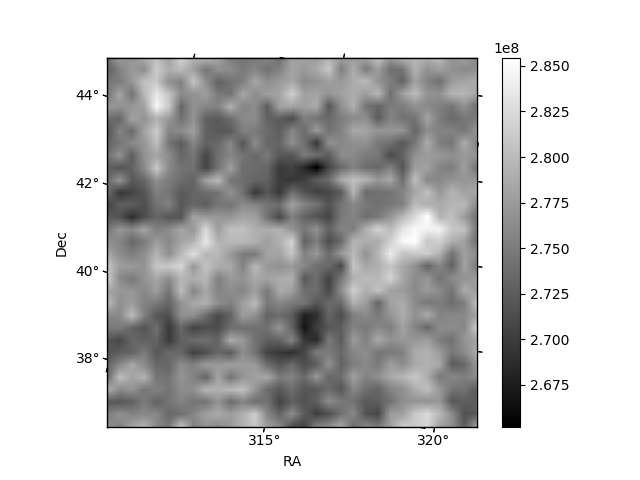
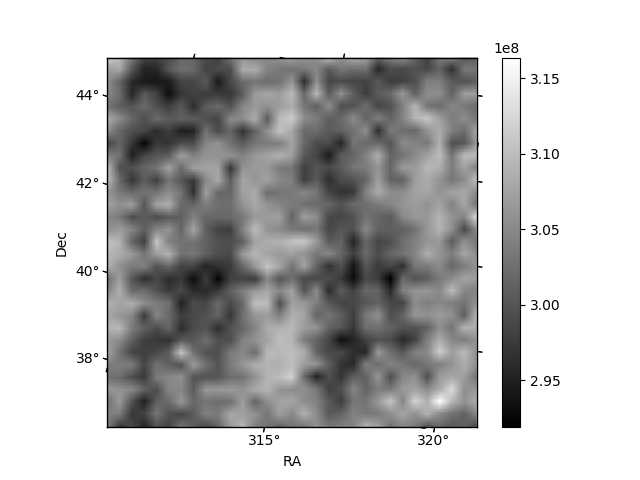
Histogram calculated using DETX and DETY for each event in the final _common_clean file
| Quadrant A |  |
 |
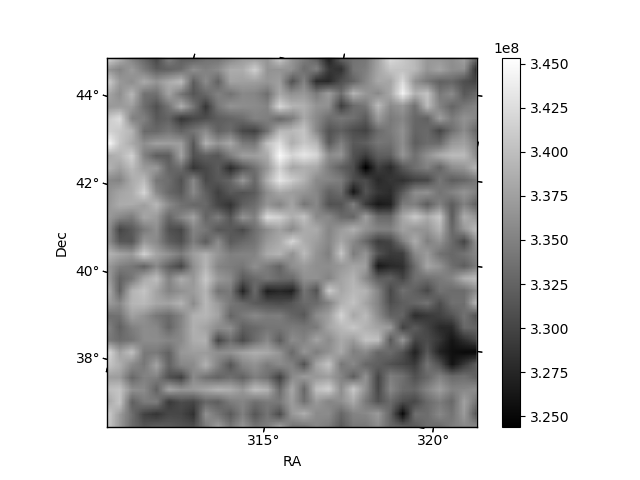
Quadrant B |
|---|---|---|---|
| Quadrant D |  |
 |
Quadrant C |
| Plot type | Count rate plots | Images |
|---|---|---|
| Comparison with Poisson distribution Blue bars denote a histogram of data divided into 1 sec bins. Red curve is a Poisson curve with rate = median count rate of data. |
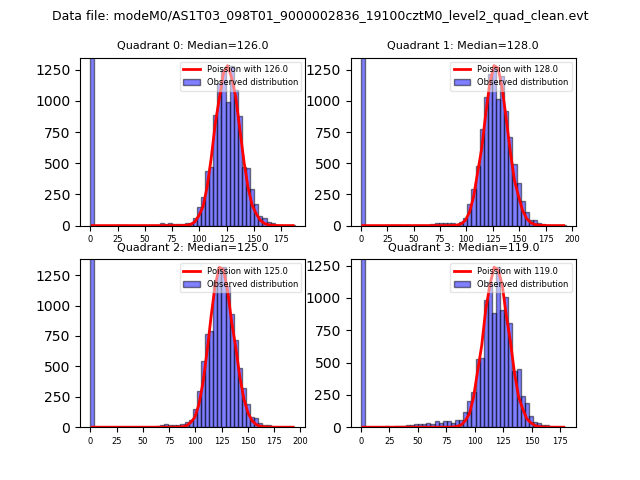 |
 |
| Quadrant-wise count rates Data is divided into 100 sec bins |
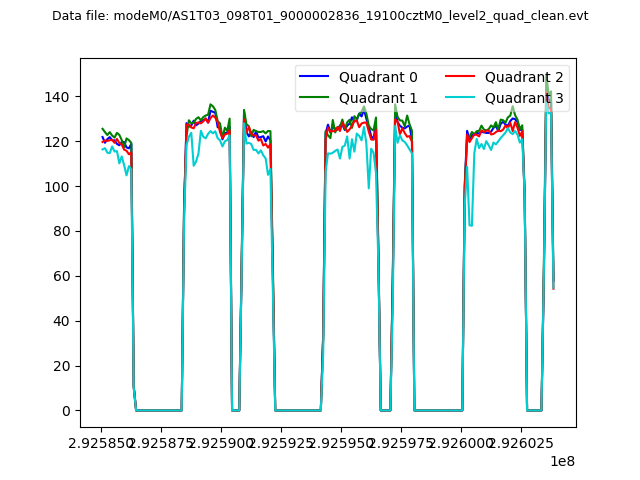 |
|
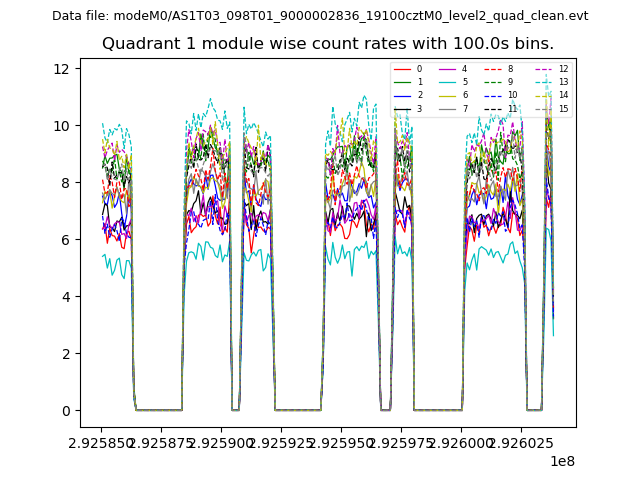
| Module-wise count rates for Quadrant A Data is divided into 100 sec bins |
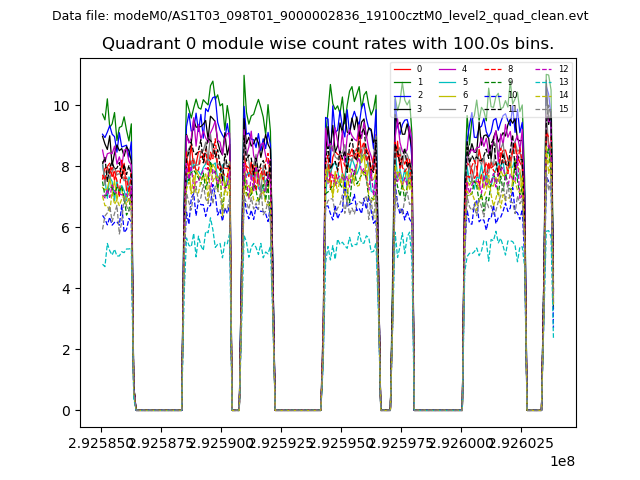 |
 |
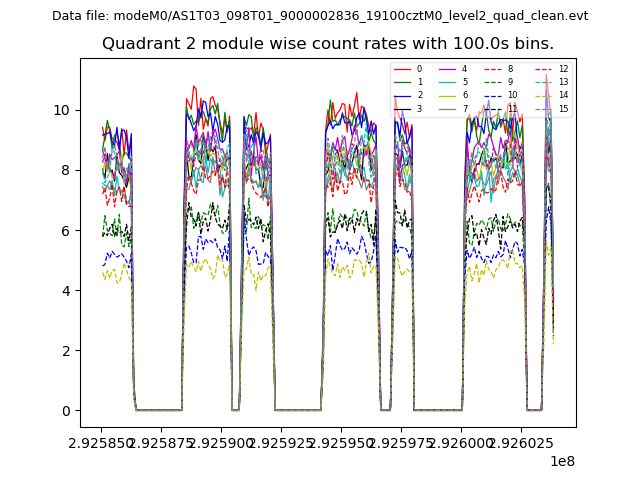
| Module-wise count rates for Quadrant B Data is divided into 100 sec bins |
 |
 |
| Module-wise count rates for Quadrant C Data is divided into 100 sec bins |
 |
 |
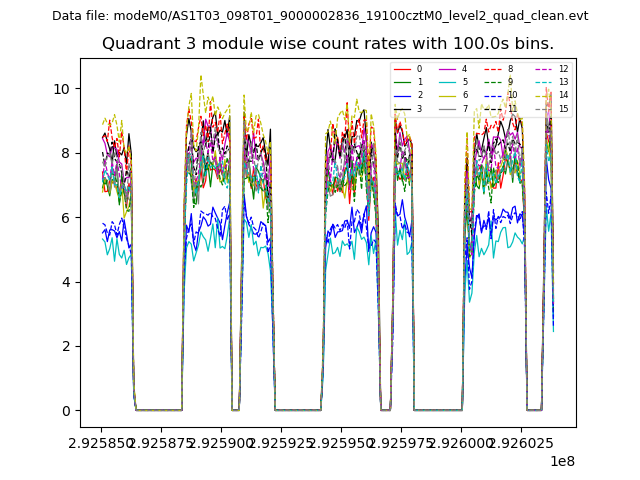
| Module-wise count rates for Quadrant D Data is divided into 100 sec bins |
 |
 |
| Parameter | Plot |
|---|---|
| CZT HV Monitor | 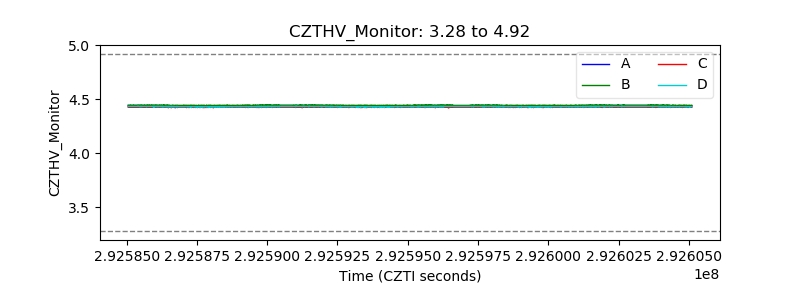 |
| D_VDD | 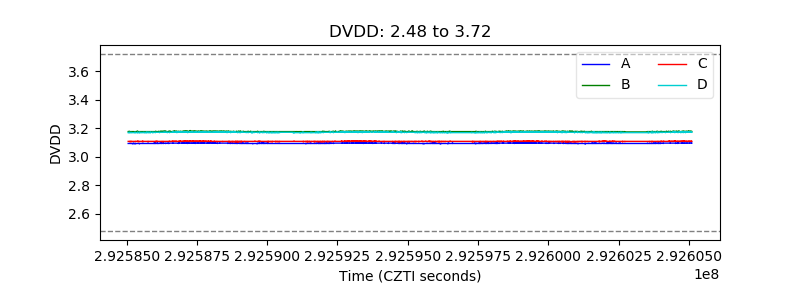 |
| Temperature 1 | 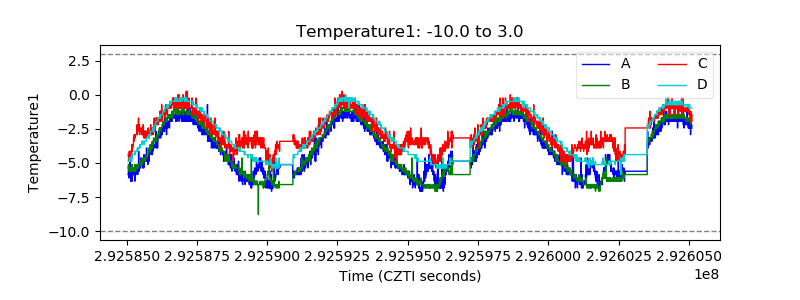 |
| Veto HV Monitor | 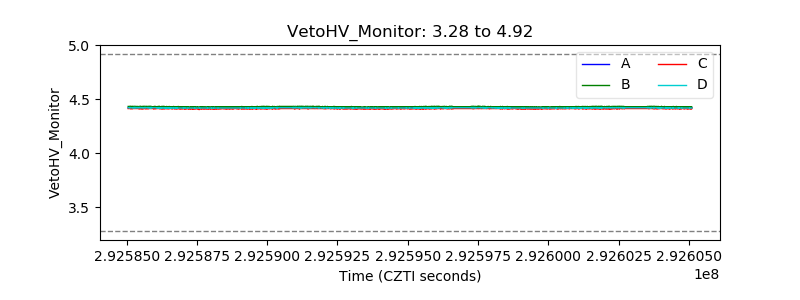 |
| Veto LLD | 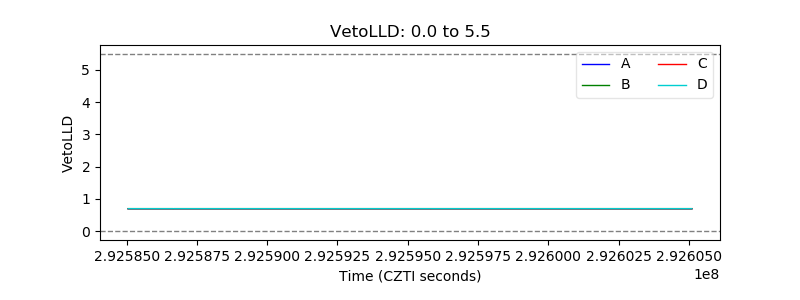 |
| Alpha Counter | 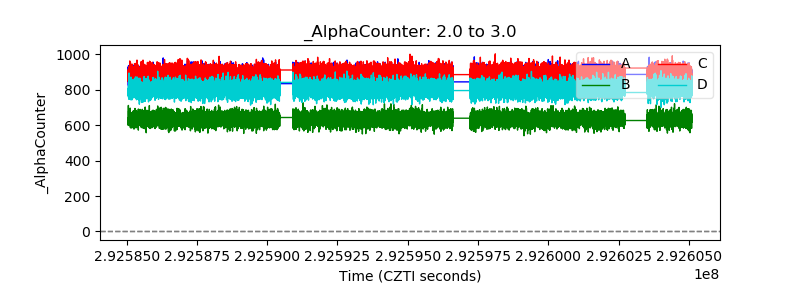 |
| _CPM_Rate | 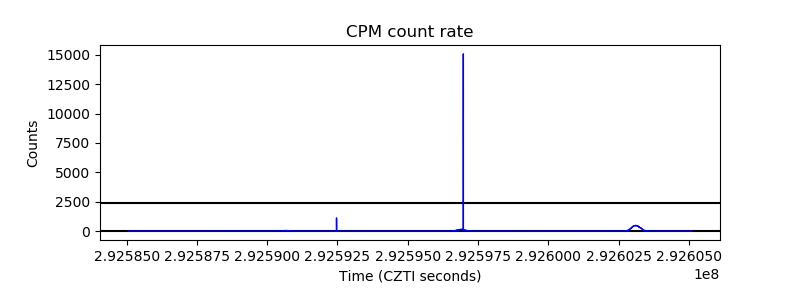 |
| CZT Counter |  |
| +2.5 Volts monitor | 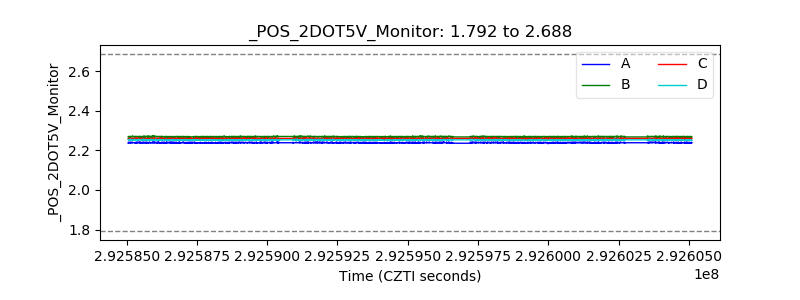 |
| +5 Volts monitor |  |
| _ROLL_ROT | 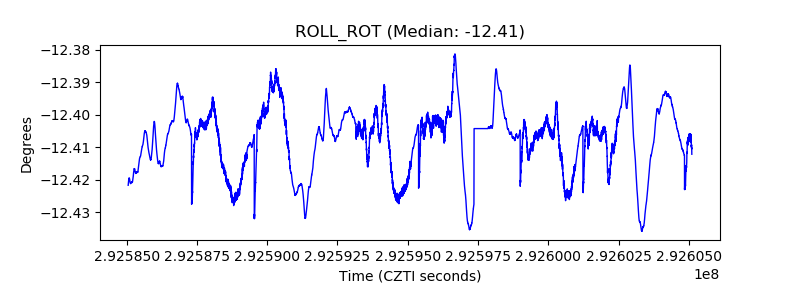 |
| _Roll_DEC | 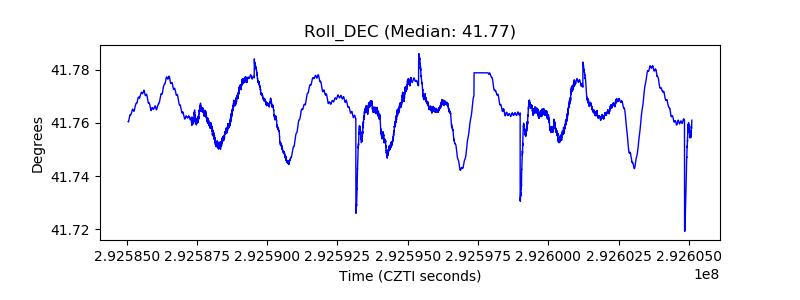 |
| _Roll_RA |  |
| Veto Counter | 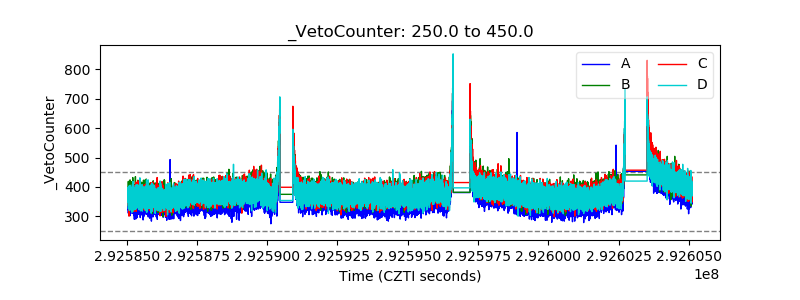 |