| Param | Original file | Final file |
|---|---|---|
| Filename | modeM0/AS1T03_098T01_9000002836_19101cztM0_level2.evt | modeM0/AS1T03_098T01_9000002836_19101cztM0_level2_quad_clean.evt |
| Size (bytes) | 567,984,960 | 63,979,200 |
| Size | 541.7 MB | 61.0 MB |
| Events in quadrant A | 3,235,059 | 374,546 |
| Events in quadrant B | 3,334,774 | 379,845 |
| Events in quadrant C | 3,258,309 | 370,931 |
| Events in quadrant D | 6,930,793 | 356,518 |
| Mode M9 | |||
|---|---|---|---|
| Quadrant | BADHDUFLAG | Total packets | Discarded packets |
| A | 0 | 9 | 0 |
| B | 0 | 9 | 0 |
| C | 0 | 9 | 0 |
| D | 0 | 9 | 0 |
| Mode M0 | |||
|---|---|---|---|
| Quadrant | BADHDUFLAG | Total packets | Discarded packets |
| A | 0 | 13548 | 1 |
| B | 0 | 14040 | 1 |
| C | 0 | 13711 | 1 |
| D | 0 | 24955 | 1 |
| Mode SS | |||
|---|---|---|---|
| Quadrant | BADHDUFLAG | Total packets | Discarded packets |
| A | 0 | 134 | 0 |
| B | 0 | 134 | 0 |
| C | 0 | 134 | 0 |
| D | 0 | 134 | 0 |
| Quadrant | Total seconds | Saturated seconds | Saturation percentage |
|---|---|---|---|
| A | 6520 | 65 | 0.996933% |
| B | 6521 | 70 | 1.073455% |
| C | 6520 | 101 | 1.549080% |
| D | 6520 | 1385 | 21.242331% |
Noise dominated data is calculated using 1-second bins in cleaned event files. If a bin has >2000 counts, and if more than 50% of those come from <1% of pixels, then it is considered to be noise-dominated and hence unusable.
| Quadrant | # 1 sec bins | Bins with >0 counts | Bins with >2000 counts | High rate bins dominated by noise | Noise dominated (total time) | Noise dominated (detector-on time) | Marked lightcurve |
|---|---|---|---|---|---|---|---|
| A | 7445 | 6520 | 0 | 0 | 0.00% | 0.00% | 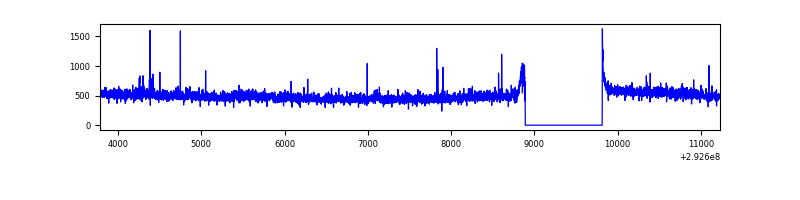 |
| B | 7446 | 6521 | 6 | 6 | 0.08% | 0.09% | 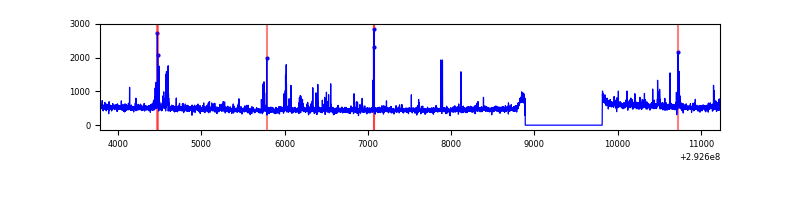 |
| C | 7445 | 6520 | 8 | 8 | 0.11% | 0.12% | 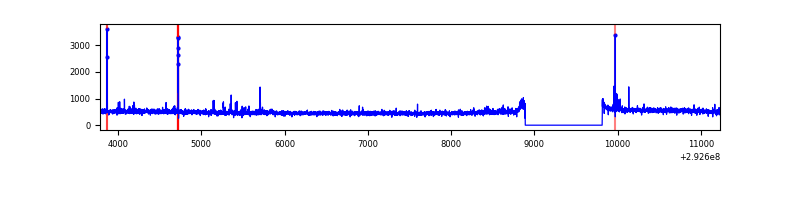 |
| D | 7445 | 6520 | 1014 | 1014 | 13.62% | 15.55% | 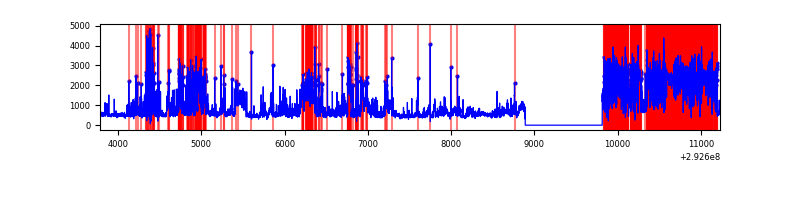 |
Top three noisy pixels from each quadrant. If the there are fewer than three noisy pixels in the level2.evt file, extra rows are filled as -1
| Pixel properties | Quadrant properties | ||||||
|---|---|---|---|---|---|---|---|
| Quadrant | DetID | PixID | Counts | Sigma | Mean | Median | Sigma |
| A | 8 | 192 | 88750 | 539.15 | 805 | 788 | 163.1 |
| A | 4 | 2 | 33311 | 199.34 | 805 | 788 | 163.1 |
| A | 11 | 47 | 7588 | 41.68 | 805 | 788 | 163.1 |
| B | 3 | 112 | 57690 | 369.72 | 803 | 783 | 153.9 |
| B | 4 | 216 | 44192 | 282.03 | 803 | 783 | 153.9 |
| B | 7 | 220 | 43736 | 279.06 | 803 | 783 | 153.9 |
| C | 14 | 238 | 121258 | 661.66 | 774 | 778 | 182.1 |
| C | 3 | 233 | 61124 | 331.41 | 774 | 778 | 182.1 |
| C | 0 | 207 | 57787 | 313.09 | 774 | 778 | 182.1 |
| D | 7 | 238 | 3062925 | 17849.89 | 699 | 678 | 171.6 |
| D | 11 | 176 | 729137 | 4246.2 | 699 | 678 | 171.6 |
| D | 1 | 52 | 281242 | 1635.41 | 699 | 678 | 171.6 |
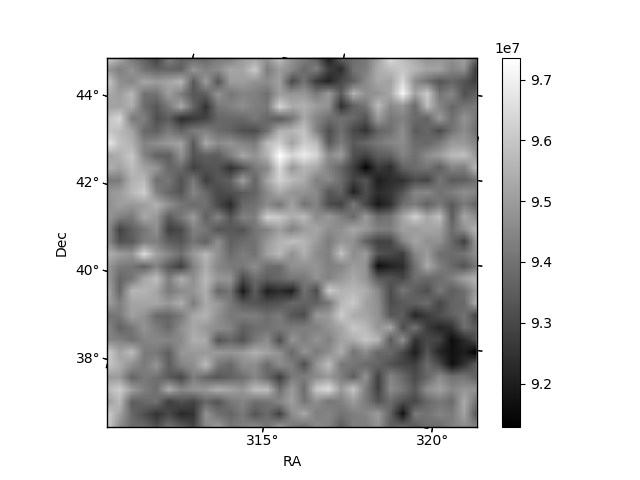
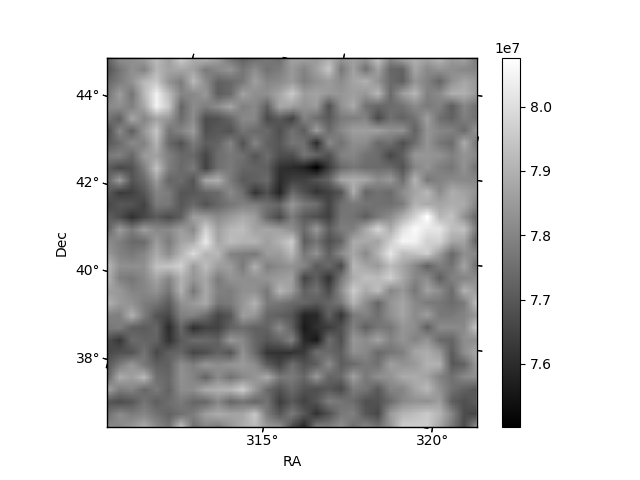
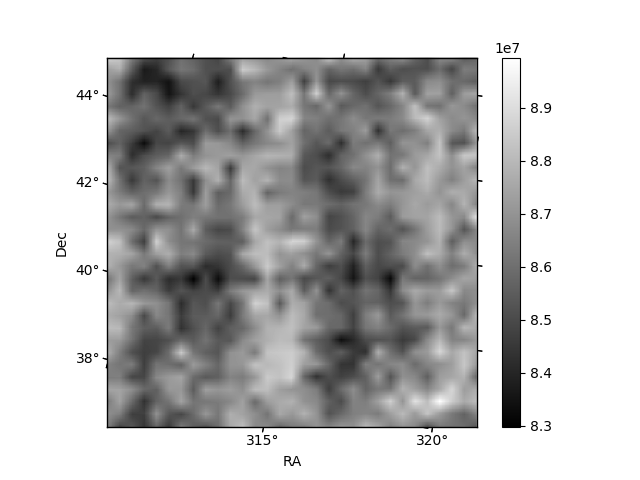
Histogram calculated using DETX and DETY for each event in the final _common_clean file
| Quadrant A | 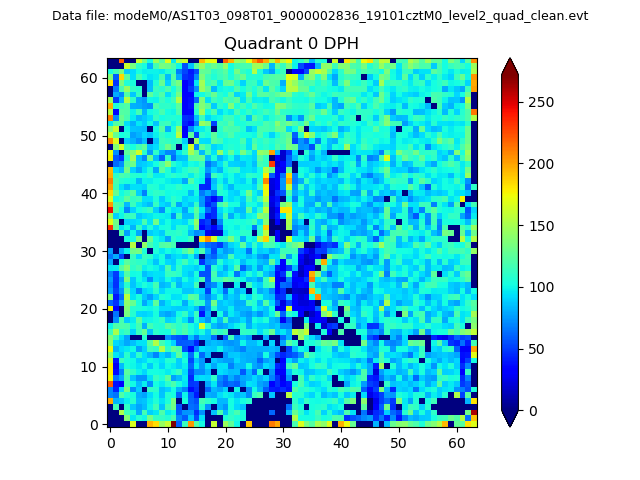 |
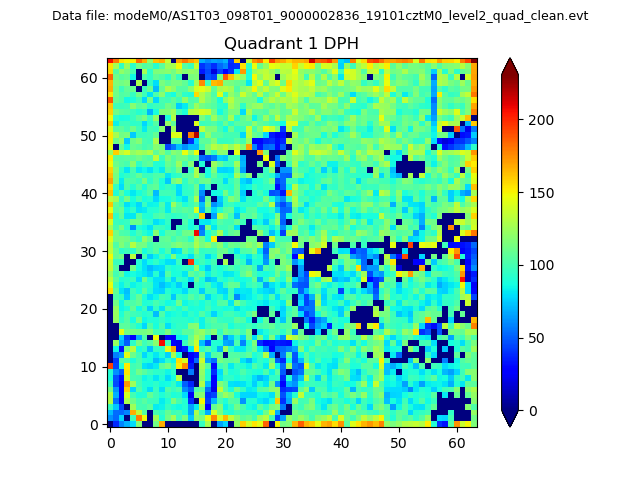 |
Quadrant B |
|---|---|---|---|
| Quadrant D | 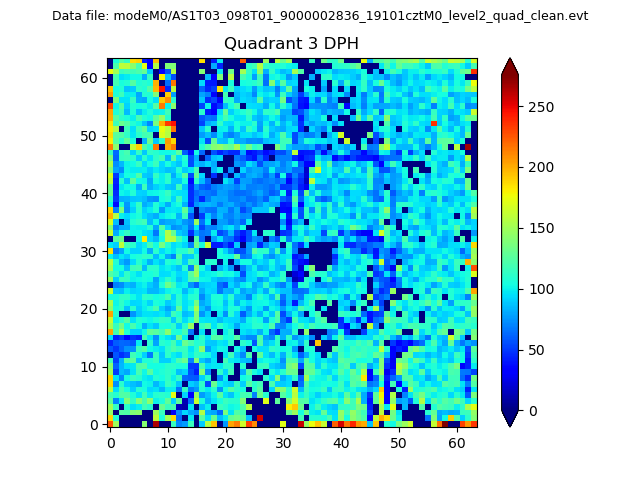 |
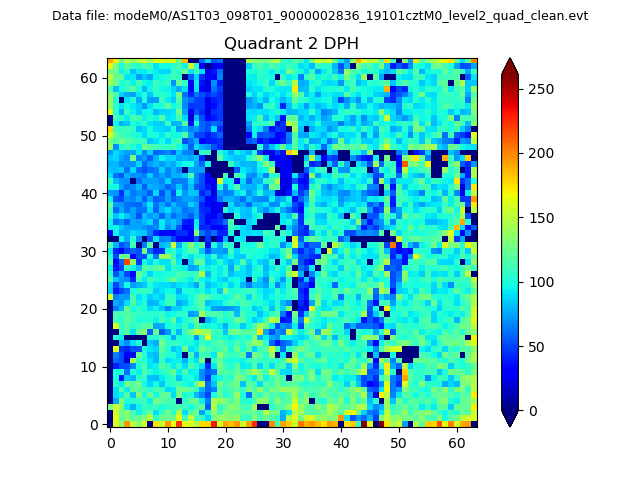 |
Quadrant C |
| Plot type | Count rate plots | Images |
|---|---|---|
| Comparison with Poisson distribution Blue bars denote a histogram of data divided into 1 sec bins. Red curve is a Poisson curve with rate = median count rate of data. |
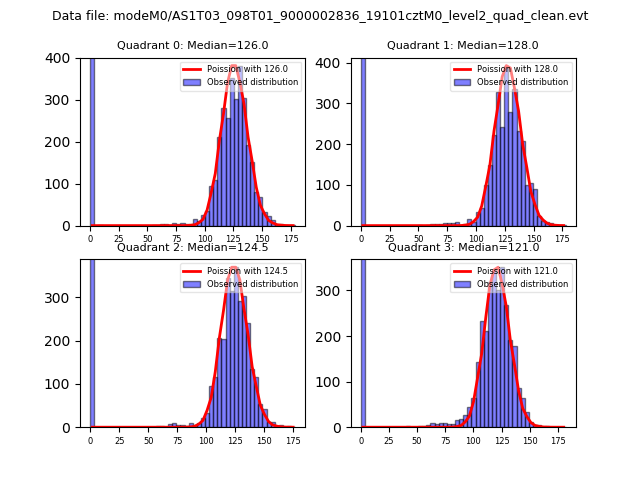 |
 |
| Quadrant-wise count rates Data is divided into 100 sec bins |
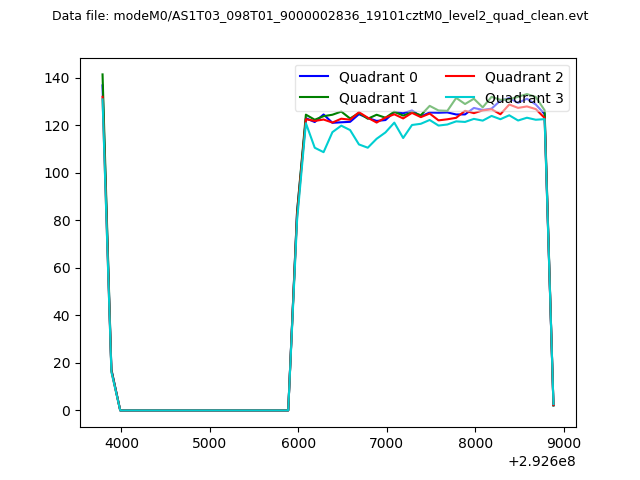 |
|
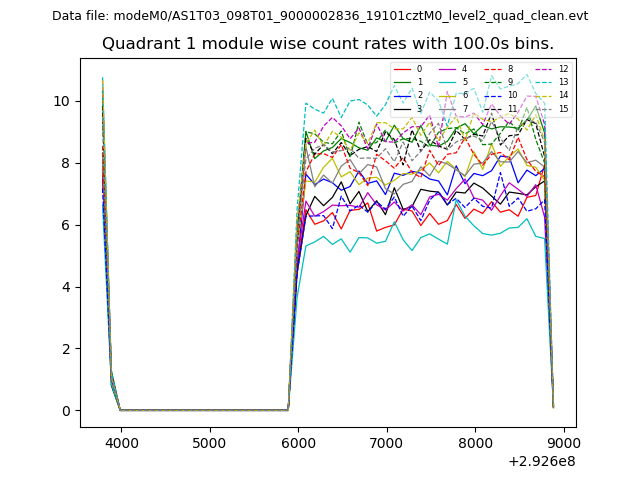
| Module-wise count rates for Quadrant A Data is divided into 100 sec bins |
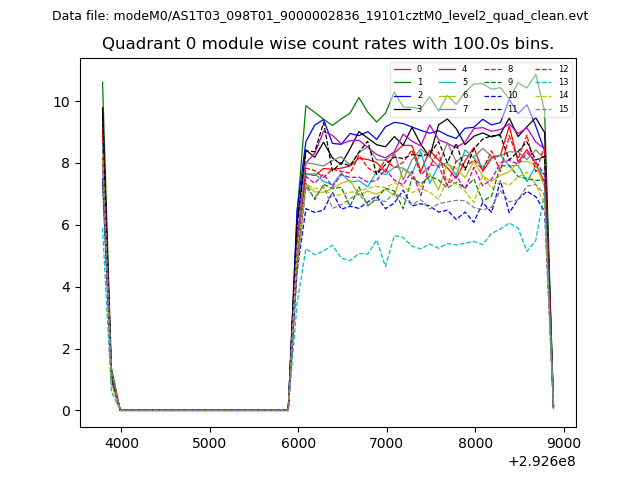 |
 |
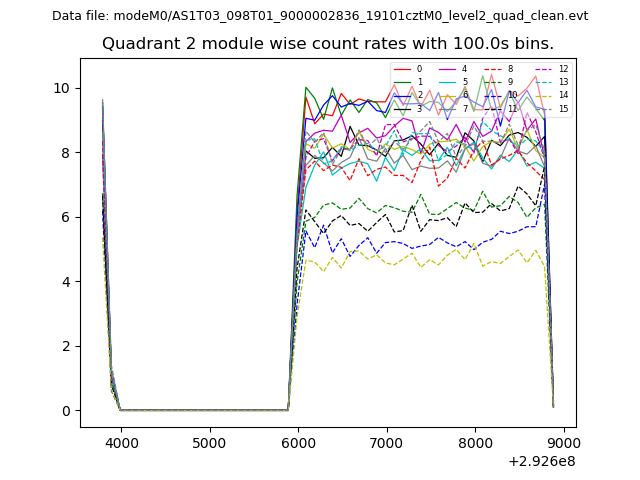
| Module-wise count rates for Quadrant B Data is divided into 100 sec bins |
 |
 |
| Module-wise count rates for Quadrant C Data is divided into 100 sec bins |
 |
 |
| Module-wise count rates for Quadrant D Data is divided into 100 sec bins |
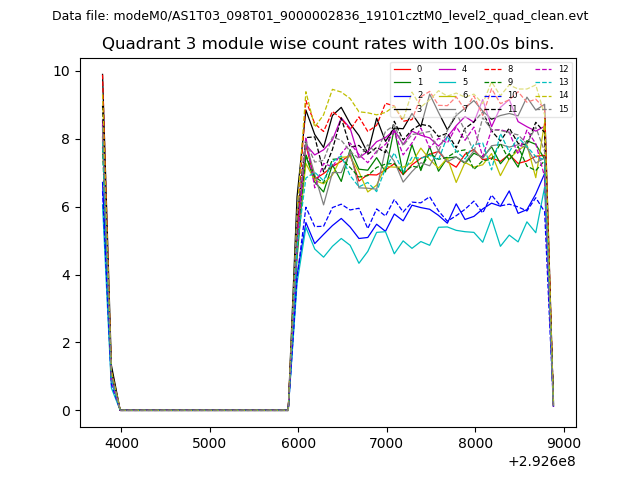 |
 |
| Parameter | Plot |
|---|---|
| CZT HV Monitor | 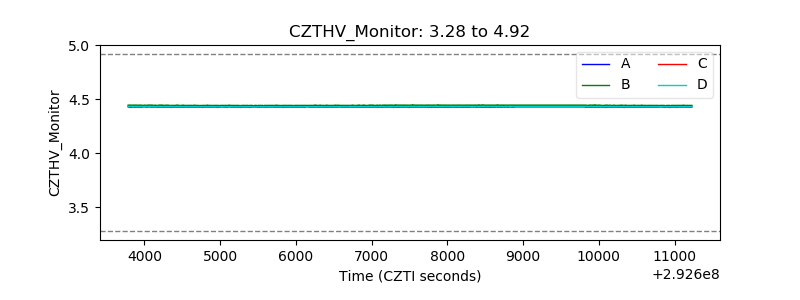 |
| D_VDD | 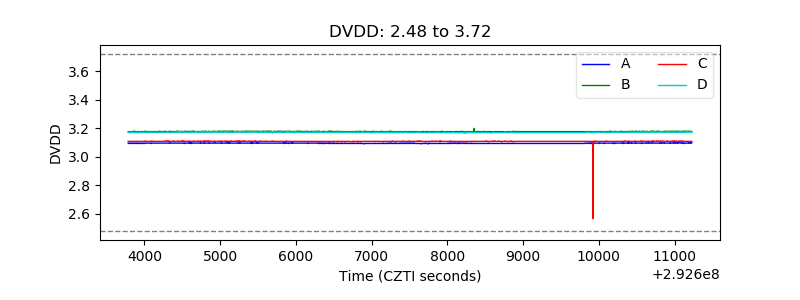 |
| Temperature 1 |  |
| Veto HV Monitor | 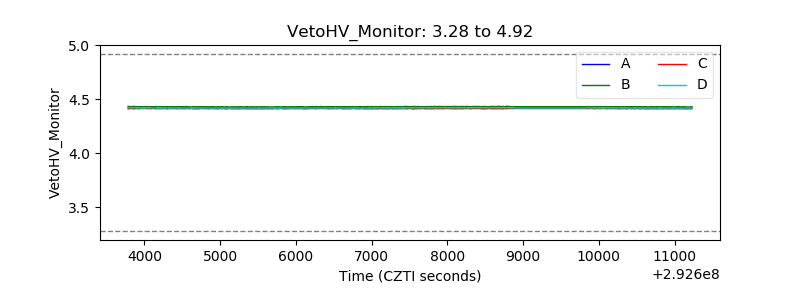 |
| Veto LLD | 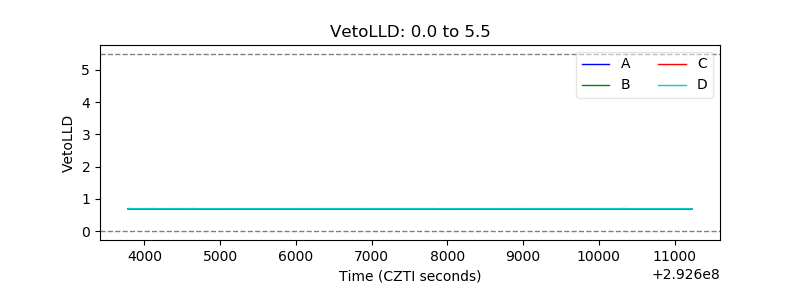 |
| Alpha Counter | 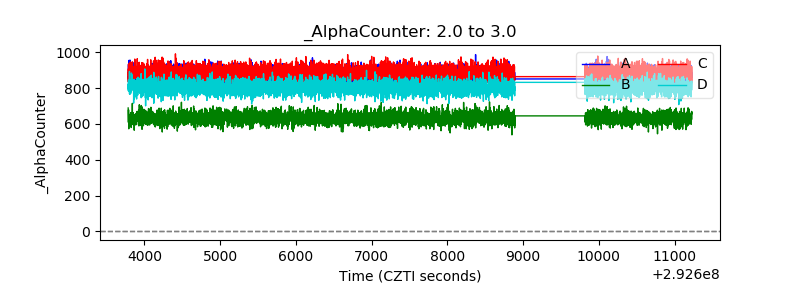 |
| _CPM_Rate | 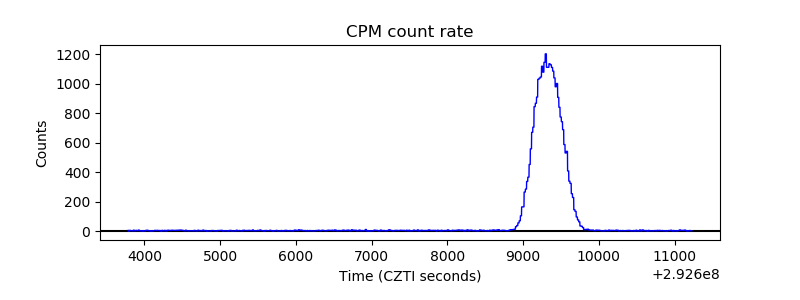 |
| CZT Counter |  |
| +2.5 Volts monitor |  |
| +5 Volts monitor |  |
| _ROLL_ROT | 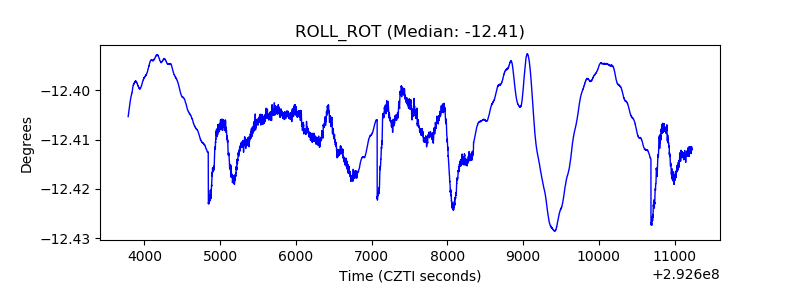 |
| _Roll_DEC | 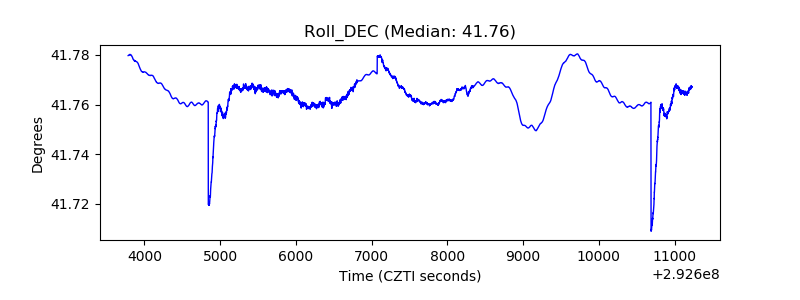 |
| _Roll_RA |  |
| Veto Counter | 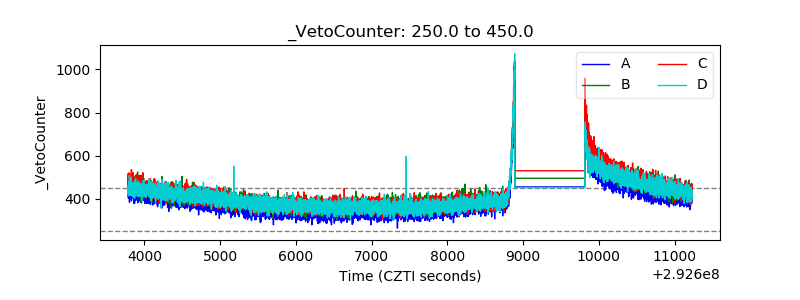 |