| Param | Original file | Final file |
|---|---|---|
| Filename | modeM0/AS1T03_098T01_9000002836_19103cztM0_level2.evt | modeM0/AS1T03_098T01_9000002836_19103cztM0_level2_quad_clean.evt |
| Size (bytes) | 546,145,920 | 67,861,440 |
| Size | 520.8 MB | 64.7 MB |
| Events in quadrant A | 3,169,943 | 404,392 |
| Events in quadrant B | 3,428,098 | 409,112 |
| Events in quadrant C | 3,293,825 | 400,863 |
| Events in quadrant D | 6,212,567 | 392,436 |
| Mode M9 | |||
|---|---|---|---|
| Quadrant | BADHDUFLAG | Total packets | Discarded packets |
| A | 0 | 11 | 0 |
| B | 0 | 11 | 0 |
| C | 0 | 11 | 0 |
| D | 0 | 11 | 0 |
| Mode M0 | |||
|---|---|---|---|
| Quadrant | BADHDUFLAG | Total packets | Discarded packets |
| A | 0 | 13607 | 1 |
| B | 0 | 14459 | 1 |
| C | 0 | 13932 | 1 |
| D | 0 | 22861 | 1 |
| Mode SS | |||
|---|---|---|---|
| Quadrant | BADHDUFLAG | Total packets | Discarded packets |
| A | 0 | 130 | 0 |
| B | 0 | 130 | 0 |
| C | 0 | 130 | 0 |
| D | 0 | 130 | 0 |
| Quadrant | Total seconds | Saturated seconds | Saturation percentage |
|---|---|---|---|
| A | 6420 | 50 | 0.778816% |
| B | 6421 | 65 | 1.012303% |
| C | 6421 | 94 | 1.463946% |
| D | 6421 | 1328 | 20.682137% |
Noise dominated data is calculated using 1-second bins in cleaned event files. If a bin has >2000 counts, and if more than 50% of those come from <1% of pixels, then it is considered to be noise-dominated and hence unusable.
| Quadrant | # 1 sec bins | Bins with >0 counts | Bins with >2000 counts | High rate bins dominated by noise | Noise dominated (total time) | Noise dominated (detector-on time) | Marked lightcurve |
|---|---|---|---|---|---|---|---|
| A | 7506 | 6421 | 0 | 0 | 0.00% | 0.00% | 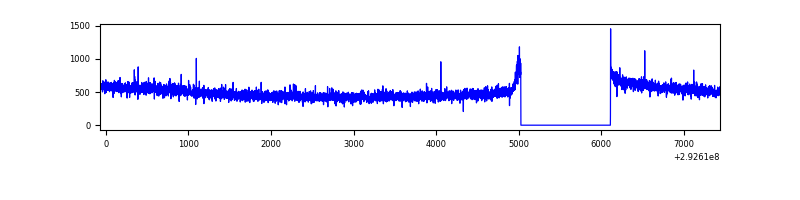 |
| B | 7507 | 6423 | 8 | 8 | 0.11% | 0.12% | 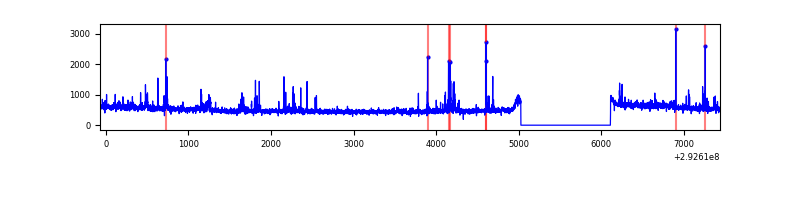 |
| C | 7507 | 6422 | 1 | 1 | 0.01% | 0.02% | 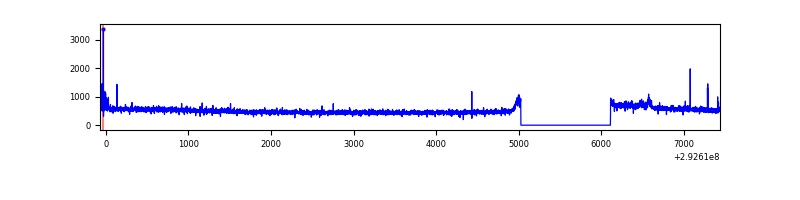 |
| D | 7507 | 6423 | 970 | 970 | 12.92% | 15.10% | 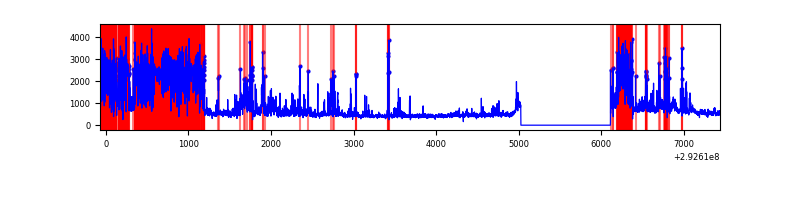 |
Top three noisy pixels from each quadrant. If the there are fewer than three noisy pixels in the level2.evt file, extra rows are filled as -1
| Pixel properties | Quadrant properties | ||||||
|---|---|---|---|---|---|---|---|
| Quadrant | DetID | PixID | Counts | Sigma | Mean | Median | Sigma |
| A | 11 | 47 | 9661 | 53.89 | 818 | 801 | 164.4 |
| A | 4 | 2 | 7400 | 40.14 | 818 | 801 | 164.4 |
| A | 0 | 226 | 7080 | 38.19 | 818 | 801 | 164.4 |
| B | 3 | 112 | 97266 | 620.27 | 816 | 798 | 155.5 |
| B | 4 | 216 | 57998 | 367.78 | 816 | 798 | 155.5 |
| B | 12 | 111 | 17737 | 108.91 | 816 | 798 | 155.5 |
| C | 14 | 238 | 123569 | 662.87 | 793 | 798 | 185.2 |
| C | 3 | 233 | 55011 | 292.71 | 793 | 798 | 185.2 |
| C | 0 | 207 | 26037 | 136.27 | 793 | 798 | 185.2 |
| D | 7 | 238 | 2479828 | 14420.59 | 711 | 692 | 171.9 |
| D | 11 | 176 | 576797 | 3351.08 | 711 | 692 | 171.9 |
| D | 12 | 218 | 172667 | 1000.34 | 711 | 692 | 171.9 |
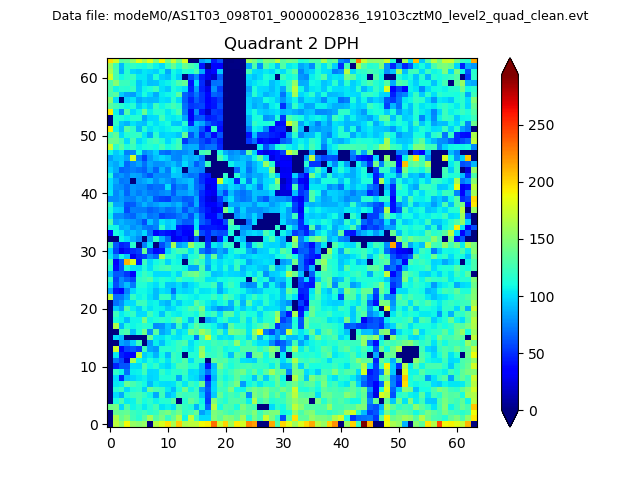
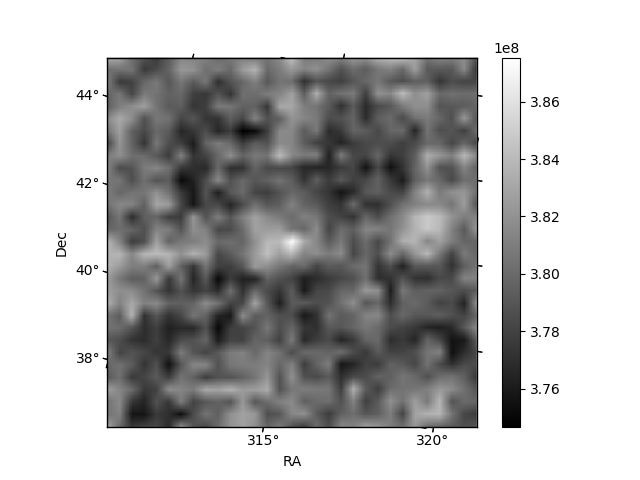
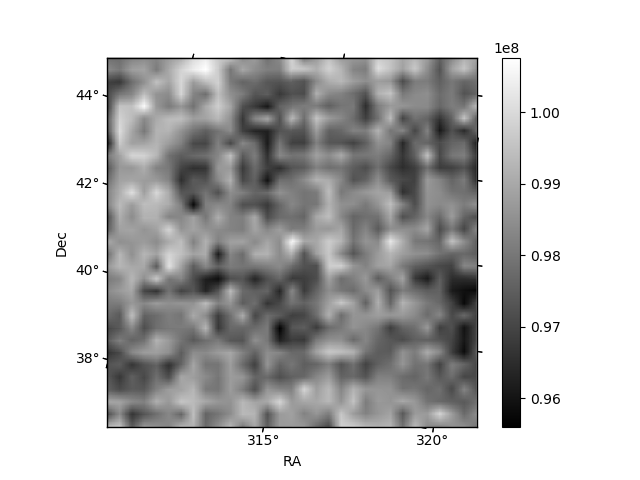
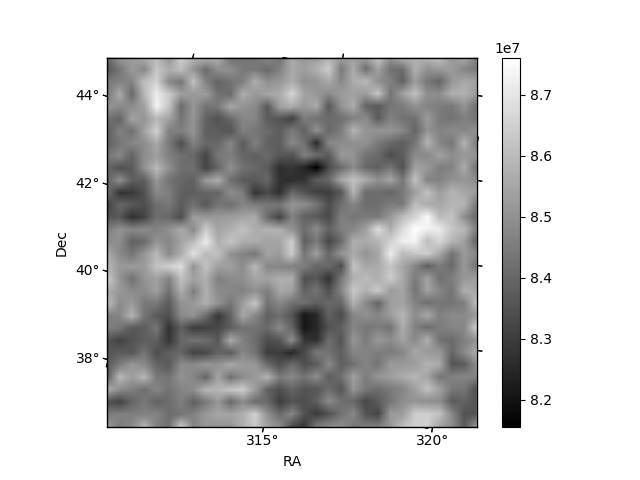
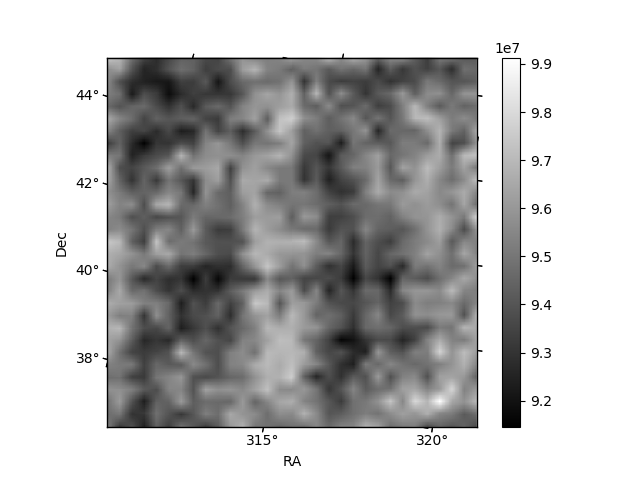
Histogram calculated using DETX and DETY for each event in the final _common_clean file
| Quadrant A | 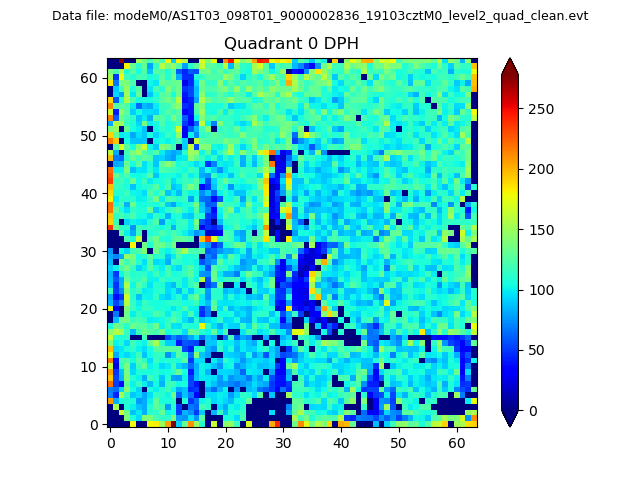 |
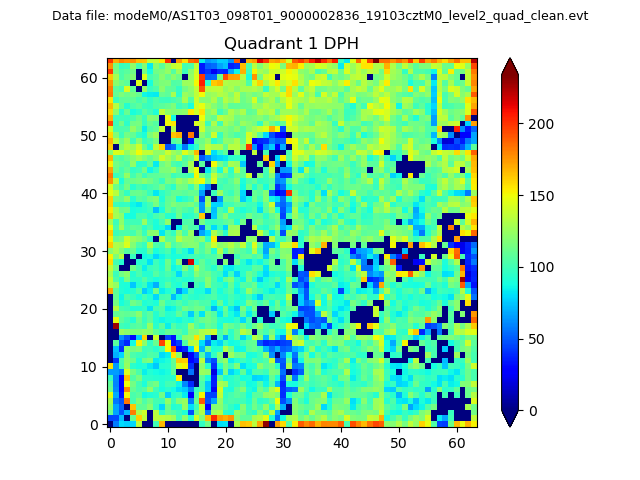 |
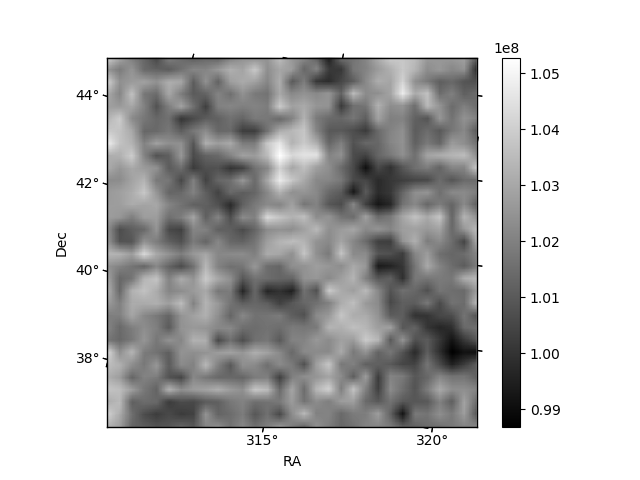
Quadrant B |
|---|---|---|---|
| Quadrant D | 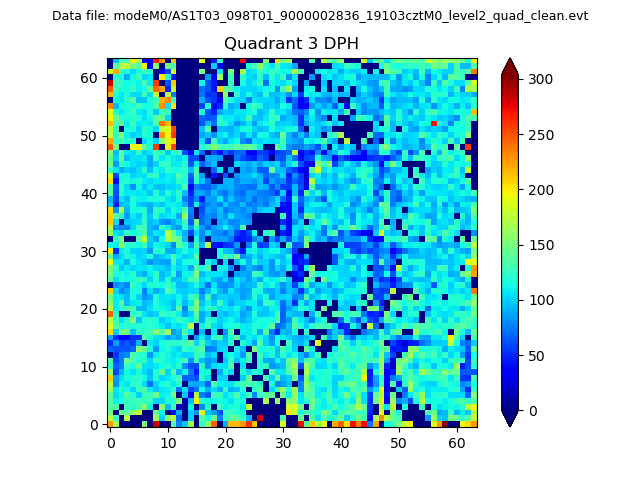 |
 |
Quadrant C |
| Plot type | Count rate plots | Images |
|---|---|---|
| Comparison with Poisson distribution Blue bars denote a histogram of data divided into 1 sec bins. Red curve is a Poisson curve with rate = median count rate of data. |
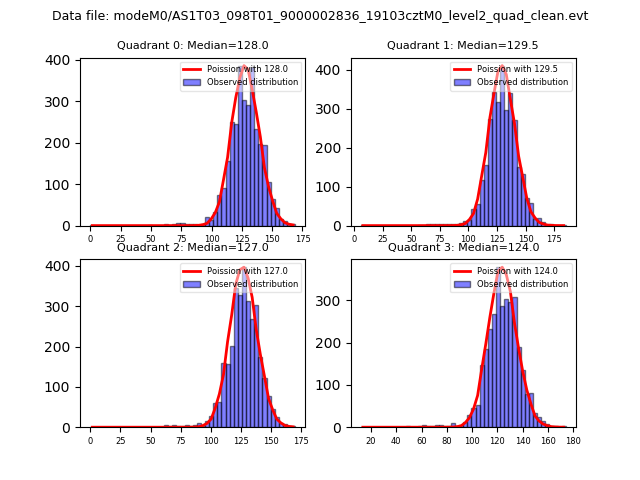 |
 |
| Quadrant-wise count rates Data is divided into 100 sec bins |
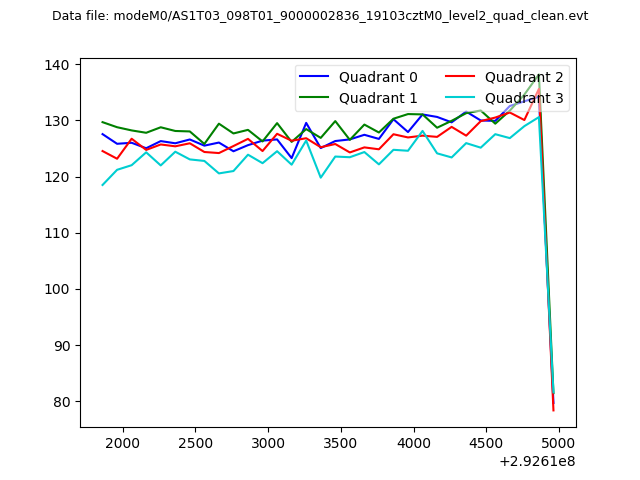 |
|
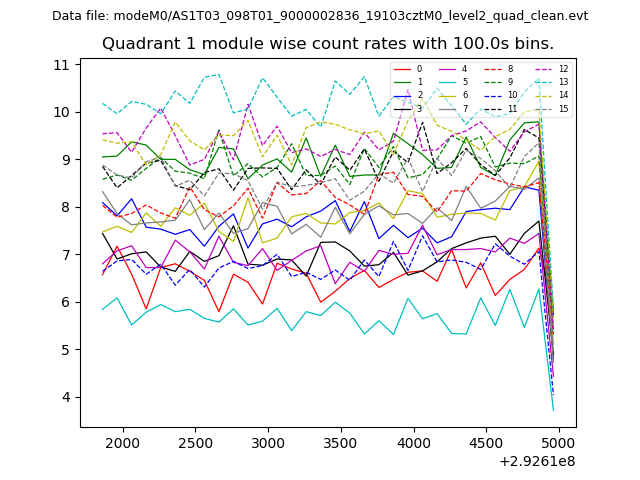
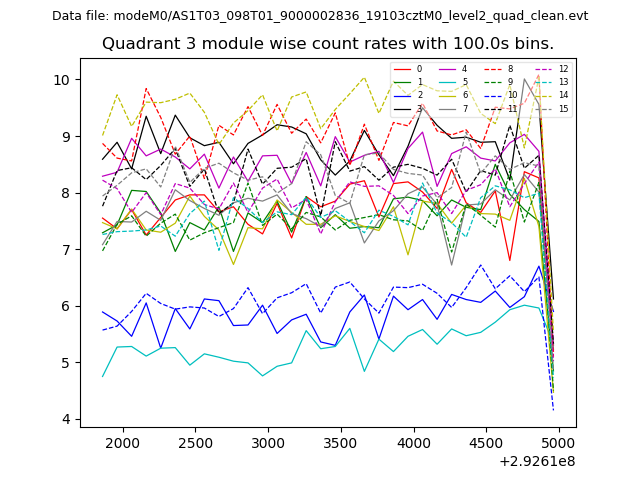
| Module-wise count rates for Quadrant A Data is divided into 100 sec bins |
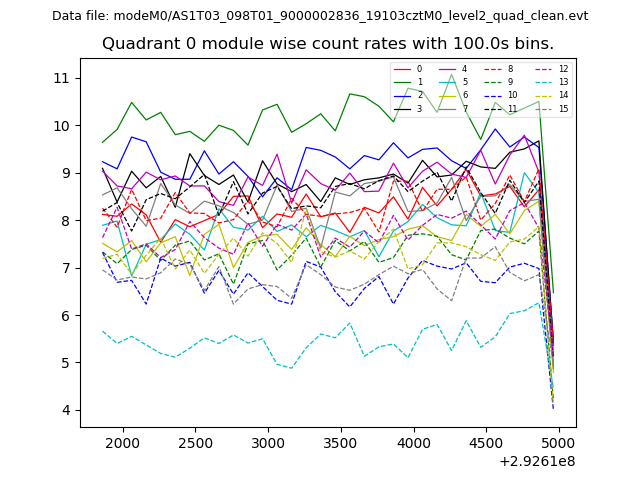 |
 |
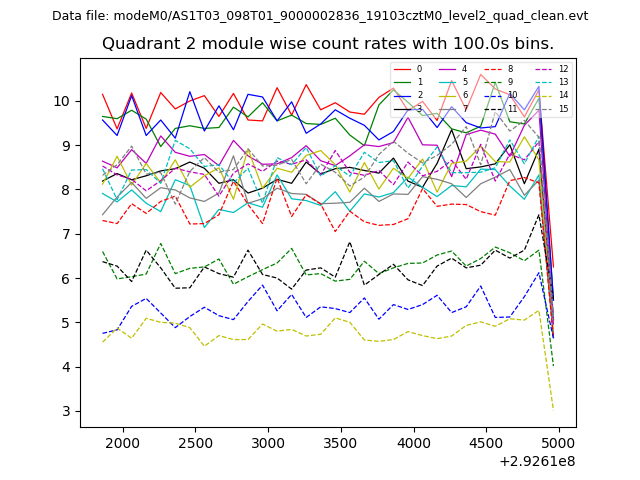
| Module-wise count rates for Quadrant B Data is divided into 100 sec bins |
 |
 |
| Module-wise count rates for Quadrant C Data is divided into 100 sec bins |
 |
 |
| Module-wise count rates for Quadrant D Data is divided into 100 sec bins |
 |
 |
| Parameter | Plot |
|---|---|
| CZT HV Monitor | 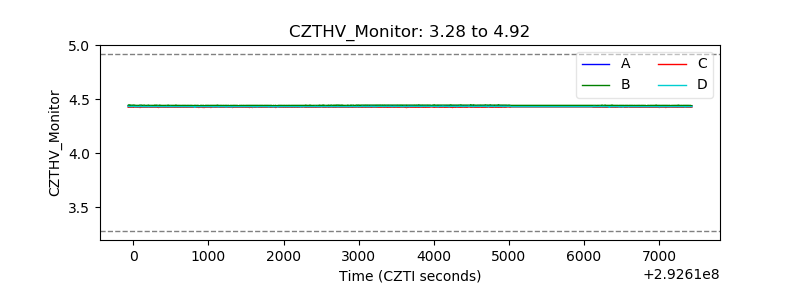 |
| D_VDD | 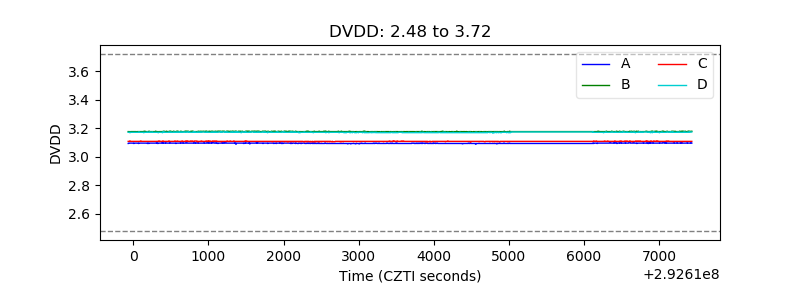 |
| Temperature 1 | 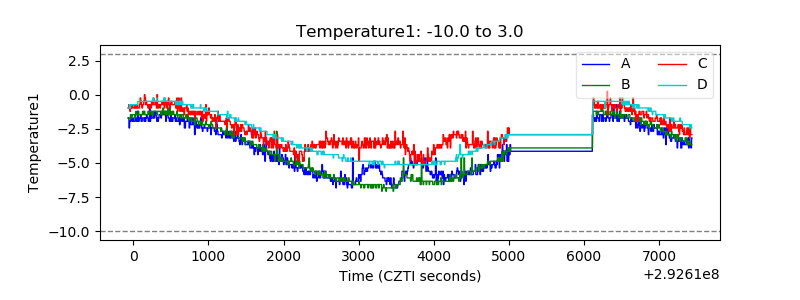 |
| Veto HV Monitor | 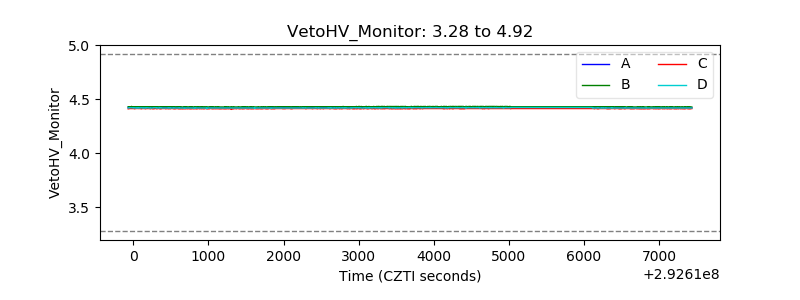 |
| Veto LLD | 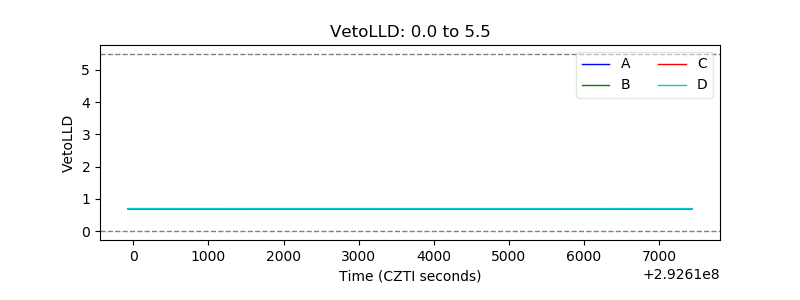 |
| Alpha Counter | 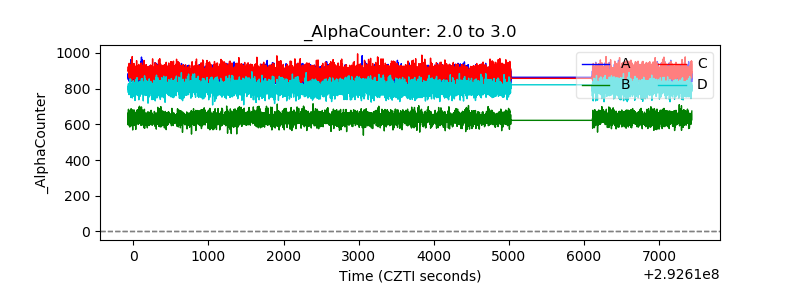 |
| _CPM_Rate | 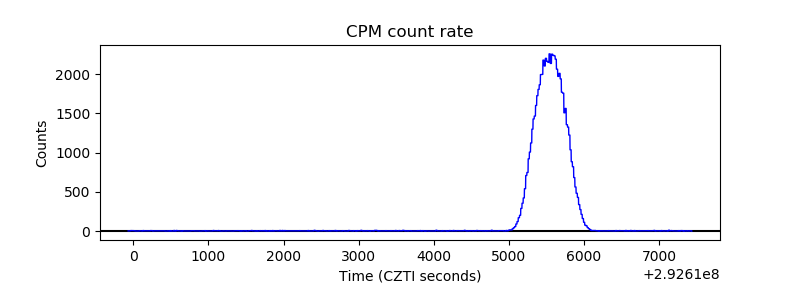 |
| CZT Counter |  |
| +2.5 Volts monitor |  |
| +5 Volts monitor |  |
| _ROLL_ROT | 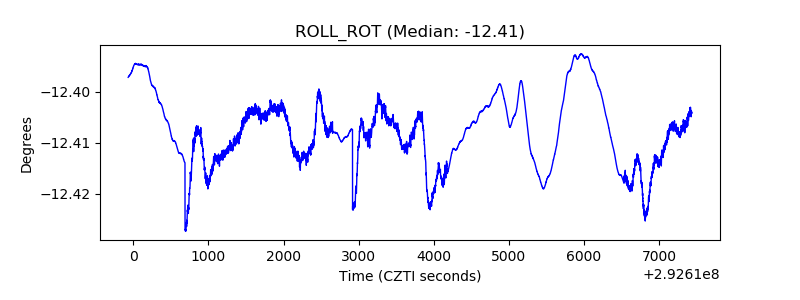 |
| _Roll_DEC | 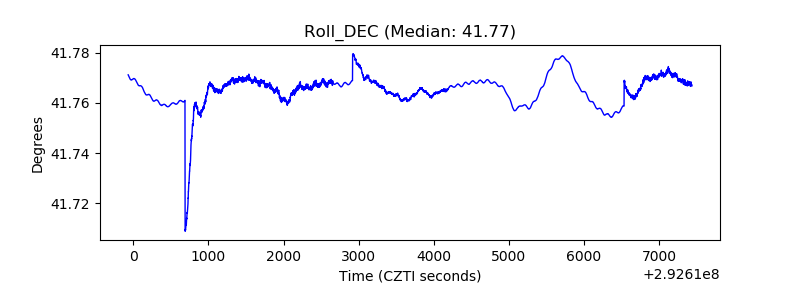 |
| _Roll_RA | 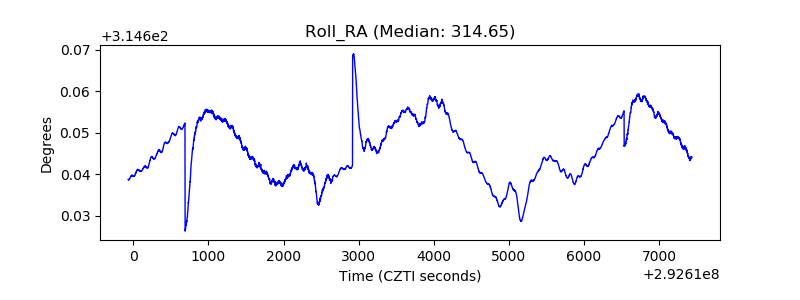 |
| Veto Counter | 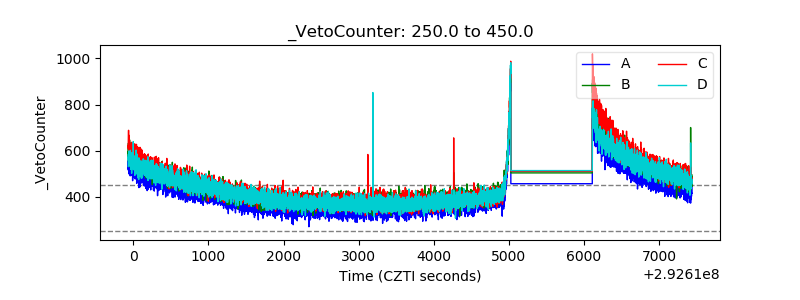 |