| Param | Original file | Final file |
|---|---|---|
| Filename | modeM0/AS1T03_098T01_9000002836_19105cztM0_level2.evt | modeM0/AS1T03_098T01_9000002836_19105cztM0_level2_quad_clean.evt |
| Size (bytes) | 497,309,760 | 91,431,360 |
| Size | 474.3 MB | 87.2 MB |
| Events in quadrant A | 3,191,072 | 586,659 |
| Events in quadrant B | 3,416,943 | 600,021 |
| Events in quadrant C | 3,303,599 | 590,386 |
| Events in quadrant D | 4,733,390 | 563,586 |
| Mode M9 | |||
|---|---|---|---|
| Quadrant | BADHDUFLAG | Total packets | Discarded packets |
| A | 0 | 13 | 0 |
| B | 0 | 13 | 0 |
| C | 0 | 13 | 0 |
| D | 0 | 13 | 0 |
| Mode M0 | |||
|---|---|---|---|
| Quadrant | BADHDUFLAG | Total packets | Discarded packets |
| A | 0 | 13497 | 1 |
| B | 0 | 14248 | 1 |
| C | 0 | 13906 | 1 |
| D | 0 | 18540 | 1 |
| Mode SS | |||
|---|---|---|---|
| Quadrant | BADHDUFLAG | Total packets | Discarded packets |
| A | 0 | 124 | 0 |
| B | 0 | 124 | 0 |
| C | 0 | 124 | 0 |
| D | 0 | 124 | 0 |
| Quadrant | Total seconds | Saturated seconds | Saturation percentage |
|---|---|---|---|
| A | 6136 | 48 | 0.782269% |
| B | 6136 | 68 | 1.108214% |
| C | 6136 | 100 | 1.629726% |
| D | 6137 | 400 | 6.517843% |
Noise dominated data is calculated using 1-second bins in cleaned event files. If a bin has >2000 counts, and if more than 50% of those come from <1% of pixels, then it is considered to be noise-dominated and hence unusable.
| Quadrant | # 1 sec bins | Bins with >0 counts | Bins with >2000 counts | High rate bins dominated by noise | Noise dominated (total time) | Noise dominated (detector-on time) | Marked lightcurve |
|---|---|---|---|---|---|---|---|
| A | 7421 | 6137 | 0 | 0 | 0.00% | 0.00% | 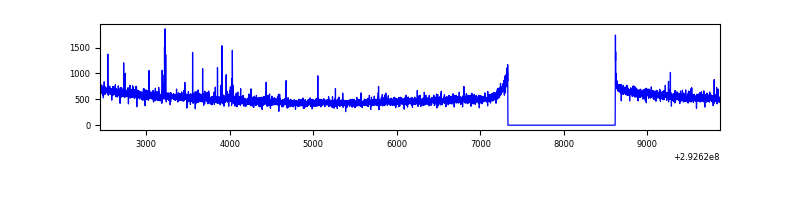 |
| B | 7421 | 6137 | 11 | 11 | 0.15% | 0.18% | 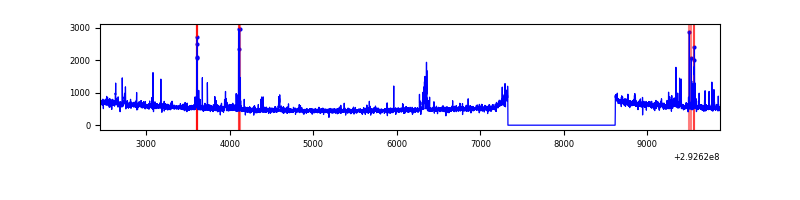 |
| C | 7421 | 6137 | 1 | 1 | 0.01% | 0.02% | 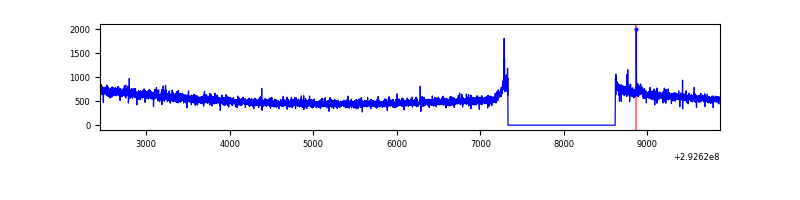 |
| D | 7422 | 6138 | 260 | 260 | 3.50% | 4.24% | 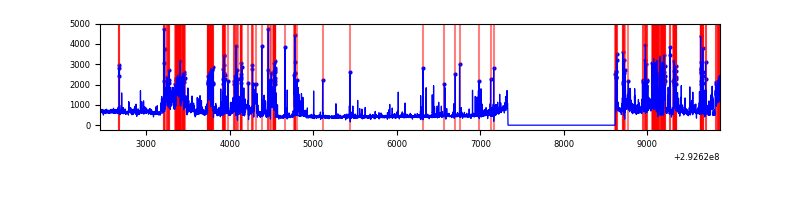 |
Top three noisy pixels from each quadrant. If the there are fewer than three noisy pixels in the level2.evt file, extra rows are filled as -1
| Pixel properties | Quadrant properties | ||||||
|---|---|---|---|---|---|---|---|
| Quadrant | DetID | PixID | Counts | Sigma | Mean | Median | Sigma |
| A | 4 | 2 | 44238 | 266.82 | 814 | 799 | 162.8 |
| A | 0 | 226 | 6913 | 37.55 | 814 | 799 | 162.8 |
| A | 8 | 192 | 6788 | 36.79 | 814 | 799 | 162.8 |
| B | 3 | 112 | 100737 | 655.68 | 819 | 801 | 152.4 |
| B | 7 | 220 | 46646 | 300.79 | 819 | 801 | 152.4 |
| B | 0 | 197 | 20347 | 128.24 | 819 | 801 | 152.4 |
| C | 14 | 238 | 125061 | 670.98 | 801 | 810 | 185.2 |
| C | 3 | 233 | 49335 | 262.05 | 801 | 810 | 185.2 |
| C | 0 | 207 | 9546 | 47.18 | 801 | 810 | 185.2 |
| D | 11 | 176 | 597368 | 3136.84 | 786 | 764 | 190.2 |
| D | 1 | 52 | 393634 | 2065.64 | 786 | 764 | 190.2 |
| D | 7 | 38 | 376131 | 1973.61 | 786 | 764 | 190.2 |
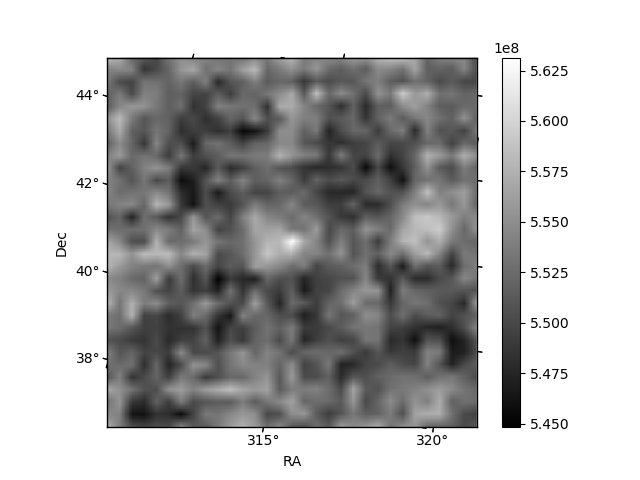
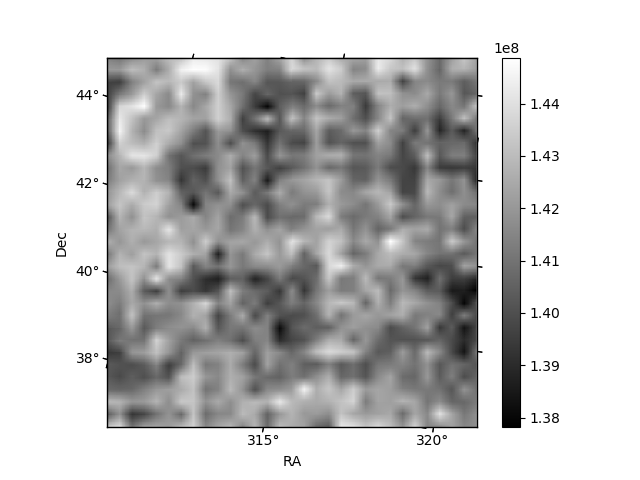
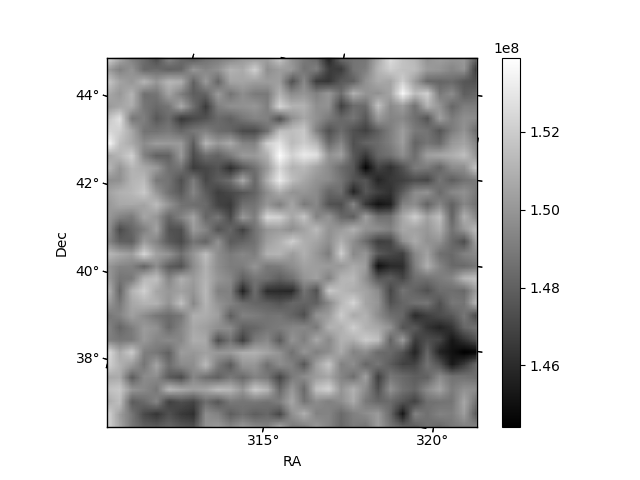
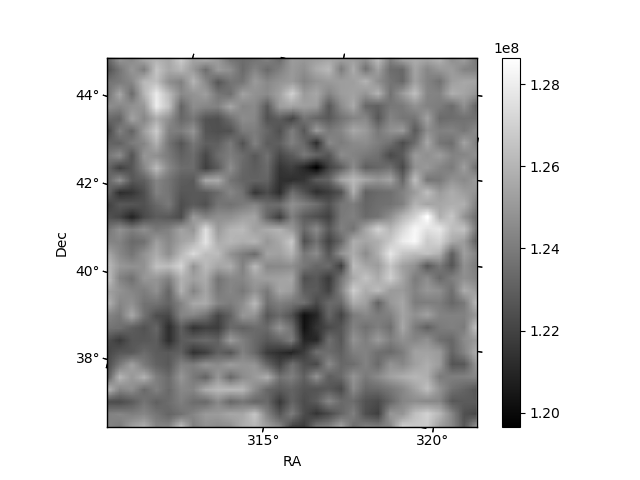
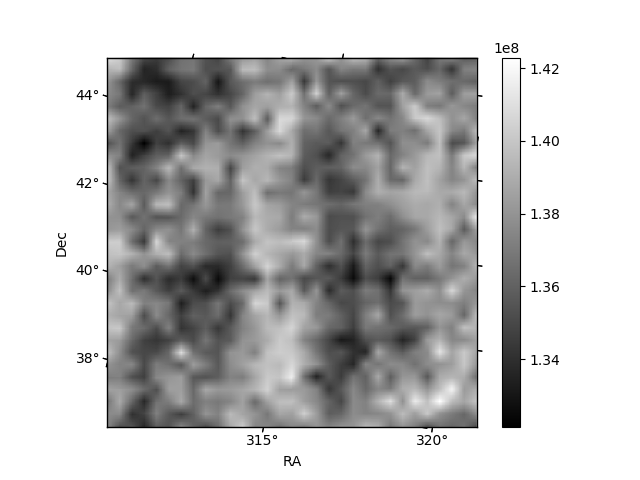
Histogram calculated using DETX and DETY for each event in the final _common_clean file
| Quadrant A | 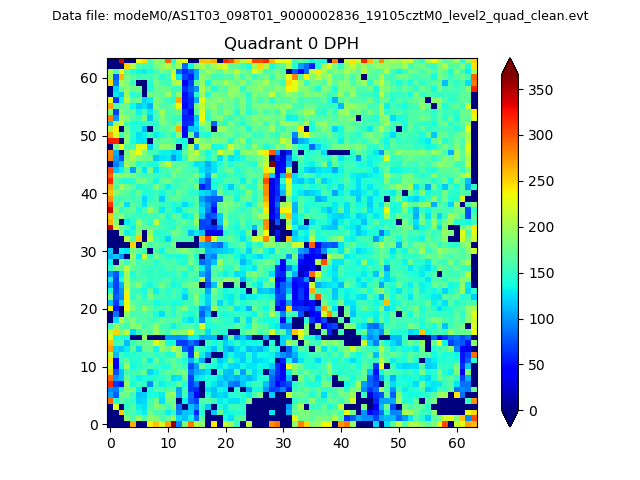 |
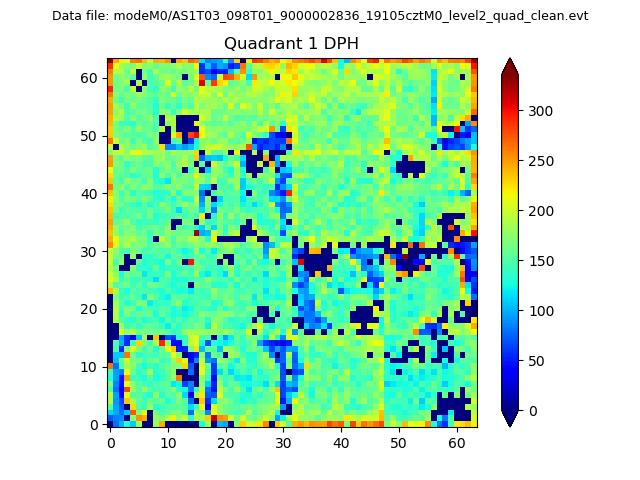 |
Quadrant B |
|---|---|---|---|
| Quadrant D | 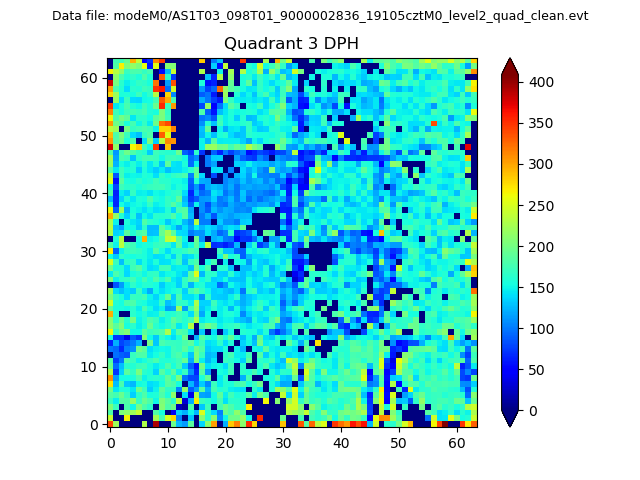 |
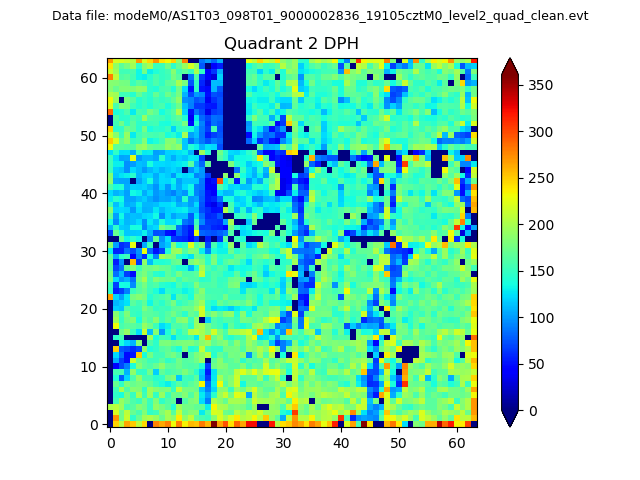 |
Quadrant C |
| Plot type | Count rate plots | Images |
|---|---|---|
| Comparison with Poisson distribution Blue bars denote a histogram of data divided into 1 sec bins. Red curve is a Poisson curve with rate = median count rate of data. |
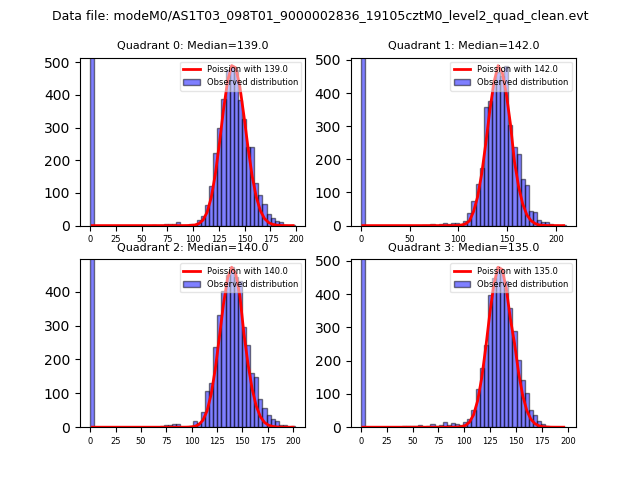 |
 |
| Quadrant-wise count rates Data is divided into 100 sec bins |
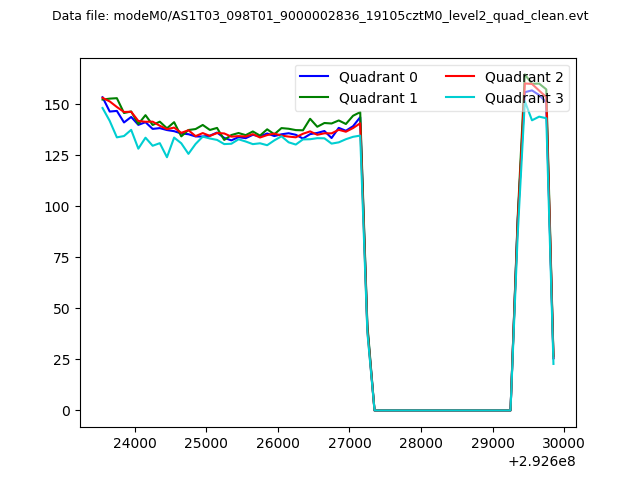 |
|
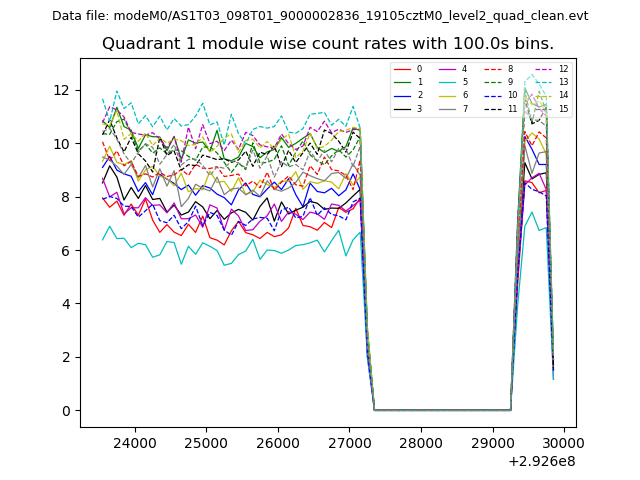
| Module-wise count rates for Quadrant A Data is divided into 100 sec bins |
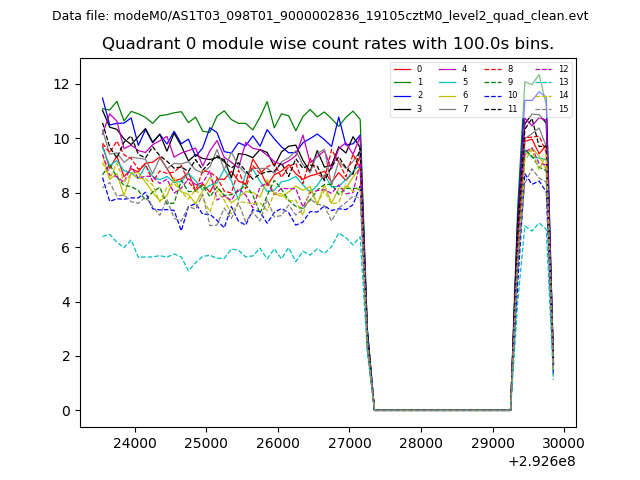 |
 |
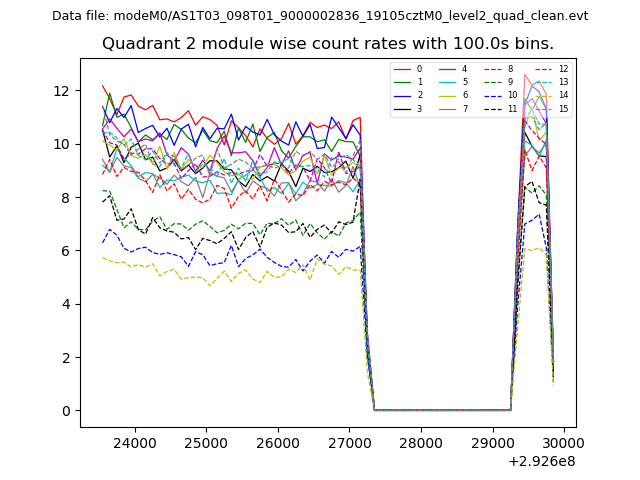
| Module-wise count rates for Quadrant B Data is divided into 100 sec bins |
 |
 |
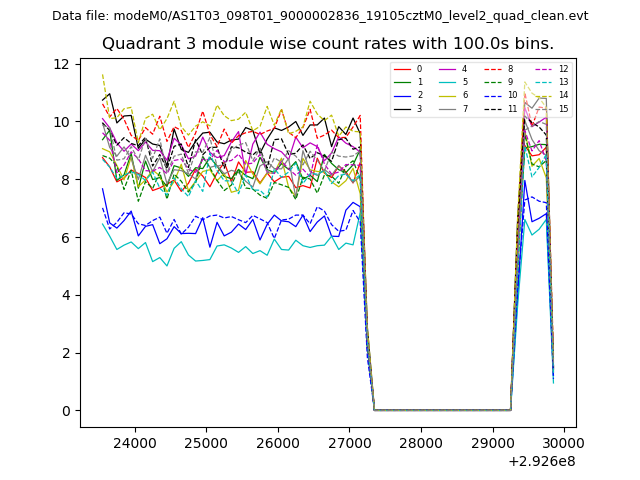
| Module-wise count rates for Quadrant C Data is divided into 100 sec bins |
 |
 |
| Module-wise count rates for Quadrant D Data is divided into 100 sec bins |
 |
 |
| Parameter | Plot |
|---|---|
| CZT HV Monitor | 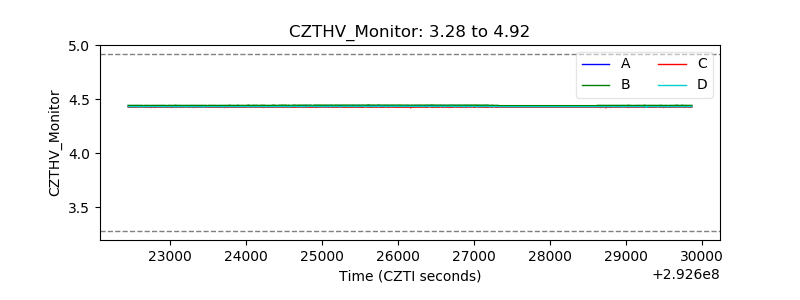 |
| D_VDD | 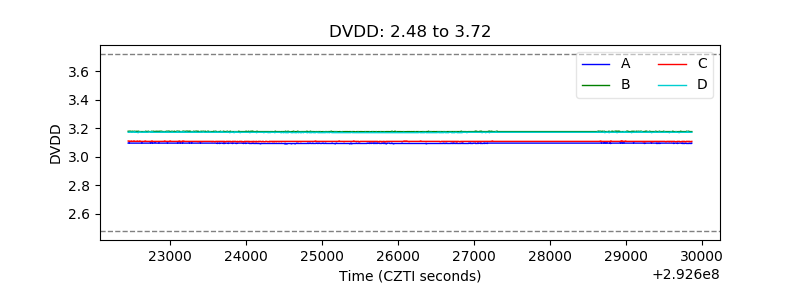 |
| Temperature 1 | 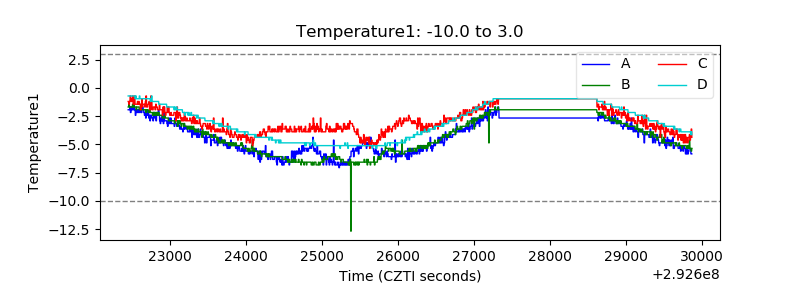 |
| Veto HV Monitor | 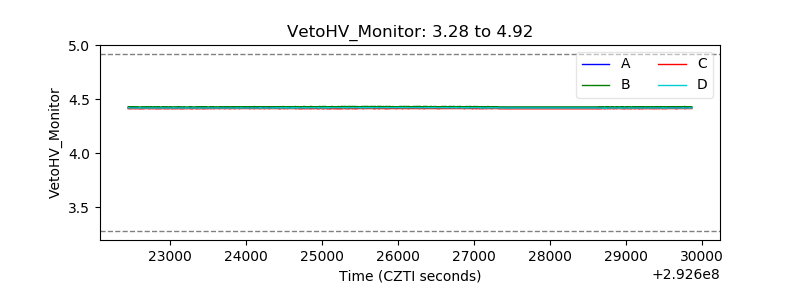 |
| Veto LLD | 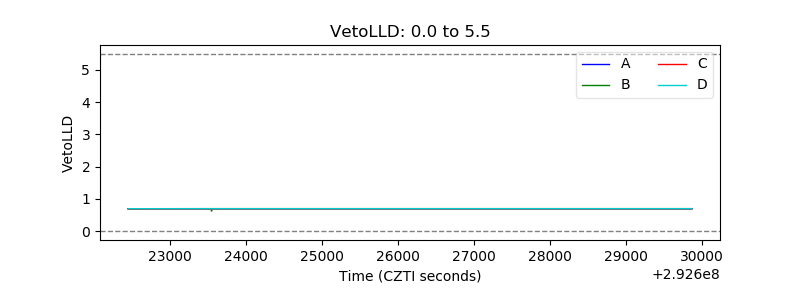 |
| Alpha Counter | 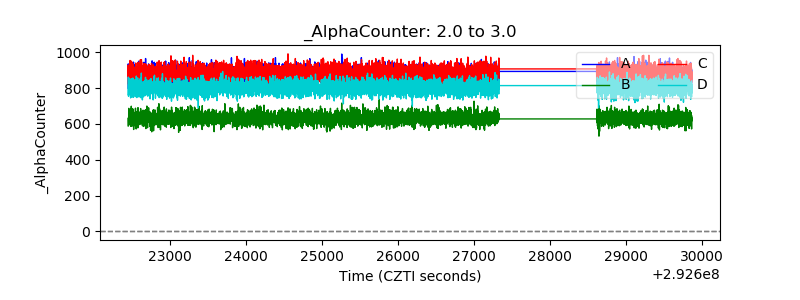 |
| _CPM_Rate | 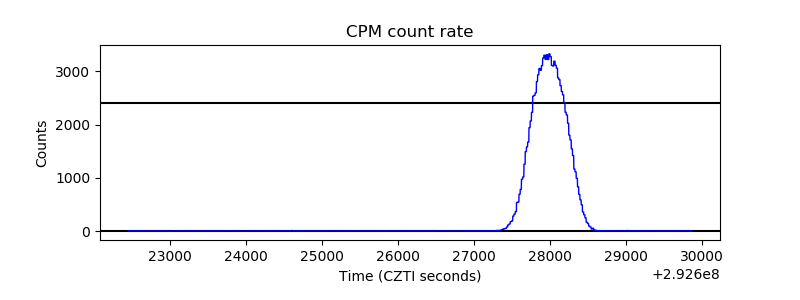 |
| CZT Counter | 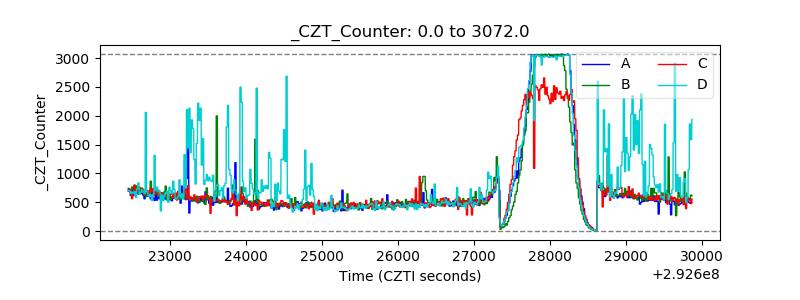 |
| +2.5 Volts monitor |  |
| +5 Volts monitor | 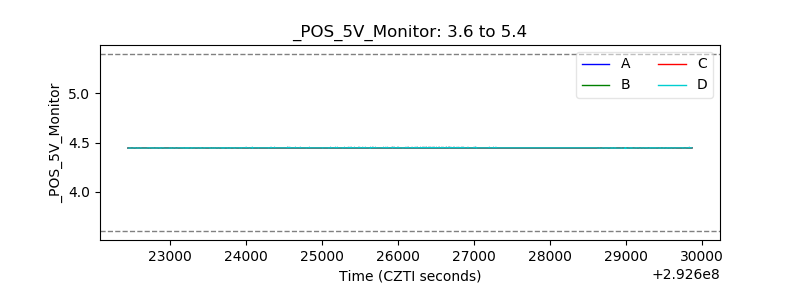 |
| _ROLL_ROT | 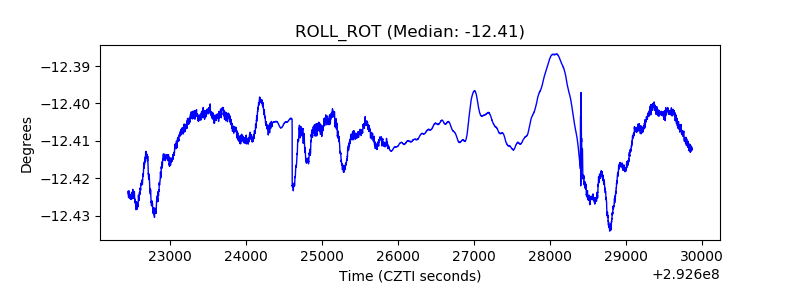 |
| _Roll_DEC |  |
| _Roll_RA | 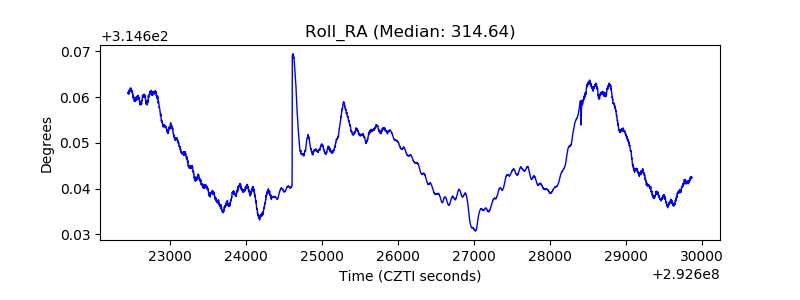 |
| Veto Counter | 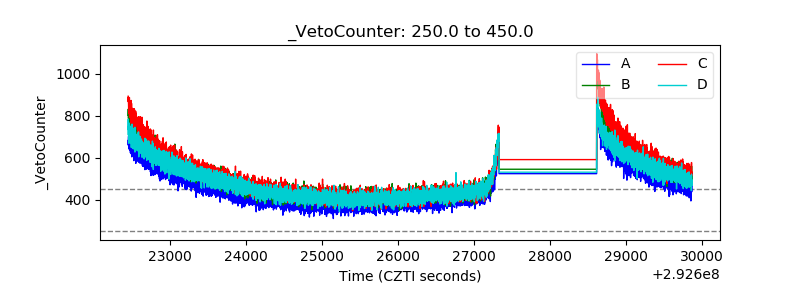 |