| Param | Original file | Final file |
|---|---|---|
| Filename | modeM0/AS1T03_098T01_9000002836_19107cztM0_level2.evt | modeM0/AS1T03_098T01_9000002836_19107cztM0_level2_quad_clean.evt |
| Size (bytes) | 474,779,520 | 107,268,480 |
| Size | 452.8 MB | 102.3 MB |
| Events in quadrant A | 3,084,700 | 704,040 |
| Events in quadrant B | 3,392,751 | 729,420 |
| Events in quadrant C | 3,218,697 | 711,439 |
| Events in quadrant D | 4,261,309 | 670,765 |
| Mode M9 | |||
|---|---|---|---|
| Quadrant | BADHDUFLAG | Total packets | Discarded packets |
| A | 0 | 14 | 0 |
| B | 0 | 15 | 0 |
| C | 0 | 15 | 0 |
| D | 0 | 15 | 0 |
| Mode M0 | |||
|---|---|---|---|
| Quadrant | BADHDUFLAG | Total packets | Discarded packets |
| A | 0 | 13210 | 2 |
| B | 0 | 14079 | 2 |
| C | 0 | 13483 | 2 |
| D | 0 | 16988 | 2 |
| Mode SS | |||
|---|---|---|---|
| Quadrant | BADHDUFLAG | Total packets | Discarded packets |
| A | 0 | 126 | 0 |
| B | 0 | 126 | 0 |
| C | 0 | 126 | 0 |
| D | 0 | 126 | 0 |
| Quadrant | Total seconds | Saturated seconds | Saturation percentage |
|---|---|---|---|
| A | 6207 | 29 | 0.467214% |
| B | 6207 | 110 | 1.772193% |
| C | 6207 | 90 | 1.449976% |
| D | 6207 | 185 | 2.980506% |
Noise dominated data is calculated using 1-second bins in cleaned event files. If a bin has >2000 counts, and if more than 50% of those come from <1% of pixels, then it is considered to be noise-dominated and hence unusable.
| Quadrant | # 1 sec bins | Bins with >0 counts | Bins with >2000 counts | High rate bins dominated by noise | Noise dominated (total time) | Noise dominated (detector-on time) | Marked lightcurve |
|---|---|---|---|---|---|---|---|
| A | 7512 | 6208 | 1 | 1 | 0.01% | 0.02% | 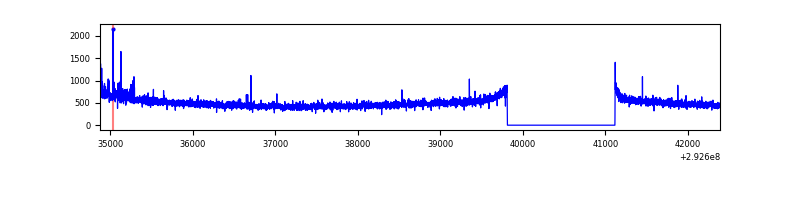 |
| B | 7512 | 6208 | 39 | 39 | 0.52% | 0.63% | 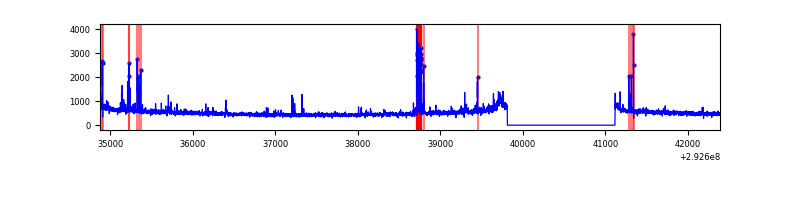 |
| C | 7512 | 6208 | 4 | 4 | 0.05% | 0.06% | 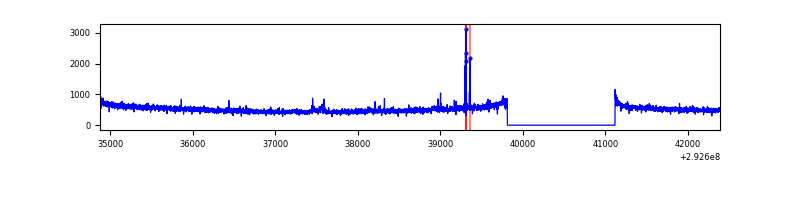 |
| D | 7512 | 6208 | 110 | 110 | 1.46% | 1.77% | 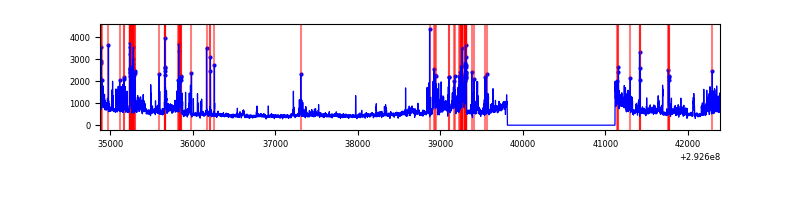 |
Top three noisy pixels from each quadrant. If the there are fewer than three noisy pixels in the level2.evt file, extra rows are filled as -1
| Pixel properties | Quadrant properties | ||||||
|---|---|---|---|---|---|---|---|
| Quadrant | DetID | PixID | Counts | Sigma | Mean | Median | Sigma |
| A | 4 | 2 | 38692 | 237.23 | 789 | 775 | 159.8 |
| A | 0 | 226 | 6733 | 37.28 | 789 | 775 | 159.8 |
| A | 11 | 47 | 6037 | 32.92 | 789 | 775 | 159.8 |
| B | 3 | 112 | 135256 | 905.78 | 796 | 778 | 148.5 |
| B | 7 | 220 | 67155 | 447.08 | 796 | 778 | 148.5 |
| B | 4 | 216 | 32819 | 215.81 | 796 | 778 | 148.5 |
| C | 14 | 238 | 122035 | 675.24 | 774 | 782 | 179.6 |
| C | 3 | 233 | 54023 | 296.49 | 774 | 782 | 179.6 |
| C | 0 | 207 | 26413 | 142.73 | 774 | 782 | 179.6 |
| D | 12 | 218 | 529996 | 2807.22 | 764 | 741 | 188.5 |
| D | 11 | 176 | 313579 | 1659.33 | 764 | 741 | 188.5 |
| D | 1 | 52 | 286796 | 1517.27 | 764 | 741 | 188.5 |
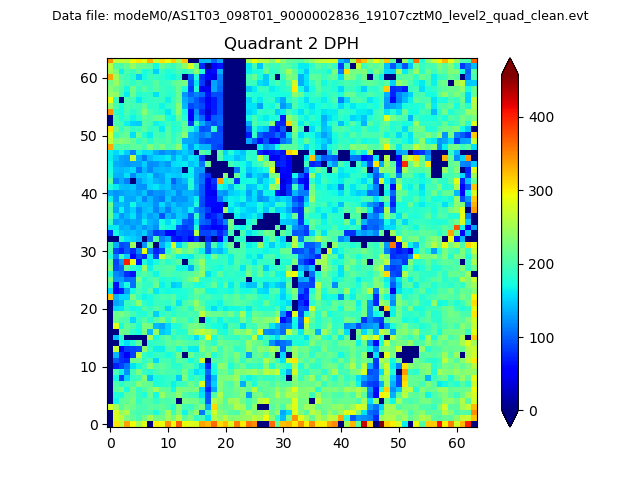
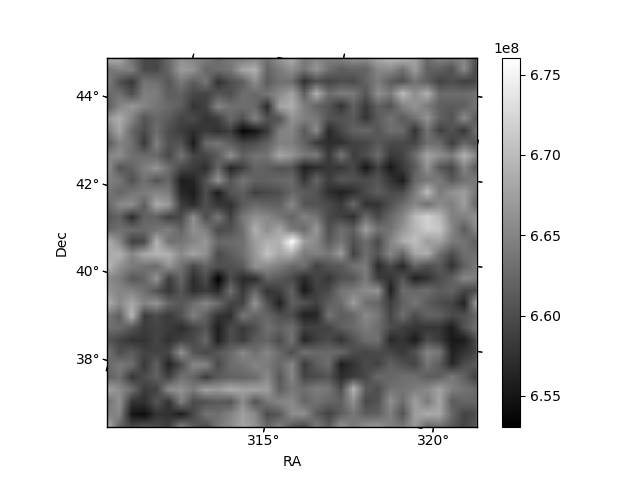
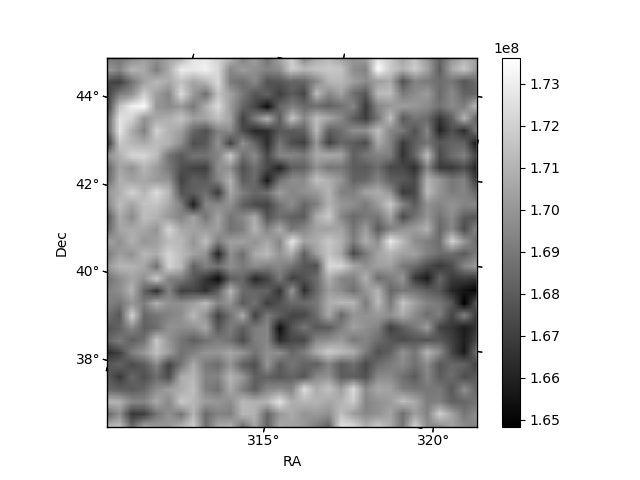
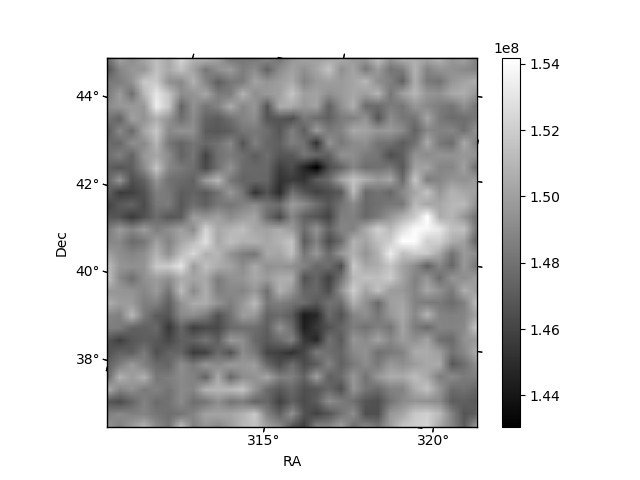
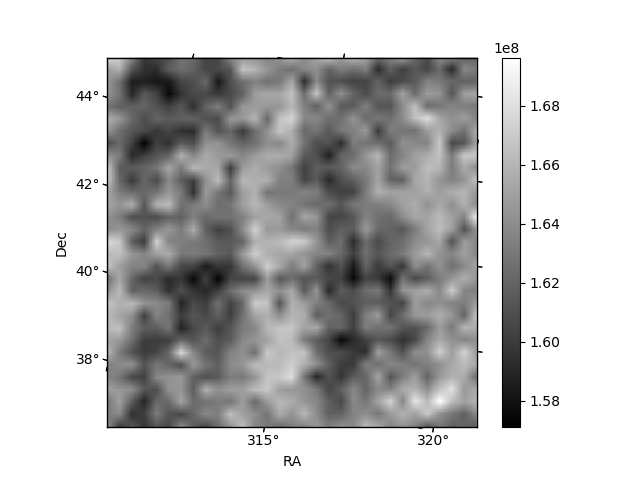
Histogram calculated using DETX and DETY for each event in the final _common_clean file
| Quadrant A | 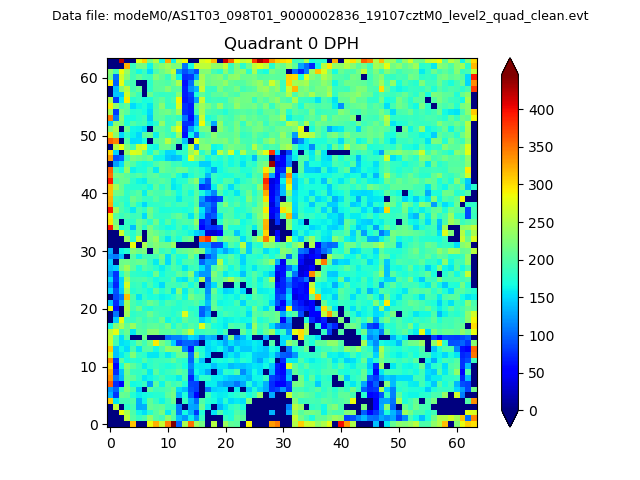 |
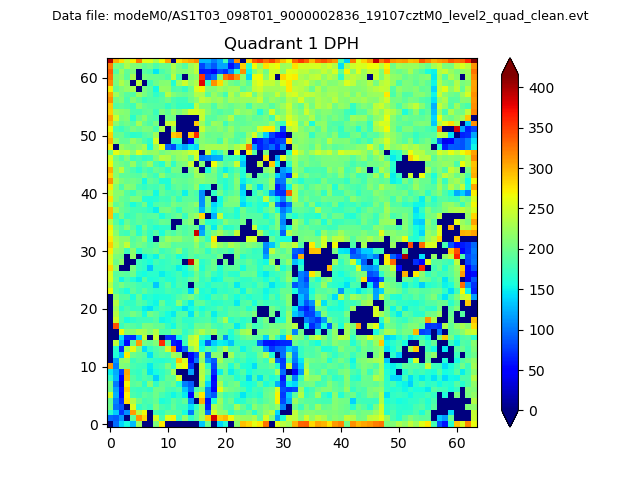 |
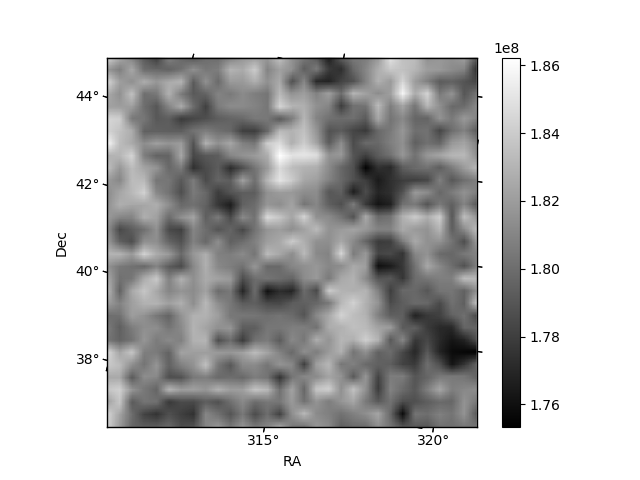
Quadrant B |
|---|---|---|---|
| Quadrant D | 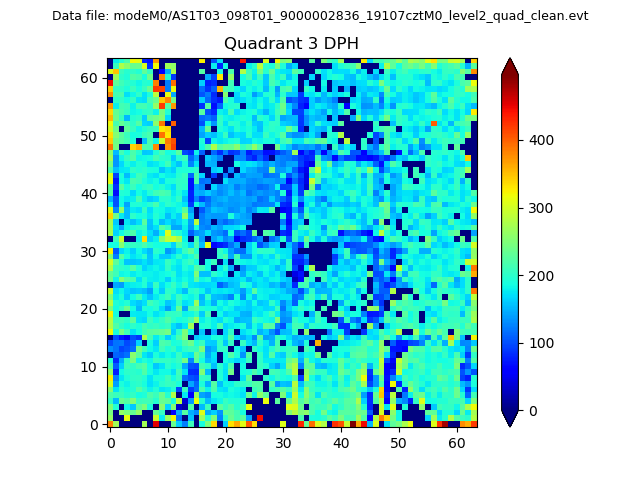 |
 |
Quadrant C |
| Plot type | Count rate plots | Images |
|---|---|---|
| Comparison with Poisson distribution Blue bars denote a histogram of data divided into 1 sec bins. Red curve is a Poisson curve with rate = median count rate of data. |
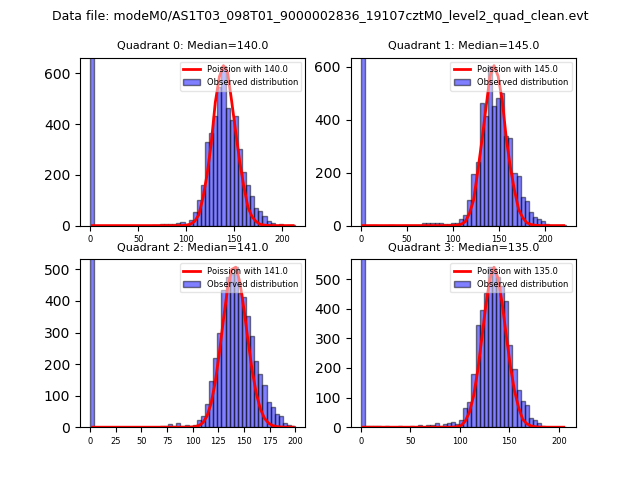 |
 |
| Quadrant-wise count rates Data is divided into 100 sec bins |
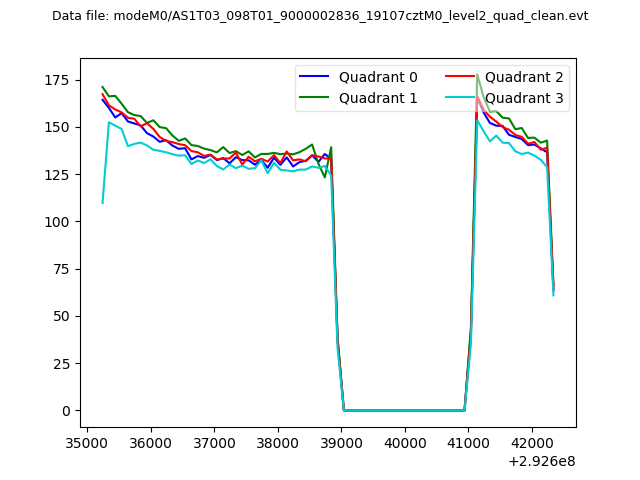 |
|
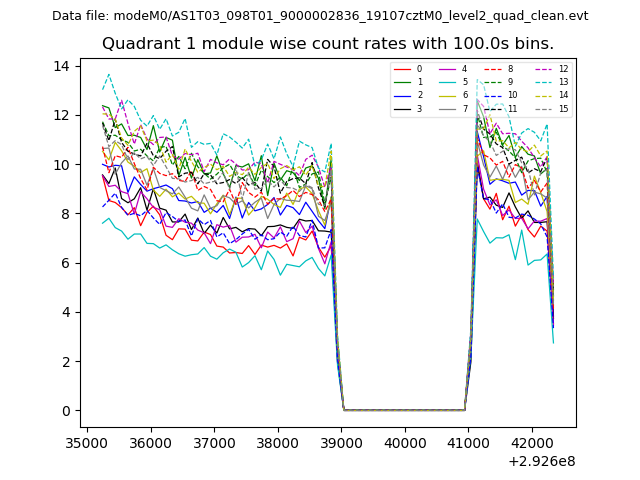
| Module-wise count rates for Quadrant A Data is divided into 100 sec bins |
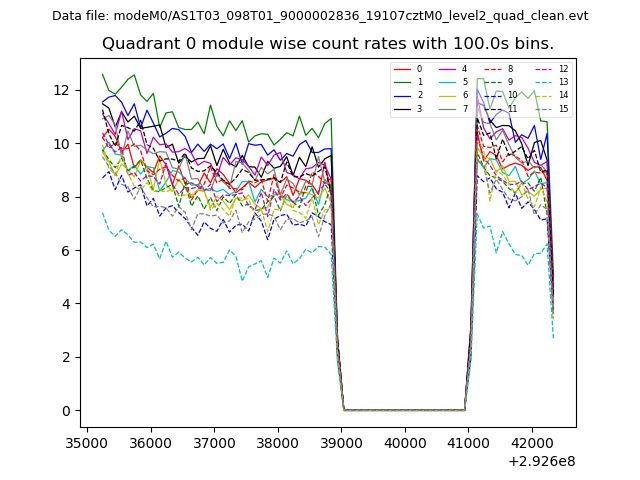 |
 |
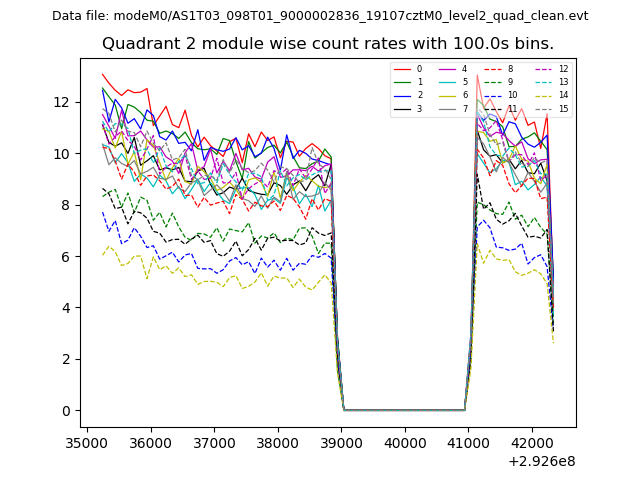
| Module-wise count rates for Quadrant B Data is divided into 100 sec bins |
 |
 |
| Module-wise count rates for Quadrant C Data is divided into 100 sec bins |
 |
 |
| Module-wise count rates for Quadrant D Data is divided into 100 sec bins |
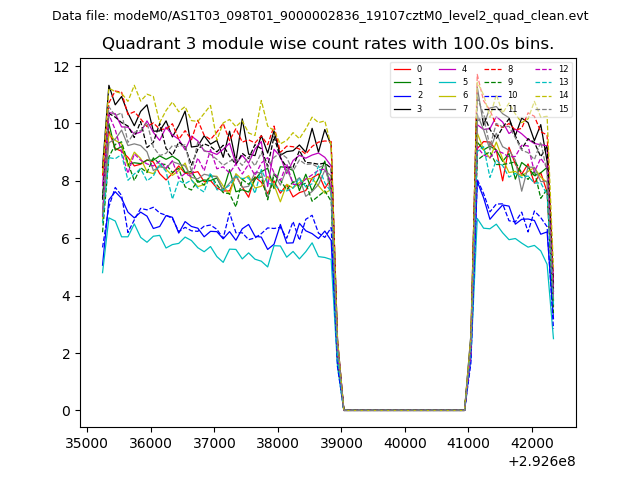 |
 |
| Parameter | Plot |
|---|---|
| CZT HV Monitor | 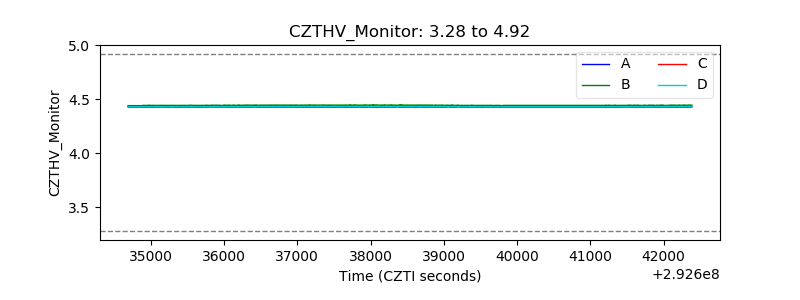 |
| D_VDD | 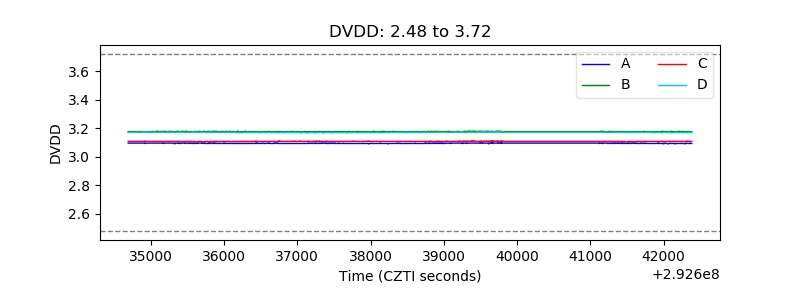 |
| Temperature 1 | 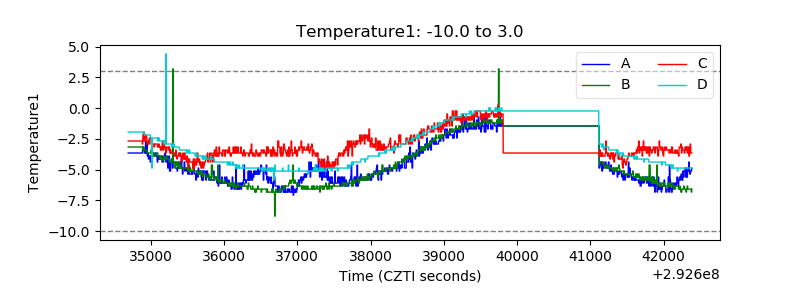 |
| Veto HV Monitor | 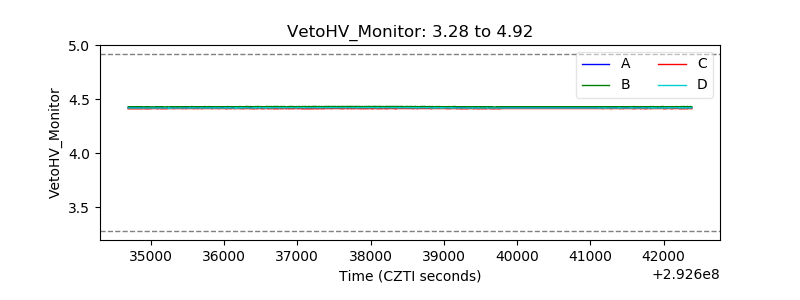 |
| Veto LLD | 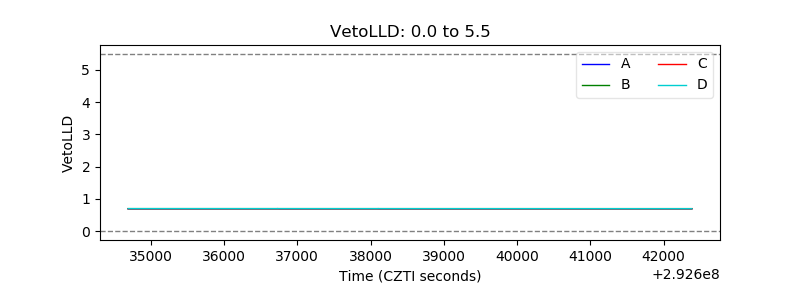 |
| Alpha Counter | 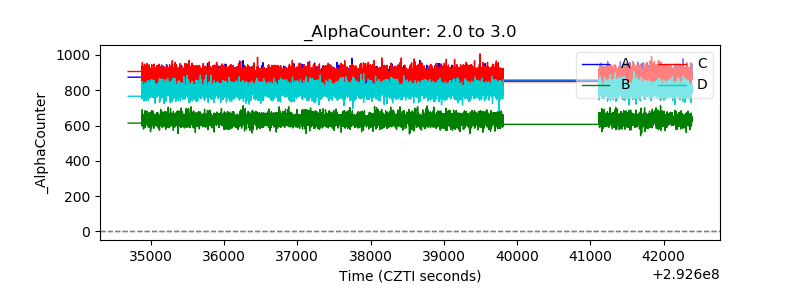 |
| _CPM_Rate | 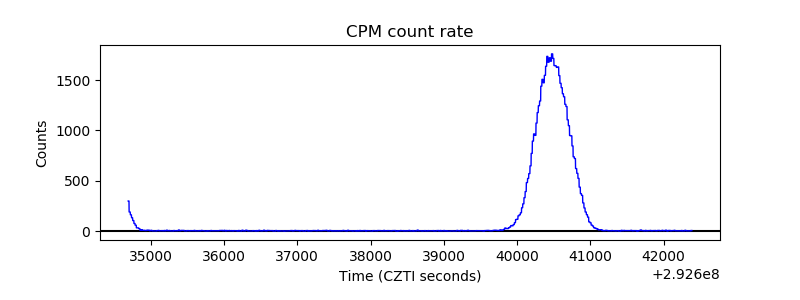 |
| CZT Counter |  |
| +2.5 Volts monitor |  |
| +5 Volts monitor |  |
| _ROLL_ROT |  |
| _Roll_DEC | 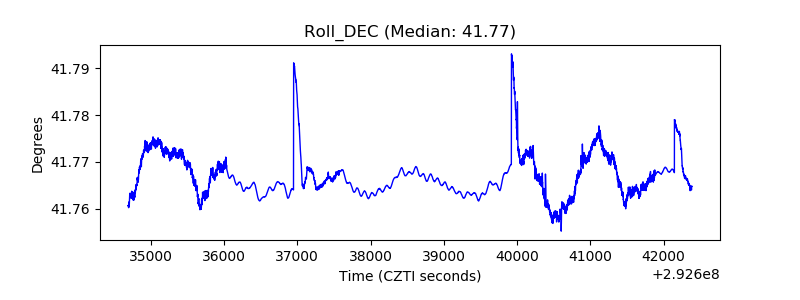 |
| _Roll_RA | 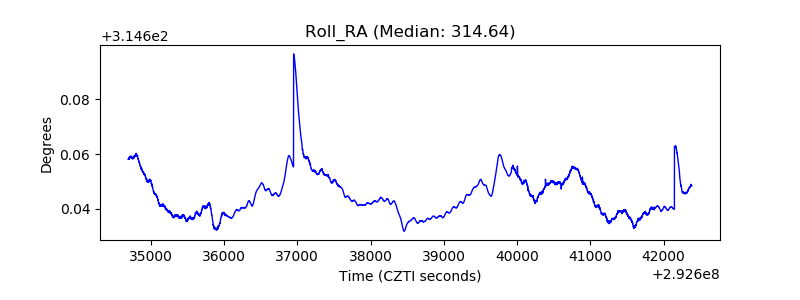 |
| Veto Counter | 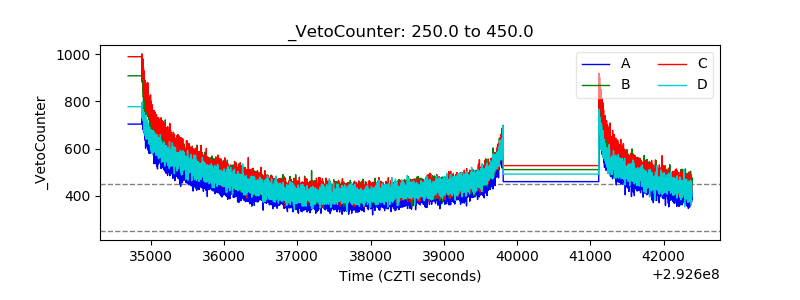 |