| Param | Original file | Final file |
|---|---|---|
| Filename | modeM0/AS1T03_098T01_9000002836_19110cztM0_level2.evt | modeM0/AS1T03_098T01_9000002836_19110cztM0_level2_quad_clean.evt |
| Size (bytes) | 620,579,520 | 106,021,440 |
| Size | 591.8 MB | 101.1 MB |
| Events in quadrant A | 3,518,258 | 687,021 |
| Events in quadrant B | 4,443,317 | 701,867 |
| Events in quadrant C | 3,655,760 | 684,144 |
| Events in quadrant D | 6,662,994 | 610,158 |
| Mode M9 | |||
|---|---|---|---|
| Quadrant | BADHDUFLAG | Total packets | Discarded packets |
| A | 0 | 8 | 0 |
| B | 0 | 9 | 0 |
| C | 0 | 9 | 0 |
| D | 0 | 9 | 0 |
| Mode M0 | |||
|---|---|---|---|
| Quadrant | BADHDUFLAG | Total packets | Discarded packets |
| A | 0 | 15707 | 2 |
| B | 0 | 18328 | 2 |
| C | 0 | 15859 | 2 |
| D | 0 | 25179 | 2 |
| Mode SS | |||
|---|---|---|---|
| Quadrant | BADHDUFLAG | Total packets | Discarded packets |
| A | 0 | 154 | 0 |
| B | 0 | 154 | 0 |
| C | 0 | 154 | 0 |
| D | 0 | 154 | 0 |
| Quadrant | Total seconds | Saturated seconds | Saturation percentage |
|---|---|---|---|
| A | 7577 | 96 | 1.266992% |
| B | 7577 | 333 | 4.394879% |
| C | 7577 | 115 | 1.517751% |
| D | 7577 | 1168 | 15.415072% |
Noise dominated data is calculated using 1-second bins in cleaned event files. If a bin has >2000 counts, and if more than 50% of those come from <1% of pixels, then it is considered to be noise-dominated and hence unusable.
| Quadrant | # 1 sec bins | Bins with >0 counts | Bins with >2000 counts | High rate bins dominated by noise | Noise dominated (total time) | Noise dominated (detector-on time) | Marked lightcurve |
|---|---|---|---|---|---|---|---|
| A | 7892 | 7578 | 0 | 0 | 0.00% | 0.00% | 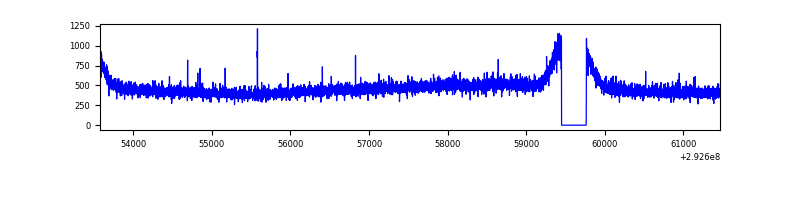 |
| B | 7892 | 7578 | 146 | 146 | 1.85% | 1.93% | 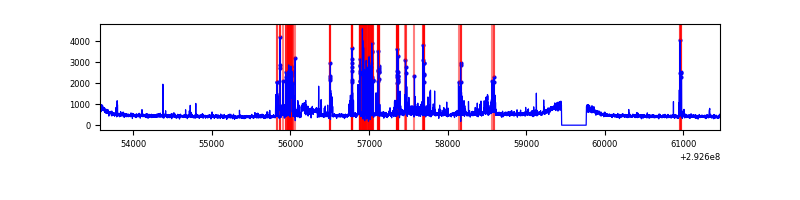 |
| C | 7892 | 7578 | 1 | 1 | 0.01% | 0.01% | 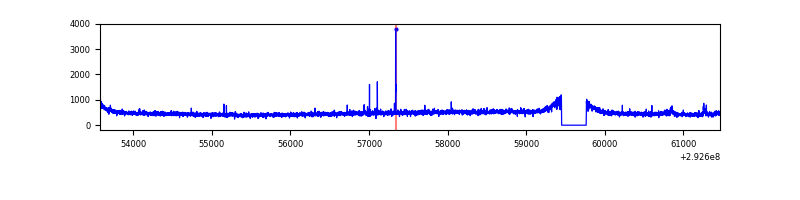 |
| D | 7892 | 7578 | 796 | 796 | 10.09% | 10.50% | 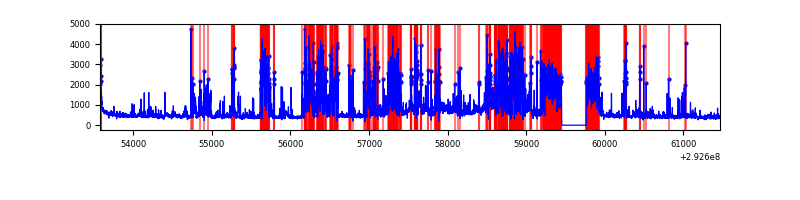 |
Top three noisy pixels from each quadrant. If the there are fewer than three noisy pixels in the level2.evt file, extra rows are filled as -1
| Pixel properties | Quadrant properties | ||||||
|---|---|---|---|---|---|---|---|
| Quadrant | DetID | PixID | Counts | Sigma | Mean | Median | Sigma |
| A | 13 | 254 | 8176 | 39.03 | 912 | 890 | 186.7 |
| A | 0 | 226 | 7915 | 37.63 | 912 | 890 | 186.7 |
| A | 3 | 137 | 7216 | 33.89 | 912 | 890 | 186.7 |
| B | 10 | 245 | 583877 | 3334.83 | 904 | 882 | 174.8 |
| B | 7 | 220 | 155084 | 882.06 | 904 | 882 | 174.8 |
| B | 6 | 36 | 67914 | 383.43 | 904 | 882 | 174.8 |
| C | 14 | 238 | 136127 | 652.34 | 879 | 886 | 207.3 |
| C | 3 | 233 | 61888 | 294.24 | 879 | 886 | 207.3 |
| C | 0 | 207 | 16895 | 77.22 | 879 | 886 | 207.3 |
| D | 1 | 52 | 3071822 | 15541.76 | 807 | 782 | 197.6 |
| D | 12 | 218 | 359503 | 1815.4 | 807 | 782 | 197.6 |
| D | 11 | 176 | 82945 | 415.81 | 807 | 782 | 197.6 |
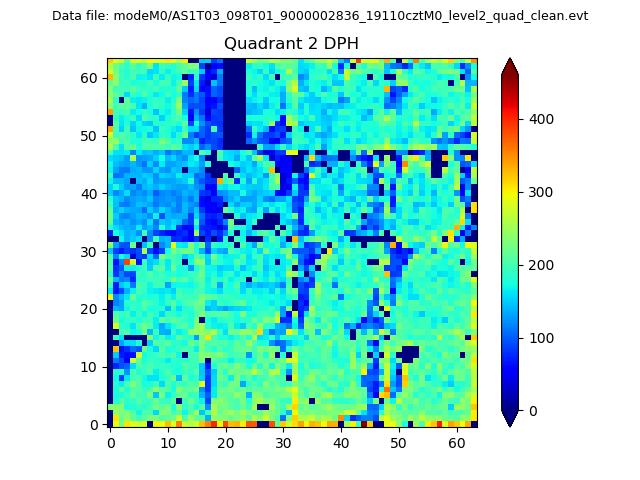
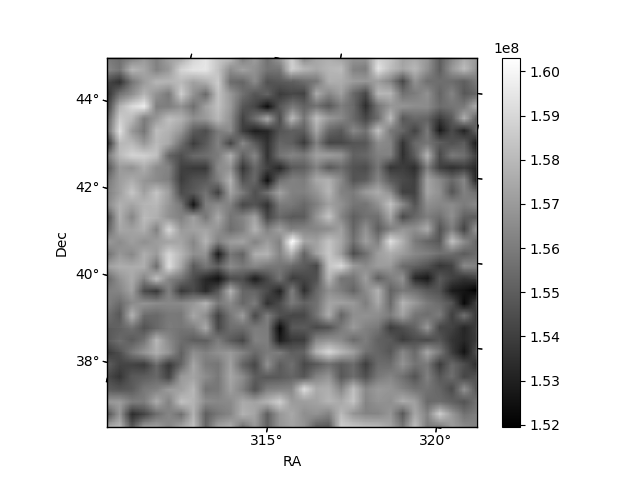
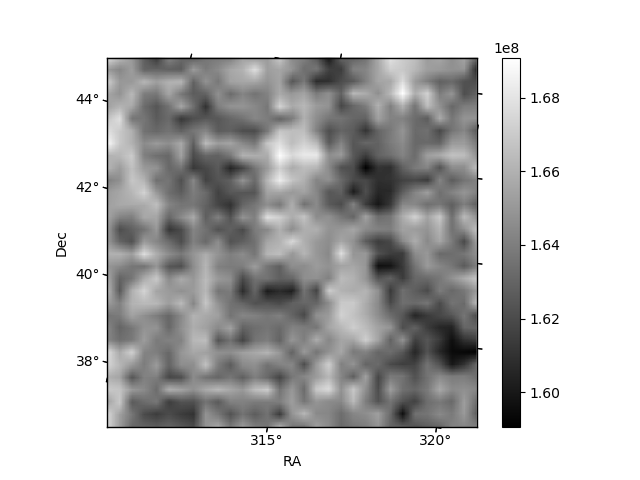
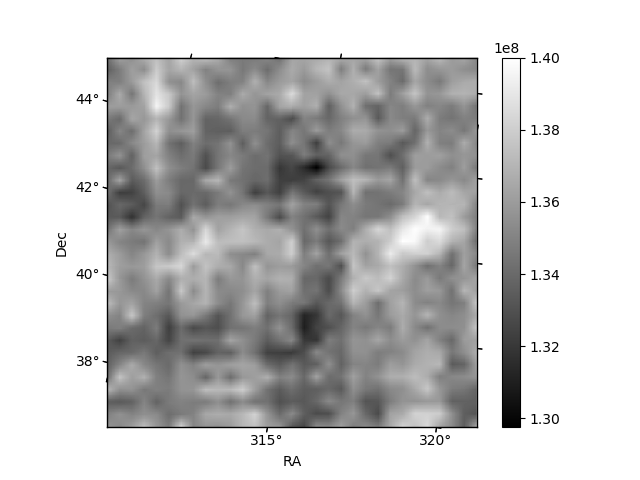
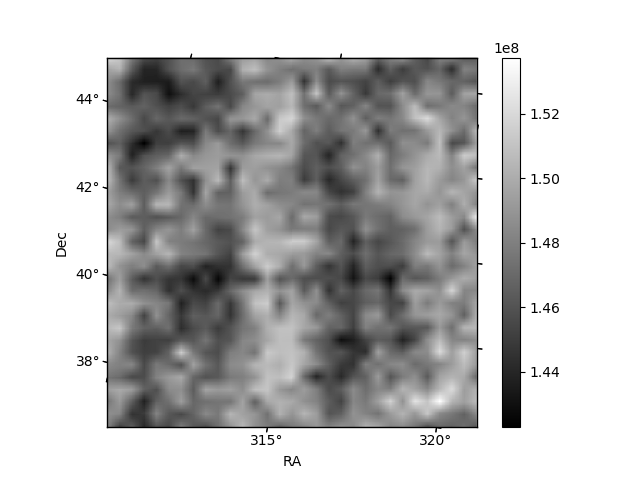
Histogram calculated using DETX and DETY for each event in the final _common_clean file
| Quadrant A | 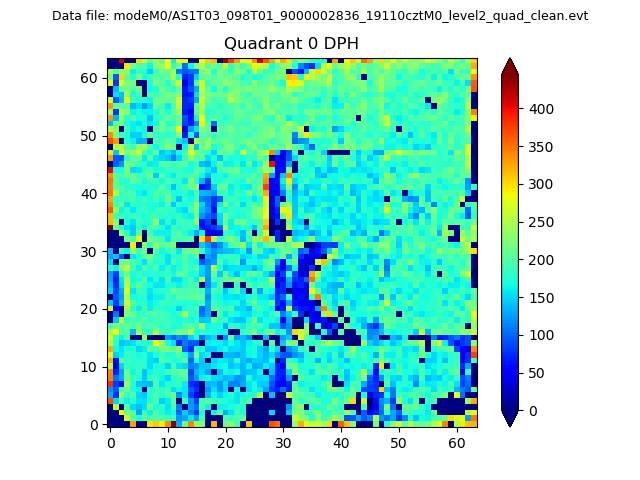 |
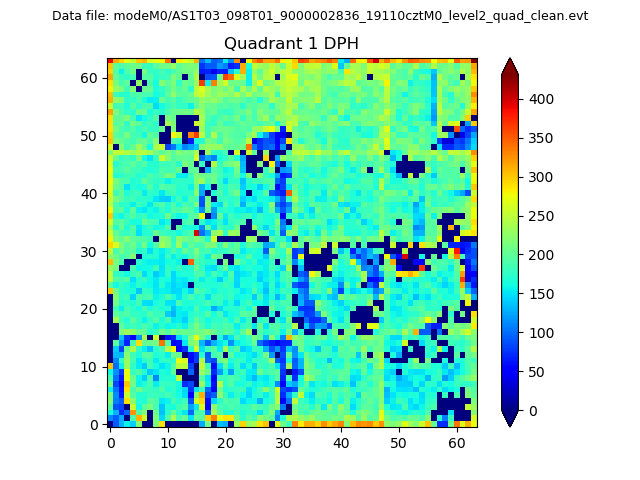 |
Quadrant B |
|---|---|---|---|
| Quadrant D | 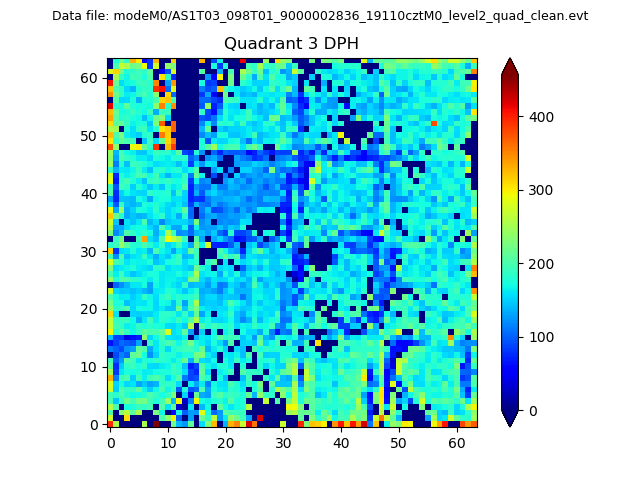 |
 |
Quadrant C |
| Plot type | Count rate plots | Images |
|---|---|---|
| Comparison with Poisson distribution Blue bars denote a histogram of data divided into 1 sec bins. Red curve is a Poisson curve with rate = median count rate of data. |
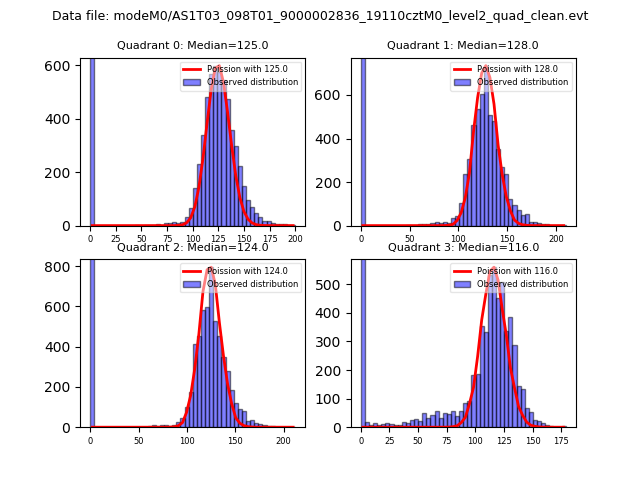 |
 |
| Quadrant-wise count rates Data is divided into 100 sec bins |
 |
|
| Module-wise count rates for Quadrant A Data is divided into 100 sec bins |
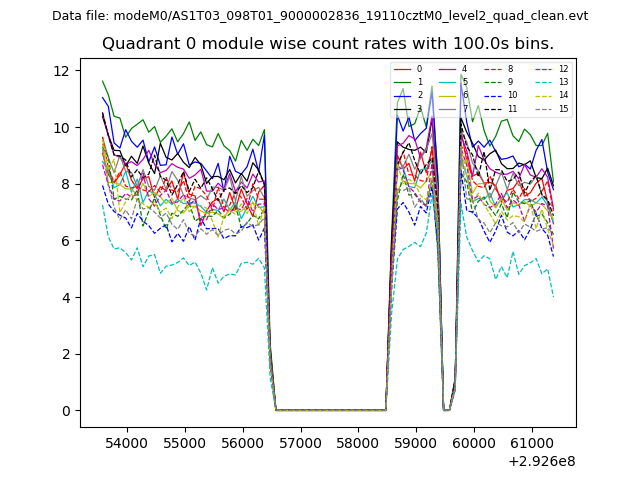 |
 |
| Module-wise count rates for Quadrant B Data is divided into 100 sec bins |
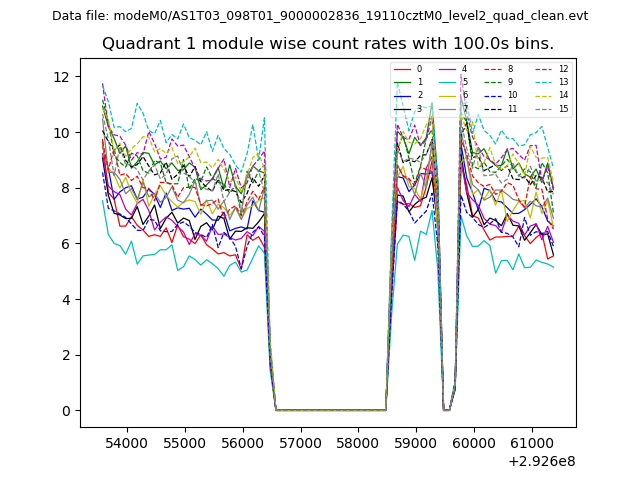 |
 |
| Module-wise count rates for Quadrant C Data is divided into 100 sec bins |
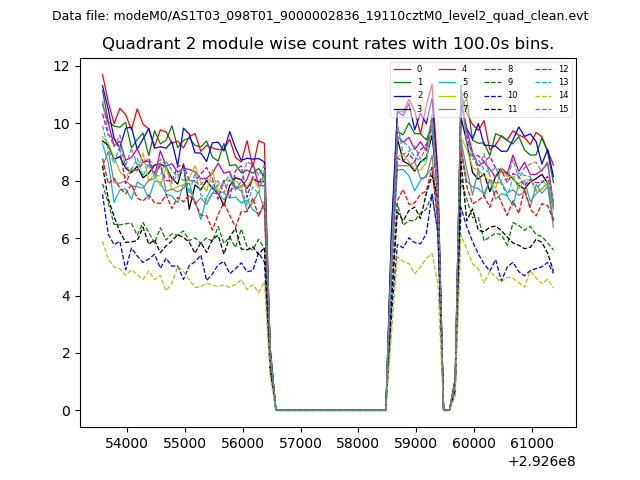 |
 |
| Module-wise count rates for Quadrant D Data is divided into 100 sec bins |
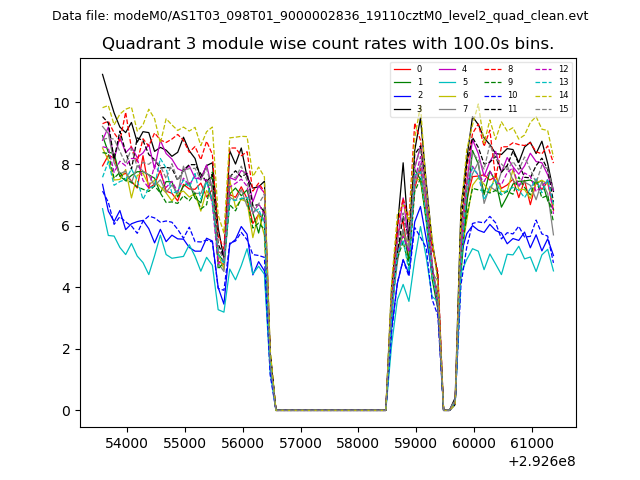 |
 |
| Parameter | Plot |
|---|---|
| CZT HV Monitor | 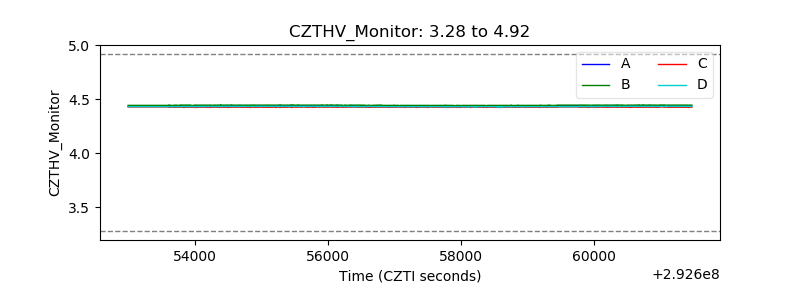 |
| D_VDD | 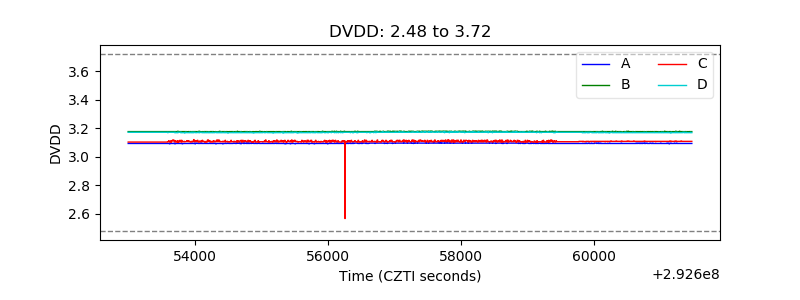 |
| Temperature 1 | 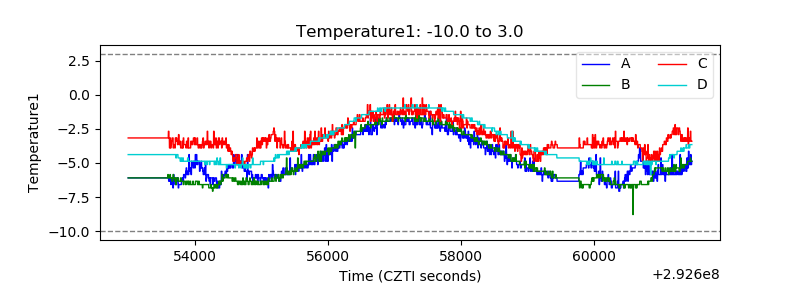 |
| Veto HV Monitor | 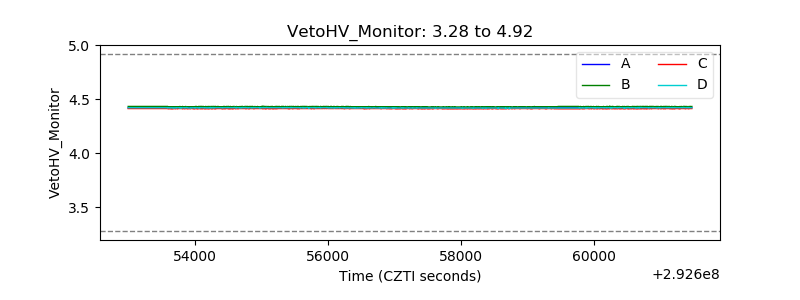 |
| Veto LLD |  |
| Alpha Counter |  |
| _CPM_Rate | 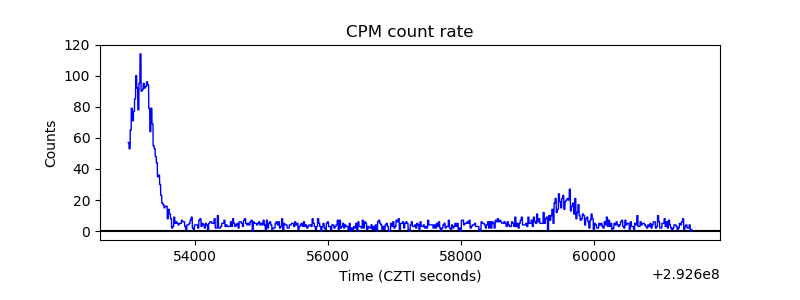 |
| CZT Counter | 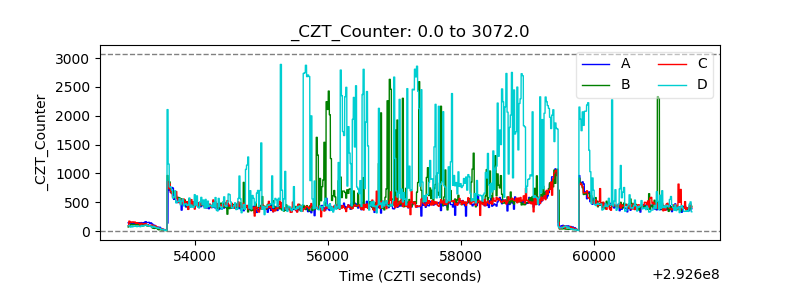 |
| +2.5 Volts monitor |  |
| +5 Volts monitor |  |
| _ROLL_ROT | 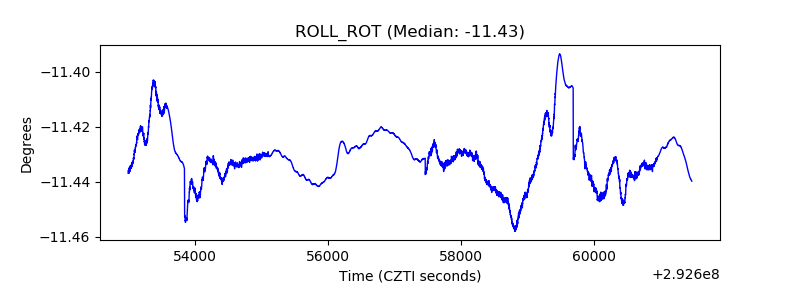 |
| _Roll_DEC | 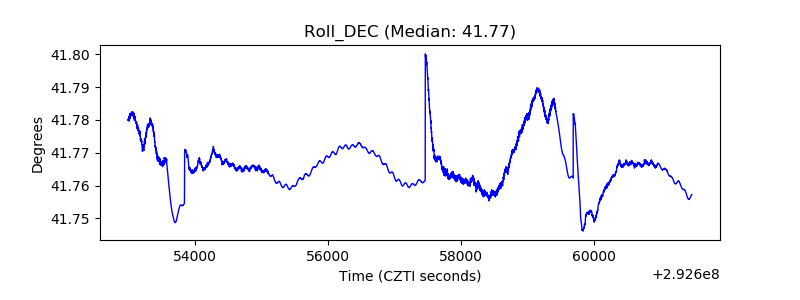 |
| _Roll_RA | 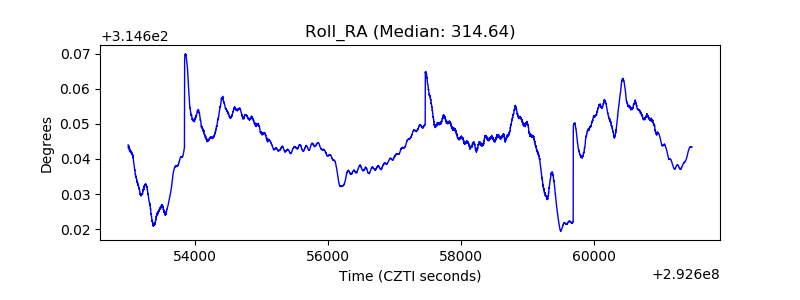 |
| Veto Counter | 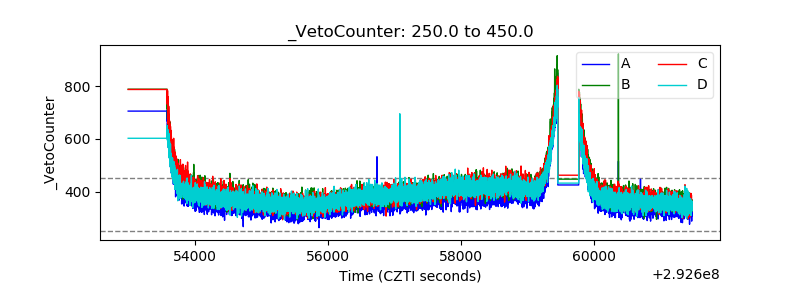 |