| Param | Original file | Final file |
|---|---|---|
| Filename | modeM0/AS1T03_098T01_9000002836_19111cztM0_level2.evt | modeM0/AS1T03_098T01_9000002836_19111cztM0_level2_quad_clean.evt |
| Size (bytes) | 526,152,960 | 104,814,720 |
| Size | 501.8 MB | 100.0 MB |
| Events in quadrant A | 3,439,756 | 666,269 |
| Events in quadrant B | 3,830,989 | 679,993 |
| Events in quadrant C | 3,765,189 | 663,258 |
| Events in quadrant D | 4,389,269 | 642,643 |
| Mode M9 | |||
|---|---|---|---|
| Quadrant | BADHDUFLAG | Total packets | Discarded packets |
| A | 0 | 1 | 0 |
| B | 0 | 1 | 0 |
| C | 0 | 1 | 0 |
| D | 0 | 1 | 0 |
| Mode M0 | |||
|---|---|---|---|
| Quadrant | BADHDUFLAG | Total packets | Discarded packets |
| A | 0 | 15401 | 2 |
| B | 0 | 16390 | 1 |
| C | 0 | 16090 | 1 |
| D | 0 | 18270 | 1 |
| Mode SS | |||
|---|---|---|---|
| Quadrant | BADHDUFLAG | Total packets | Discarded packets |
| A | 0 | 152 | 0 |
| B | 0 | 152 | 0 |
| C | 0 | 152 | 0 |
| D | 0 | 152 | 0 |
| Quadrant | Total seconds | Saturated seconds | Saturation percentage |
|---|---|---|---|
| A | 7499 | 173 | 2.306974% |
| B | 7500 | 226 | 3.013333% |
| C | 7500 | 198 | 2.640000% |
| D | 7500 | 309 | 4.120000% |
Noise dominated data is calculated using 1-second bins in cleaned event files. If a bin has >2000 counts, and if more than 50% of those come from <1% of pixels, then it is considered to be noise-dominated and hence unusable.
| Quadrant | # 1 sec bins | Bins with >0 counts | Bins with >2000 counts | High rate bins dominated by noise | Noise dominated (total time) | Noise dominated (detector-on time) | Marked lightcurve |
|---|---|---|---|---|---|---|---|
| A | 7634 | 7500 | 0 | 0 | 0.00% | 0.00% | 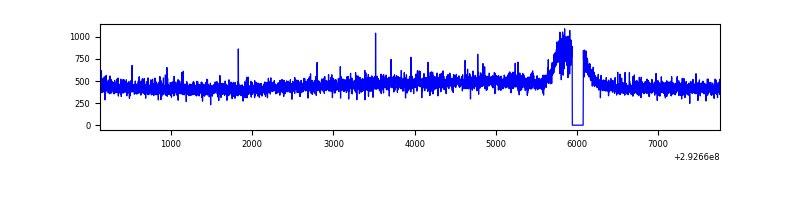 |
| B | 7635 | 7501 | 37 | 37 | 0.48% | 0.49% | 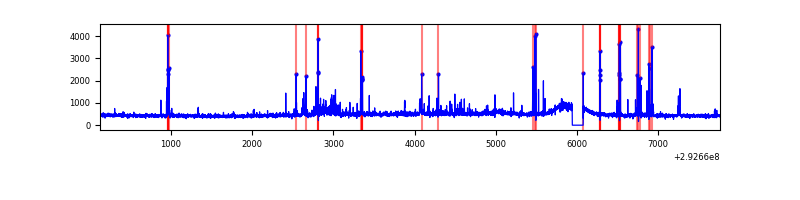 |
| C | 7635 | 7501 | 2 | 2 | 0.03% | 0.03% | 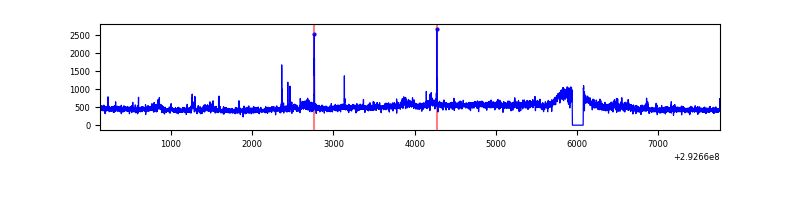 |
| D | 7635 | 7501 | 139 | 139 | 1.82% | 1.85% | 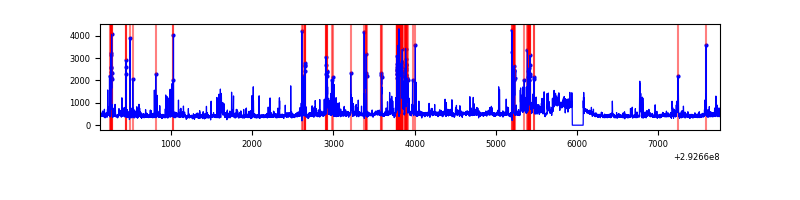 |
Top three noisy pixels from each quadrant. If the there are fewer than three noisy pixels in the level2.evt file, extra rows are filled as -1
| Pixel properties | Quadrant properties | ||||||
|---|---|---|---|---|---|---|---|
| Quadrant | DetID | PixID | Counts | Sigma | Mean | Median | Sigma |
| A | 0 | 226 | 7584 | 37.07 | 891 | 870 | 181.1 |
| A | 3 | 137 | 6943 | 33.53 | 891 | 870 | 181.1 |
| A | 8 | 205 | 6766 | 32.55 | 891 | 870 | 181.1 |
| B | 10 | 245 | 116095 | 671.16 | 890 | 866 | 171.7 |
| B | 7 | 220 | 89342 | 515.33 | 890 | 866 | 171.7 |
| B | 3 | 112 | 49151 | 281.24 | 890 | 866 | 171.7 |
| C | 3 | 233 | 274760 | 1360.52 | 853 | 857 | 201.3 |
| C | 14 | 238 | 132298 | 652.89 | 853 | 857 | 201.3 |
| C | 0 | 207 | 28055 | 135.1 | 853 | 857 | 201.3 |
| D | 12 | 218 | 361031 | 1679.65 | 859 | 831 | 214.4 |
| D | 11 | 176 | 333257 | 1550.14 | 859 | 831 | 214.4 |
| D | 1 | 52 | 248515 | 1154.98 | 859 | 831 | 214.4 |
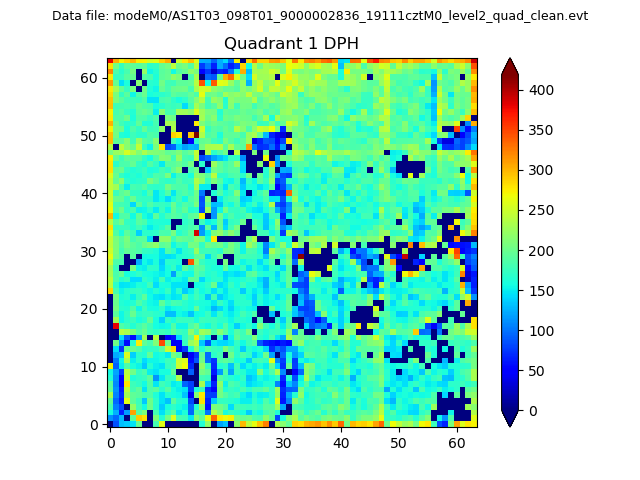
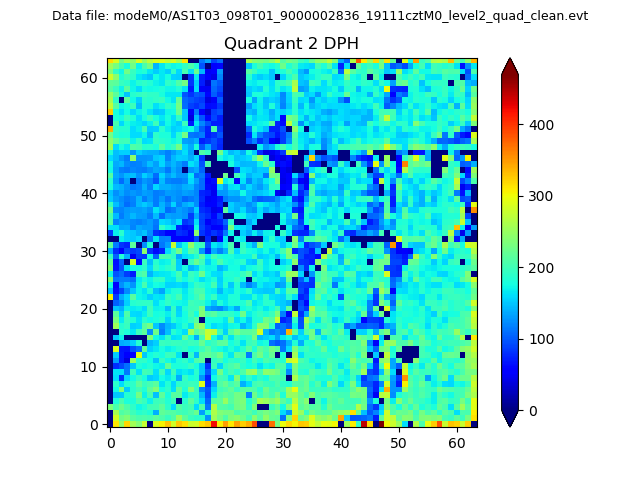
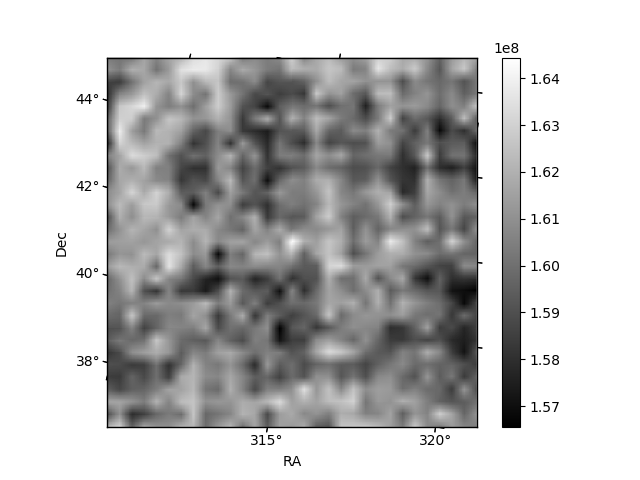
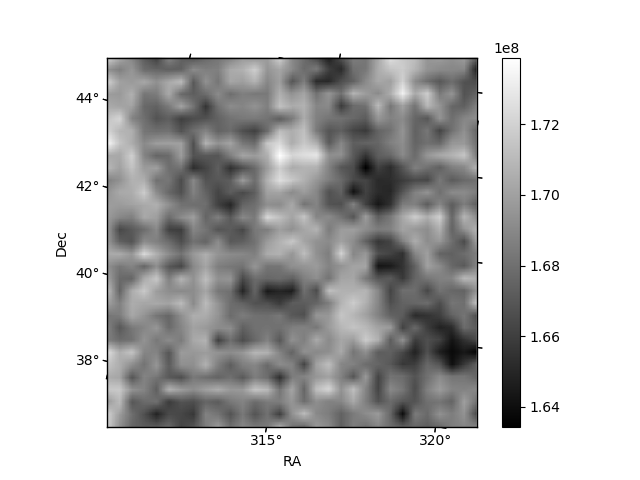
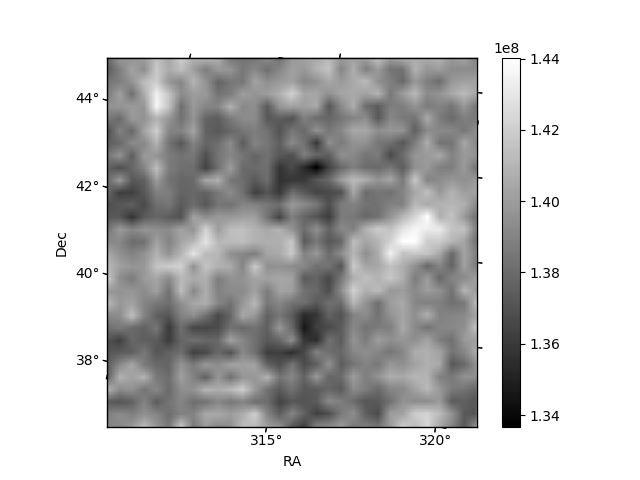
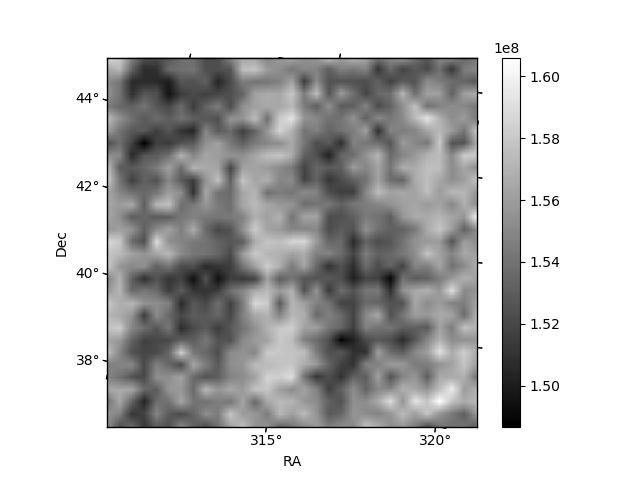
Histogram calculated using DETX and DETY for each event in the final _common_clean file
| Quadrant A |  |
 |
Quadrant B |
|---|---|---|---|
| Quadrant D |  |
 |
Quadrant C |
| Plot type | Count rate plots | Images |
|---|---|---|
| Comparison with Poisson distribution Blue bars denote a histogram of data divided into 1 sec bins. Red curve is a Poisson curve with rate = median count rate of data. |
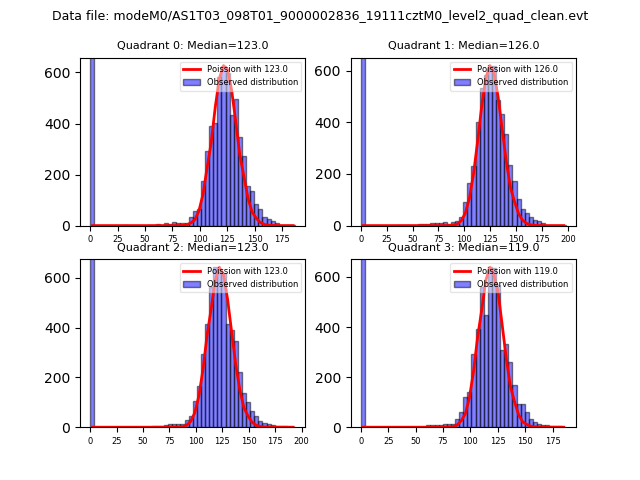 |
 |
| Quadrant-wise count rates Data is divided into 100 sec bins |
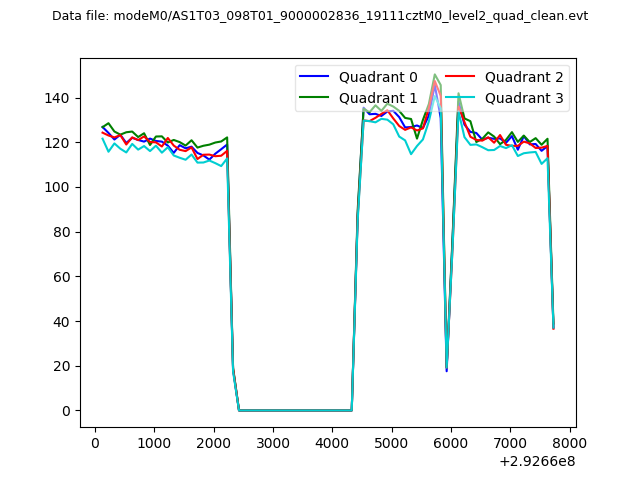 |
|
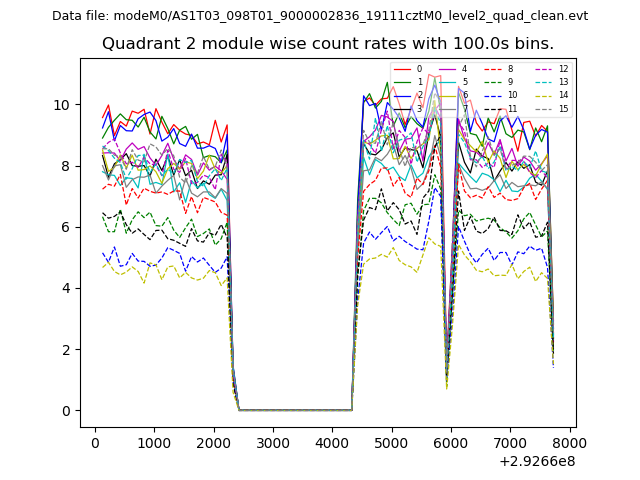
| Module-wise count rates for Quadrant A Data is divided into 100 sec bins |
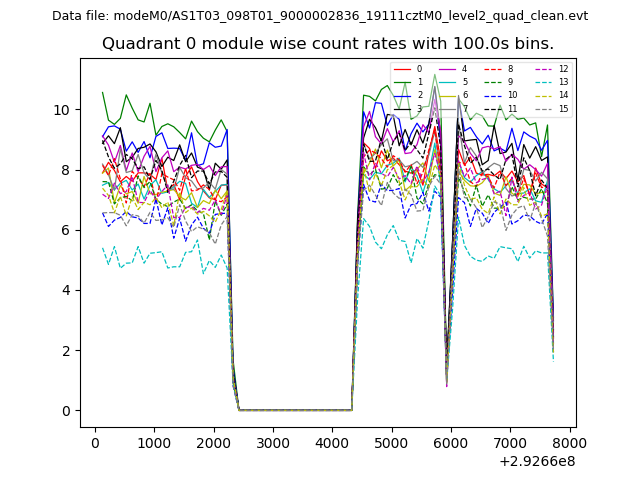 |
 |
| Module-wise count rates for Quadrant B Data is divided into 100 sec bins |
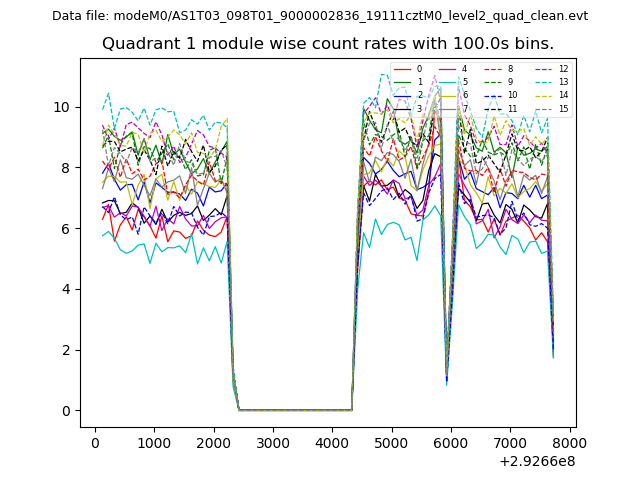 |
 |
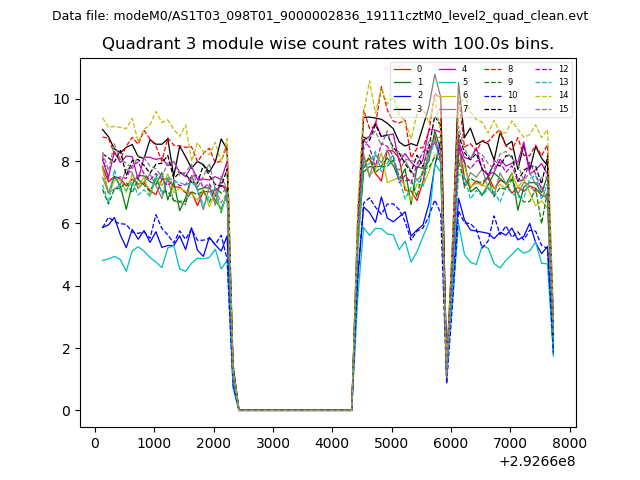
| Module-wise count rates for Quadrant C Data is divided into 100 sec bins |
 |
 |
| Module-wise count rates for Quadrant D Data is divided into 100 sec bins |
 |
 |
| Parameter | Plot |
|---|---|
| CZT HV Monitor | 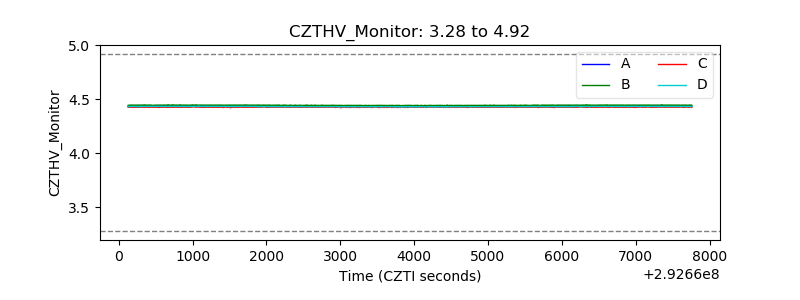 |
| D_VDD | 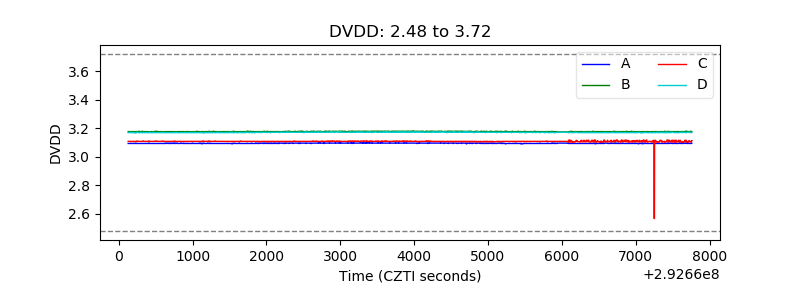 |
| Temperature 1 | 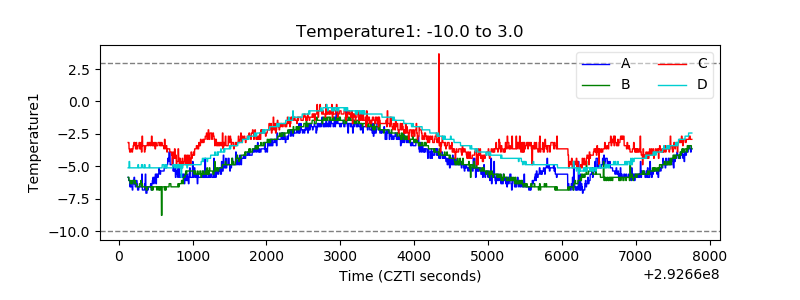 |
| Veto HV Monitor | 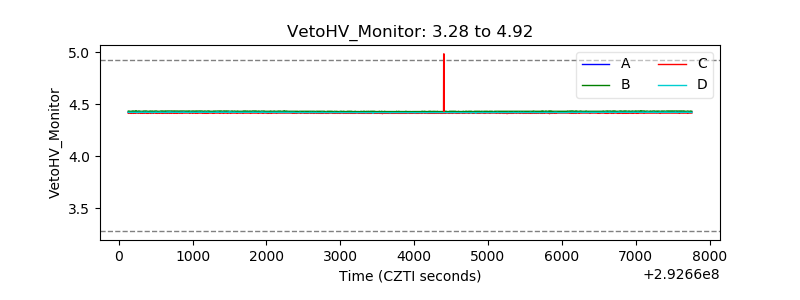 |
| Veto LLD | 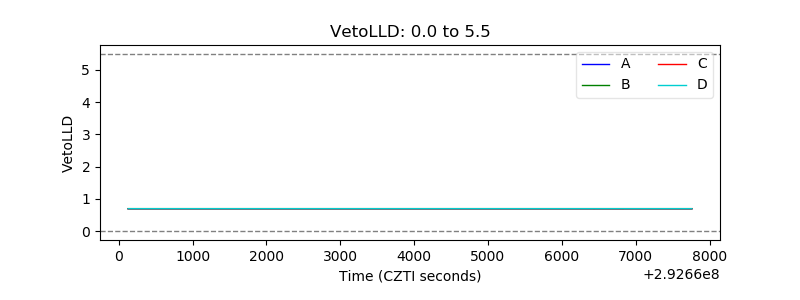 |
| Alpha Counter | 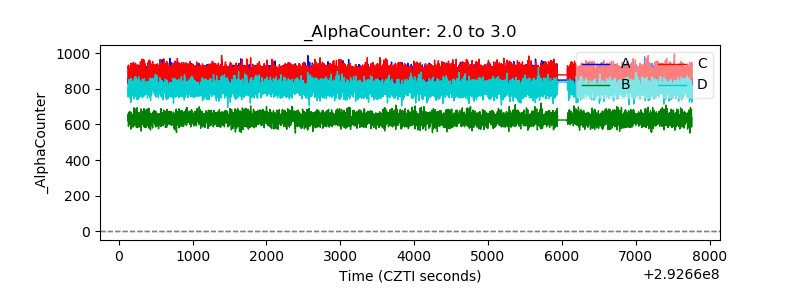 |
| _CPM_Rate | 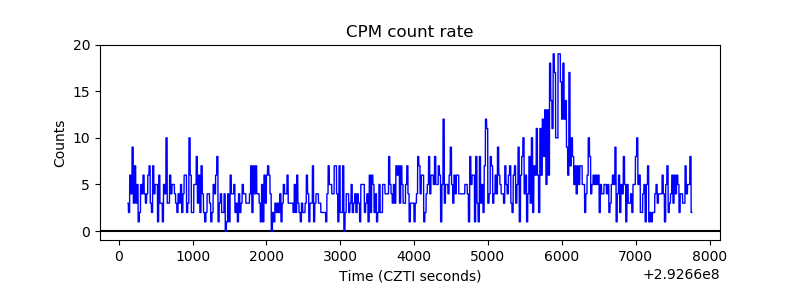 |
| CZT Counter | 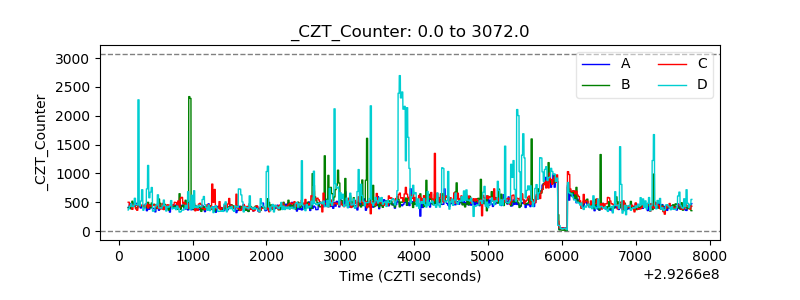 |
| +2.5 Volts monitor |  |
| +5 Volts monitor |  |
| _ROLL_ROT | 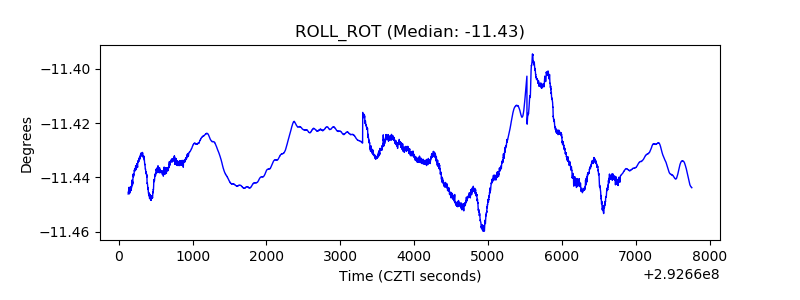 |
| _Roll_DEC | 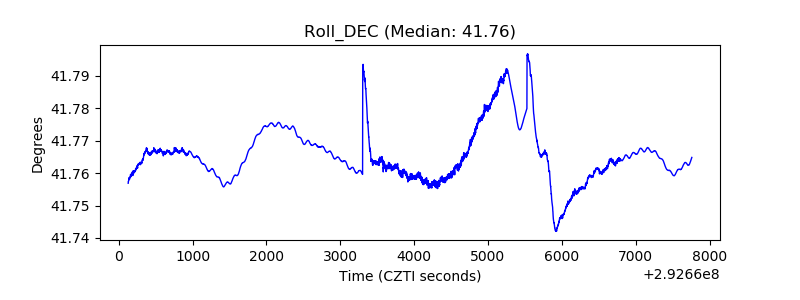 |
| _Roll_RA | 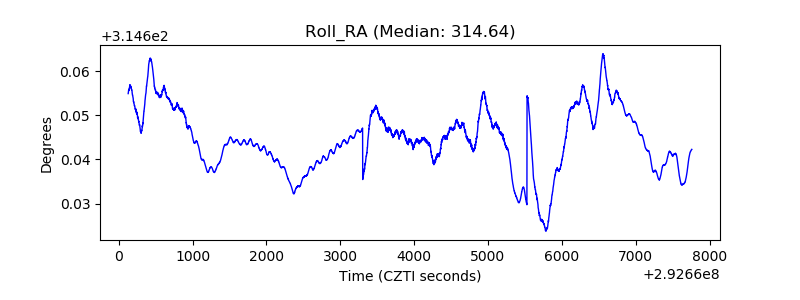 |
| Veto Counter | 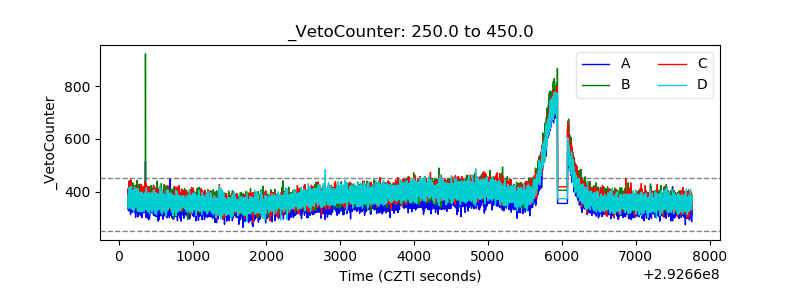 |