| Param | Original file | Final file |
|---|---|---|
| Filename | modeM0/AS1T03_098T01_9000002836_19112cztM0_level2.evt | modeM0/AS1T03_098T01_9000002836_19112cztM0_level2_quad_clean.evt |
| Size (bytes) | 543,409,920 | 90,388,800 |
| Size | 518.2 MB | 86.2 MB |
| Events in quadrant A | 3,093,243 | 575,996 |
| Events in quadrant B | 3,644,098 | 577,387 |
| Events in quadrant C | 3,538,944 | 570,987 |
| Events in quadrant D | 5,721,648 | 540,807 |
| Mode M9 | |||
|---|---|---|---|
| Quadrant | BADHDUFLAG | Total packets | Discarded packets |
| A | 0 | 4 | 0 |
| B | 0 | 4 | 0 |
| C | 0 | 4 | 0 |
| D | 0 | 4 | 0 |
| Mode M0 | |||
|---|---|---|---|
| Quadrant | BADHDUFLAG | Total packets | Discarded packets |
| A | 0 | 13776 | 1 |
| B | 0 | 15254 | 1 |
| C | 0 | 14803 | 1 |
| D | 0 | 21534 | 2 |
| Mode SS | |||
|---|---|---|---|
| Quadrant | BADHDUFLAG | Total packets | Discarded packets |
| A | 0 | 136 | 0 |
| B | 0 | 136 | 0 |
| C | 0 | 136 | 0 |
| D | 0 | 136 | 0 |
| Quadrant | Total seconds | Saturated seconds | Saturation percentage |
|---|---|---|---|
| A | 6776 | 86 | 1.269185% |
| B | 6777 | 228 | 3.364320% |
| C | 6777 | 111 | 1.637893% |
| D | 6776 | 586 | 8.648170% |
Noise dominated data is calculated using 1-second bins in cleaned event files. If a bin has >2000 counts, and if more than 50% of those come from <1% of pixels, then it is considered to be noise-dominated and hence unusable.
| Quadrant | # 1 sec bins | Bins with >0 counts | Bins with >2000 counts | High rate bins dominated by noise | Noise dominated (total time) | Noise dominated (detector-on time) | Marked lightcurve |
|---|---|---|---|---|---|---|---|
| A | 7136 | 6777 | 2 | 2 | 0.03% | 0.03% | 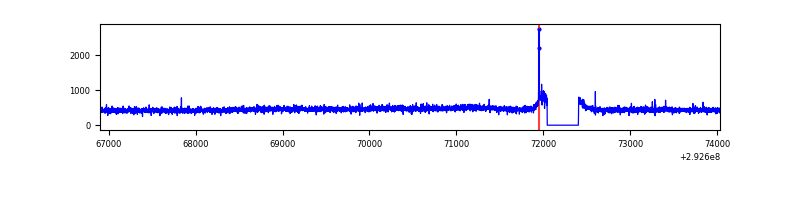 |
| B | 7137 | 6778 | 124 | 124 | 1.74% | 1.83% | 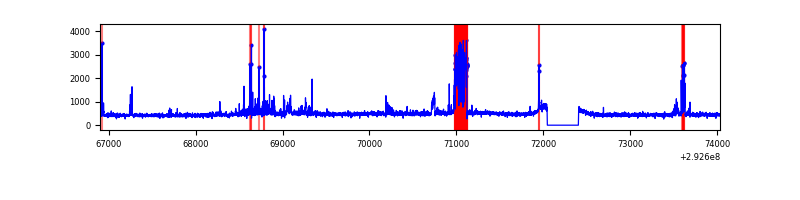 |
| C | 7137 | 6778 | 7 | 7 | 0.10% | 0.10% | 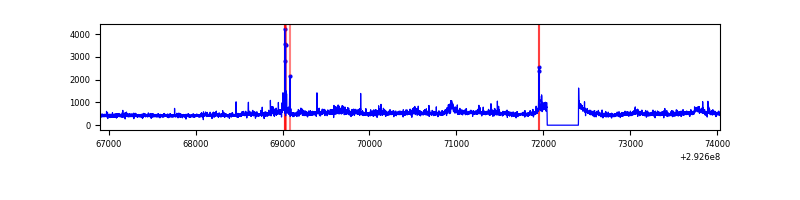 |
| D | 7136 | 6777 | 656 | 656 | 9.19% | 9.68% | 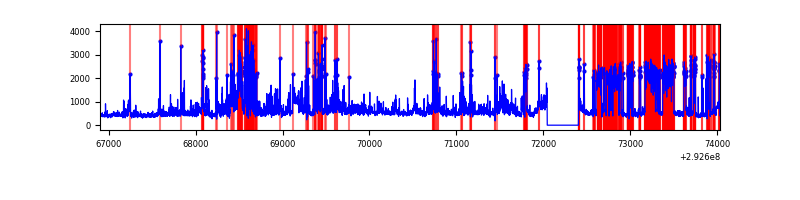 |
Top three noisy pixels from each quadrant. If the there are fewer than three noisy pixels in the level2.evt file, extra rows are filled as -1
| Pixel properties | Quadrant properties | ||||||
|---|---|---|---|---|---|---|---|
| Quadrant | DetID | PixID | Counts | Sigma | Mean | Median | Sigma |
| A | 8 | 205 | 7389 | 40.61 | 800 | 781 | 162.7 |
| A | 0 | 226 | 6882 | 37.49 | 800 | 781 | 162.7 |
| A | 11 | 47 | 6331 | 34.11 | 800 | 781 | 162.7 |
| B | 10 | 245 | 342619 | 2244.44 | 788 | 768 | 152.3 |
| B | 7 | 220 | 97550 | 635.43 | 788 | 768 | 152.3 |
| B | 3 | 112 | 44325 | 285.98 | 788 | 768 | 152.3 |
| C | 3 | 233 | 389693 | 2143.64 | 766 | 770 | 181.4 |
| C | 14 | 238 | 118665 | 649.81 | 766 | 770 | 181.4 |
| C | 0 | 207 | 31060 | 166.95 | 766 | 770 | 181.4 |
| D | 7 | 238 | 1591322 | 8542.93 | 761 | 739 | 186.2 |
| D | 12 | 218 | 702439 | 3768.79 | 761 | 739 | 186.2 |
| D | 11 | 176 | 221211 | 1184.14 | 761 | 739 | 186.2 |
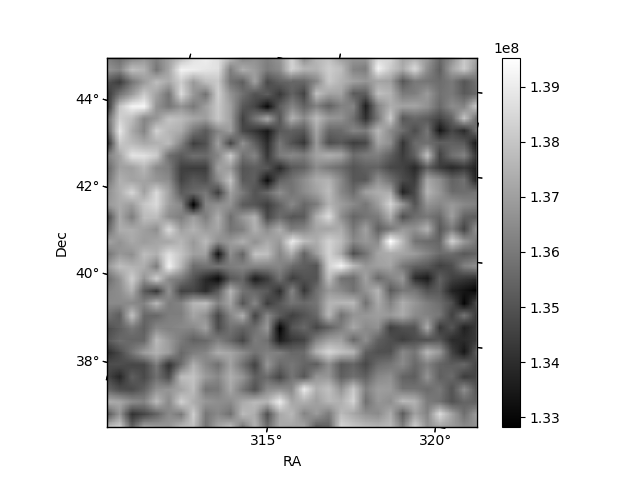
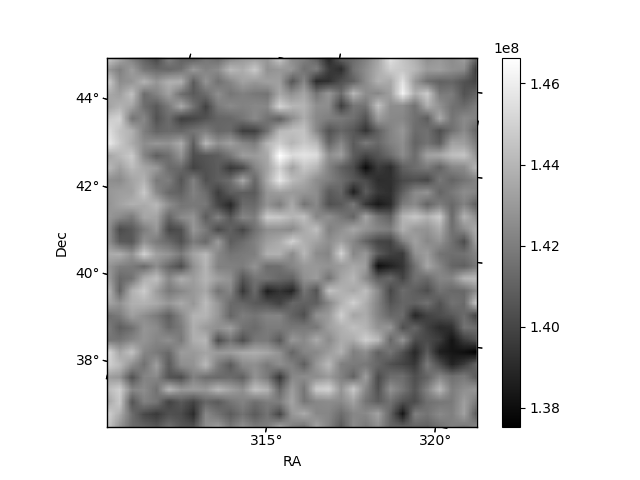
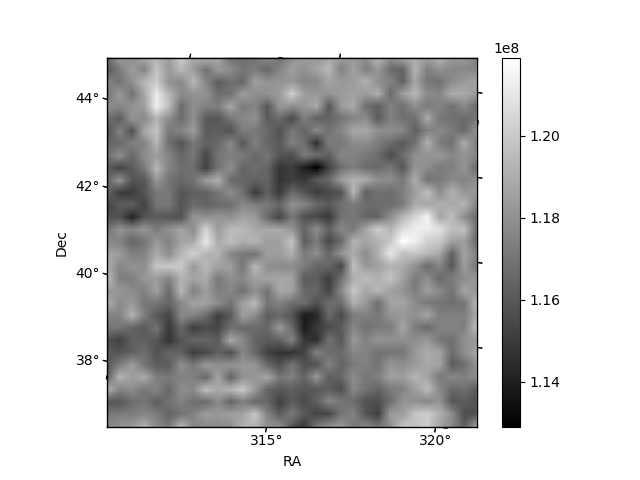
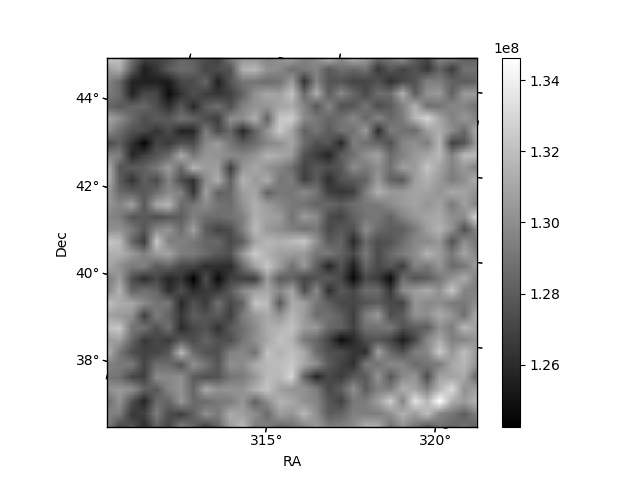
Histogram calculated using DETX and DETY for each event in the final _common_clean file
| Quadrant A | 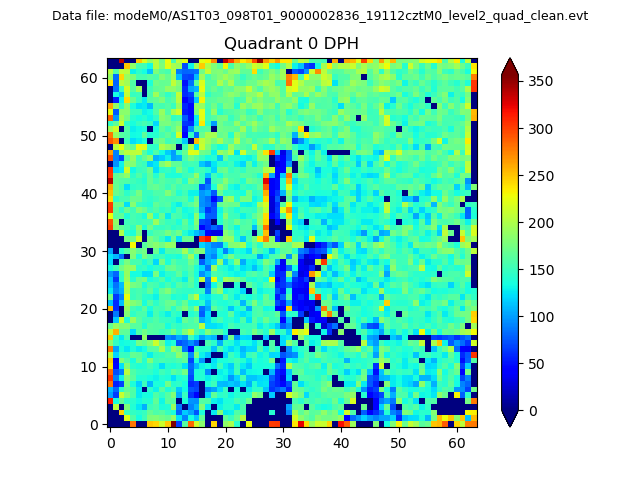 |
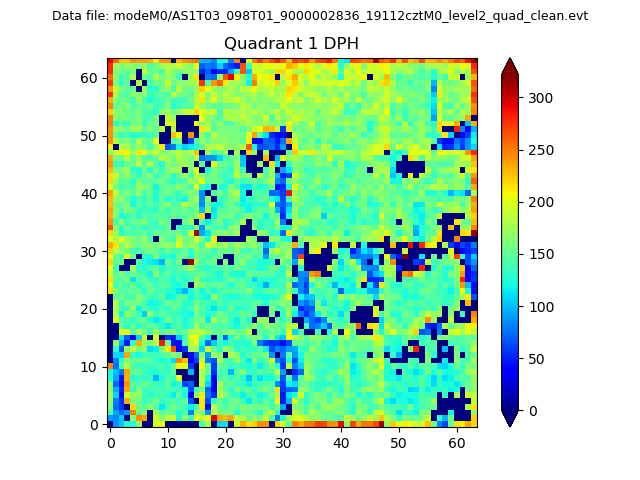 |
Quadrant B |
|---|---|---|---|
| Quadrant D | 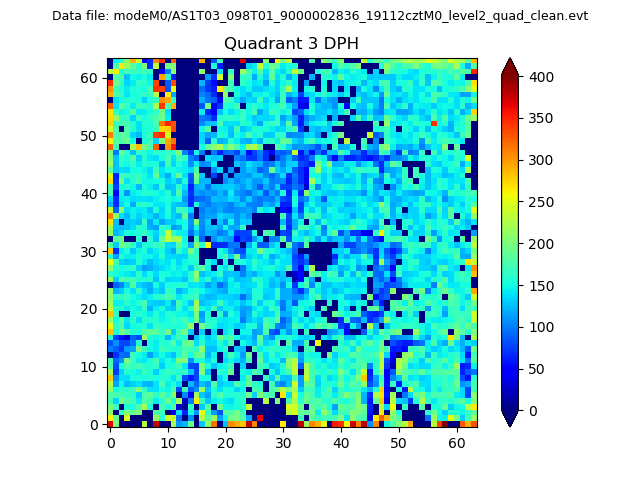 |
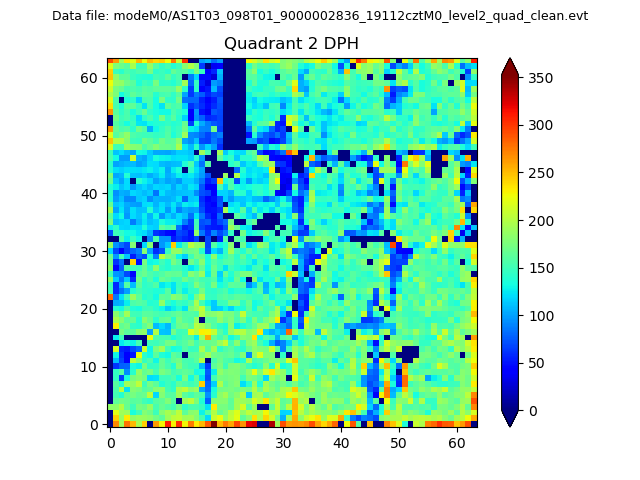 |
Quadrant C |
| Plot type | Count rate plots | Images |
|---|---|---|
| Comparison with Poisson distribution Blue bars denote a histogram of data divided into 1 sec bins. Red curve is a Poisson curve with rate = median count rate of data. |
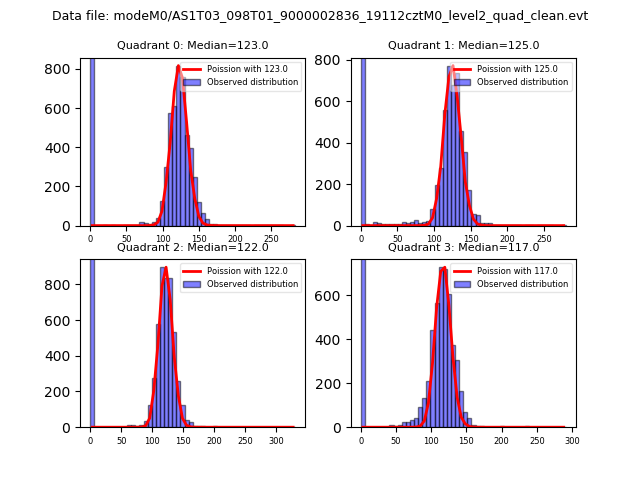 |
 |
| Quadrant-wise count rates Data is divided into 100 sec bins |
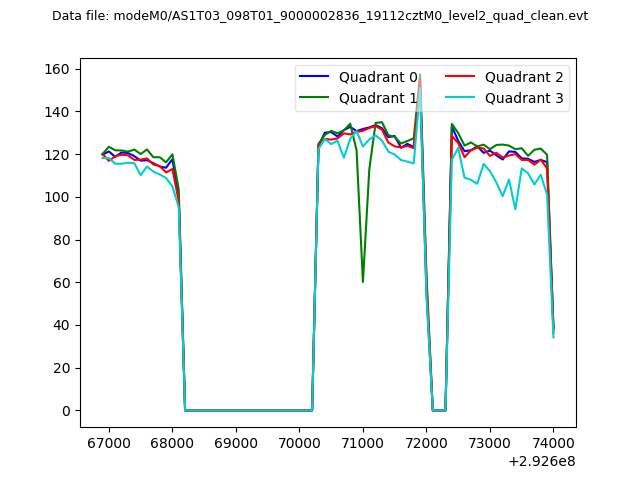 |
|
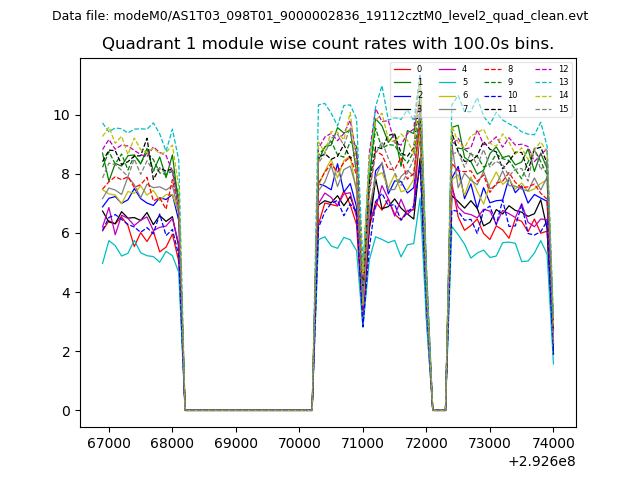
| Module-wise count rates for Quadrant A Data is divided into 100 sec bins |
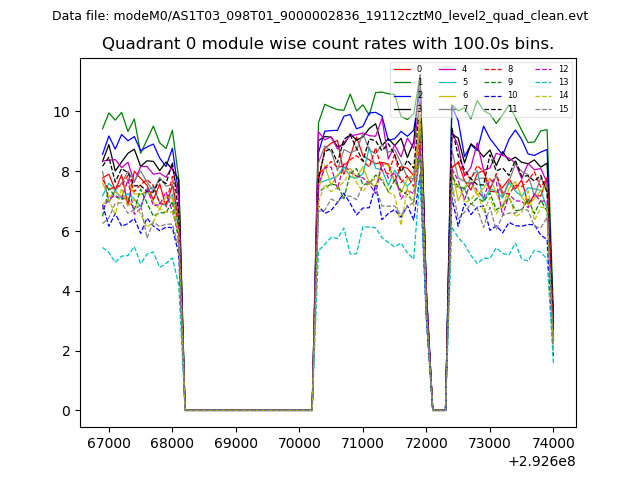 |
 |
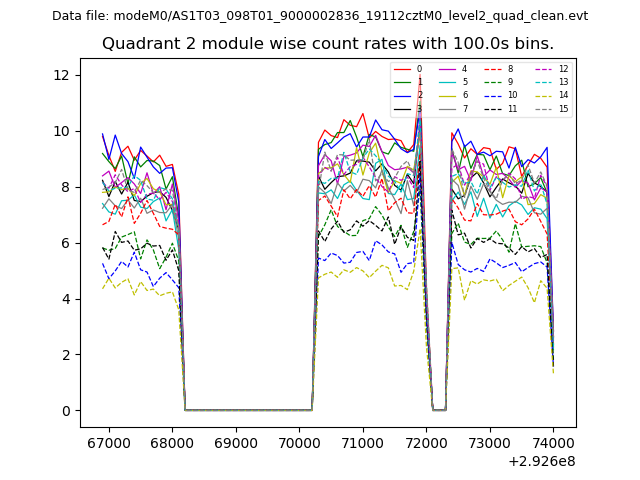
| Module-wise count rates for Quadrant B Data is divided into 100 sec bins |
 |
 |
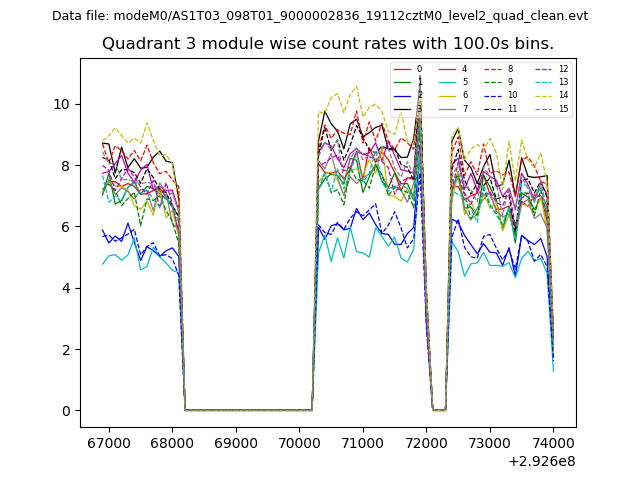
| Module-wise count rates for Quadrant C Data is divided into 100 sec bins |
 |
 |
| Module-wise count rates for Quadrant D Data is divided into 100 sec bins |
 |
 |
| Parameter | Plot |
|---|---|
| CZT HV Monitor | 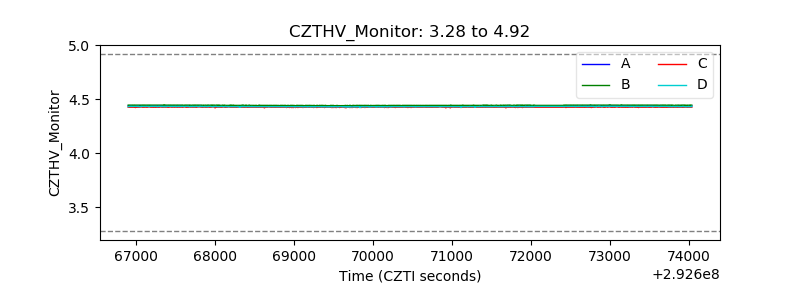 |
| D_VDD | 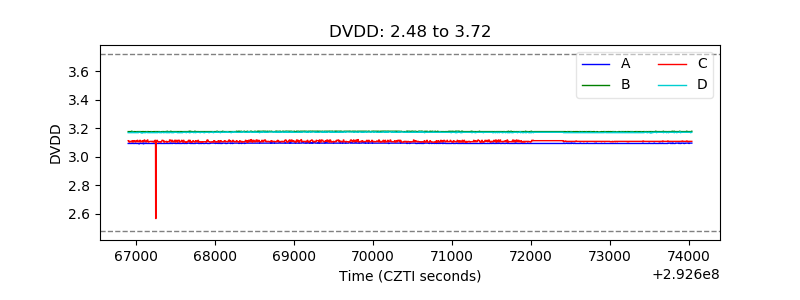 |
| Temperature 1 | 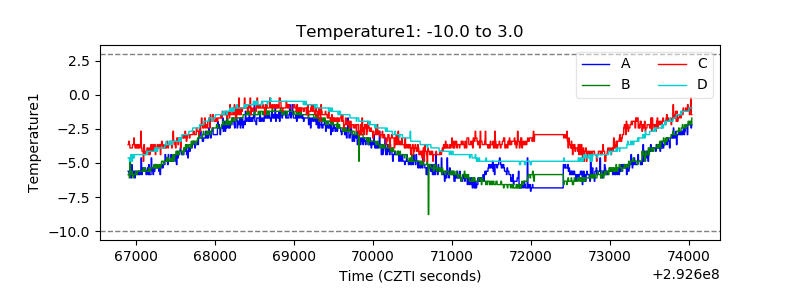 |
| Veto HV Monitor | 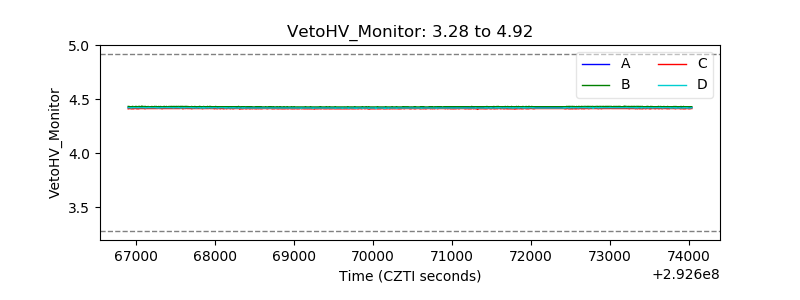 |
| Veto LLD | 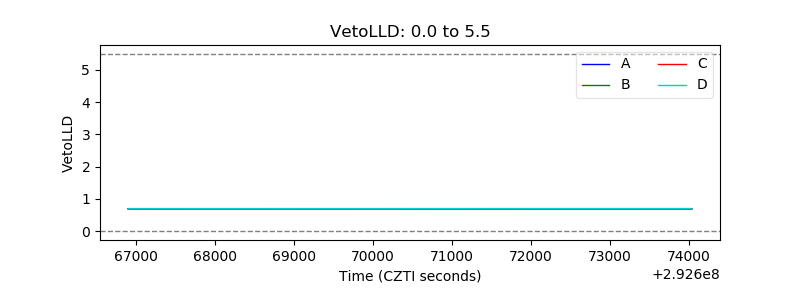 |
| Alpha Counter | 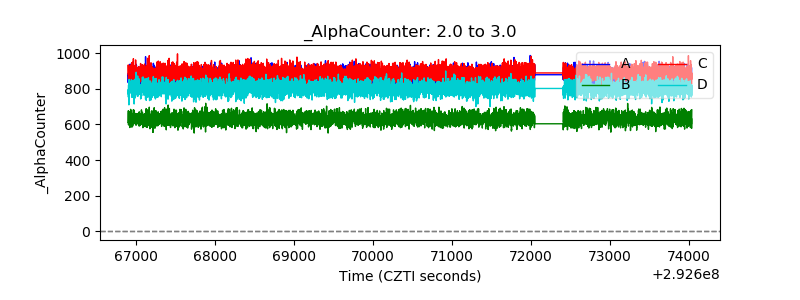 |
| _CPM_Rate | 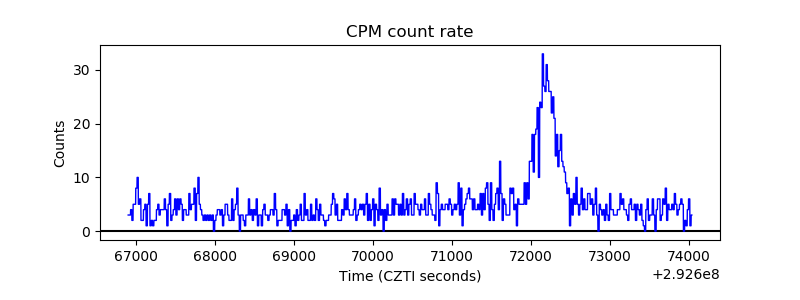 |
| CZT Counter | 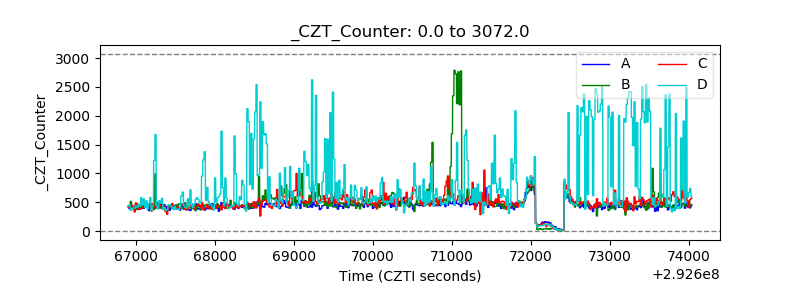 |
| +2.5 Volts monitor |  |
| +5 Volts monitor |  |
| _ROLL_ROT | 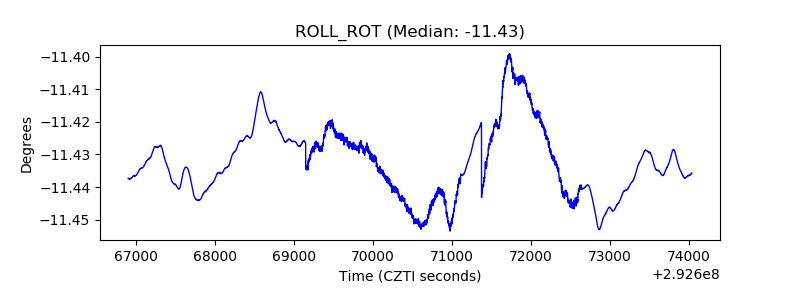 |
| _Roll_DEC | 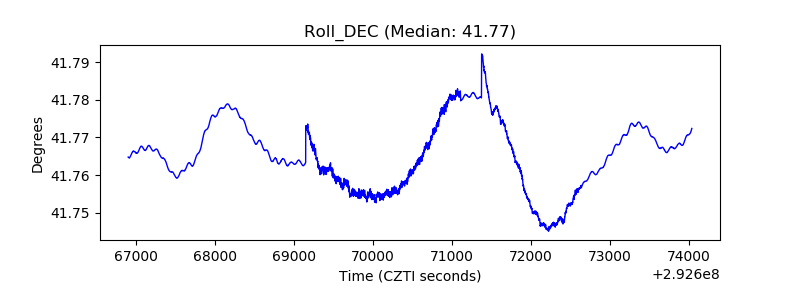 |
| _Roll_RA |  |
| Veto Counter | 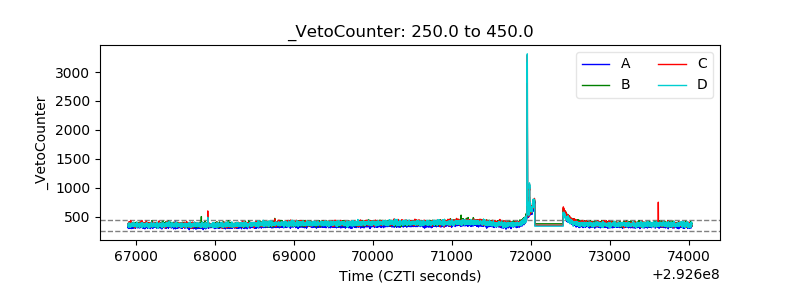 |