| Param | Original file | Final file |
|---|---|---|
| Filename | modeM0/AS1T03_098T01_9000002836_19114cztM0_level2.evt | modeM0/AS1T03_098T01_9000002836_19114cztM0_level2_quad_clean.evt |
| Size (bytes) | 1,036,817,280 | 149,198,400 |
| Size | 988.8 MB | 142.3 MB |
| Events in quadrant A | 5,745,815 | 930,131 |
| Events in quadrant B | 7,593,304 | 930,227 |
| Events in quadrant C | 7,290,111 | 919,938 |
| Events in quadrant D | 9,925,460 | 872,585 |
| Mode M9 | |||
|---|---|---|---|
| Quadrant | BADHDUFLAG | Total packets | Discarded packets |
| A | 0 | 13 | 0 |
| B | 0 | 13 | 0 |
| C | 0 | 13 | 0 |
| D | 0 | 13 | 0 |
| Mode M0 | |||
|---|---|---|---|
| Quadrant | BADHDUFLAG | Total packets | Discarded packets |
| A | 0 | 25333 | 2 |
| B | 0 | 30404 | 2 |
| C | 0 | 29498 | 2 |
| D | 0 | 37784 | 2 |
| Mode SS | |||
|---|---|---|---|
| Quadrant | BADHDUFLAG | Total packets | Discarded packets |
| A | 0 | 254 | 0 |
| B | 0 | 254 | 0 |
| C | 0 | 254 | 0 |
| D | 0 | 254 | 0 |
| Quadrant | Total seconds | Saturated seconds | Saturation percentage |
|---|---|---|---|
| A | 12515 | 115 | 0.918897% |
| B | 12515 | 586 | 4.682381% |
| C | 12515 | 356 | 2.844586% |
| D | 12516 | 938 | 7.494407% |
Noise dominated data is calculated using 1-second bins in cleaned event files. If a bin has >2000 counts, and if more than 50% of those come from <1% of pixels, then it is considered to be noise-dominated and hence unusable.
| Quadrant | # 1 sec bins | Bins with >0 counts | Bins with >2000 counts | High rate bins dominated by noise | Noise dominated (total time) | Noise dominated (detector-on time) | Marked lightcurve |
|---|---|---|---|---|---|---|---|
| A | 13750 | 12517 | 0 | 0 | 0.00% | 0.00% | 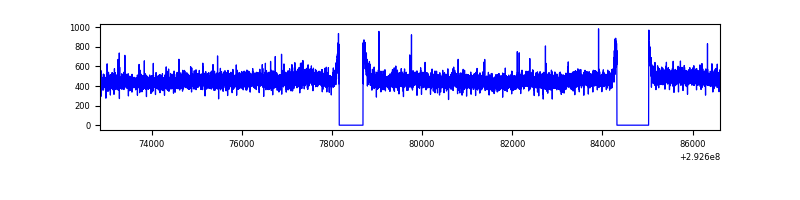 |
| B | 13750 | 12517 | 319 | 319 | 2.32% | 2.55% | 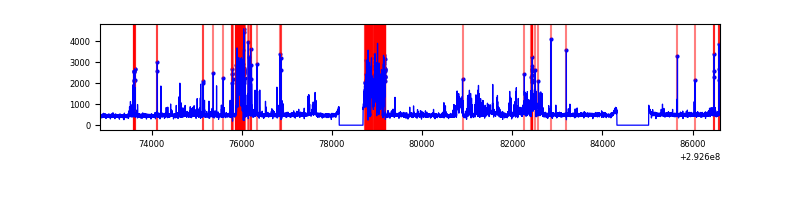 |
| C | 13750 | 12517 | 33 | 33 | 0.24% | 0.26% | 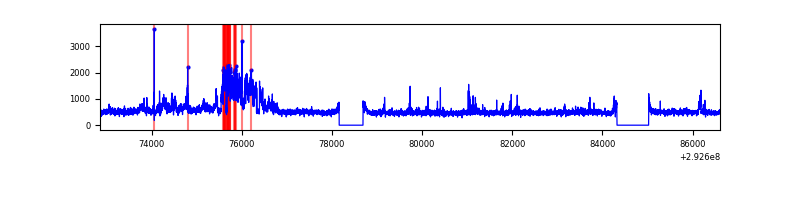 |
| D | 13751 | 12517 | 855 | 855 | 6.22% | 6.83% | 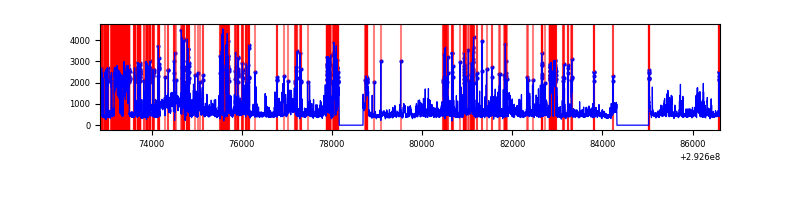 |
Top three noisy pixels from each quadrant. If the there are fewer than three noisy pixels in the level2.evt file, extra rows are filled as -1
| Pixel properties | Quadrant properties | ||||||
|---|---|---|---|---|---|---|---|
| Quadrant | DetID | PixID | Counts | Sigma | Mean | Median | Sigma |
| A | 0 | 226 | 13140 | 38.73 | 1490 | 1456 | 301.7 |
| A | 3 | 137 | 11468 | 33.18 | 1490 | 1456 | 301.7 |
| A | 12 | 194 | 10849 | 31.13 | 1490 | 1456 | 301.7 |
| B | 10 | 245 | 1529836 | 5467.66 | 1465 | 1429 | 279.5 |
| B | 3 | 112 | 60650 | 211.85 | 1465 | 1429 | 279.5 |
| B | 7 | 220 | 53992 | 188.04 | 1465 | 1429 | 279.5 |
| C | 3 | 233 | 1509555 | 4521.22 | 1420 | 1425 | 333.6 |
| C | 14 | 238 | 218627 | 651.15 | 1420 | 1425 | 333.6 |
| C | 0 | 207 | 30653 | 87.62 | 1420 | 1425 | 333.6 |
| D | 7 | 238 | 2320069 | 6727.42 | 1415 | 1376 | 344.7 |
| D | 1 | 52 | 786487 | 2277.91 | 1415 | 1376 | 344.7 |
| D | 11 | 176 | 775118 | 2244.92 | 1415 | 1376 | 344.7 |
Histogram calculated using DETX and DETY for each event in the final _common_clean file
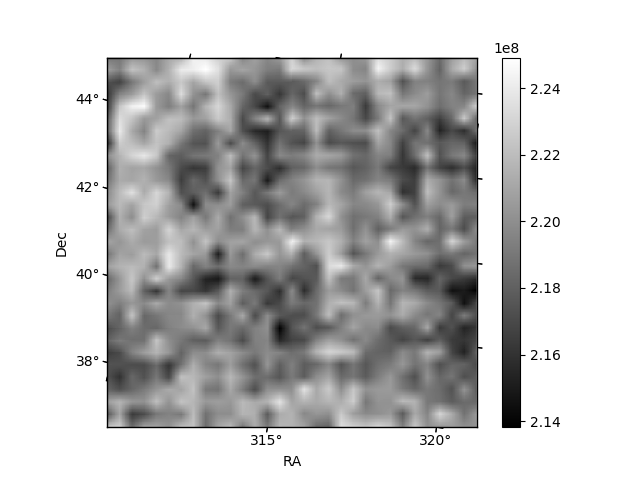
| Quadrant A | 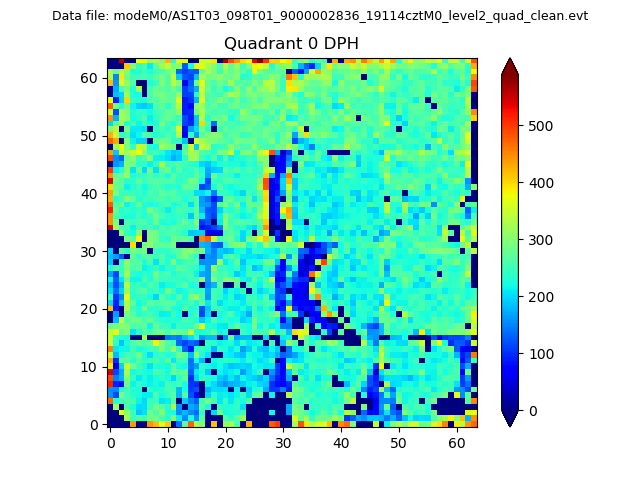 |
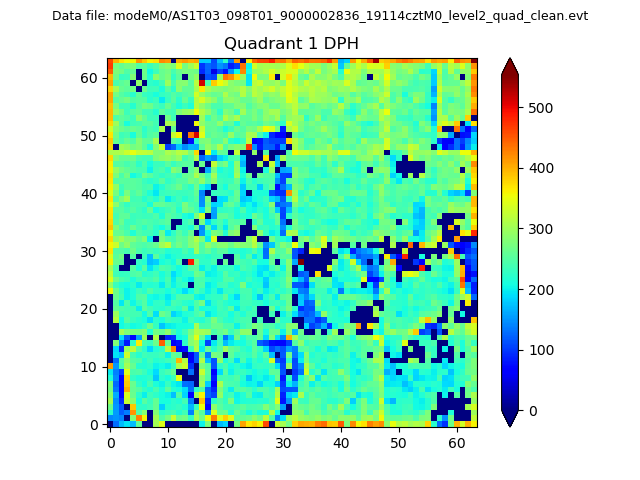 |
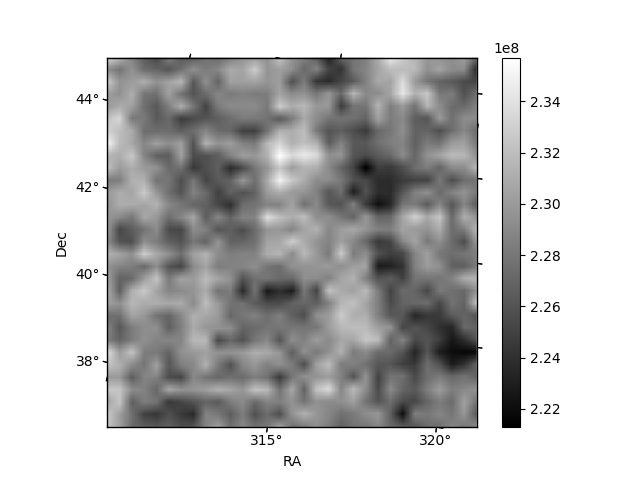
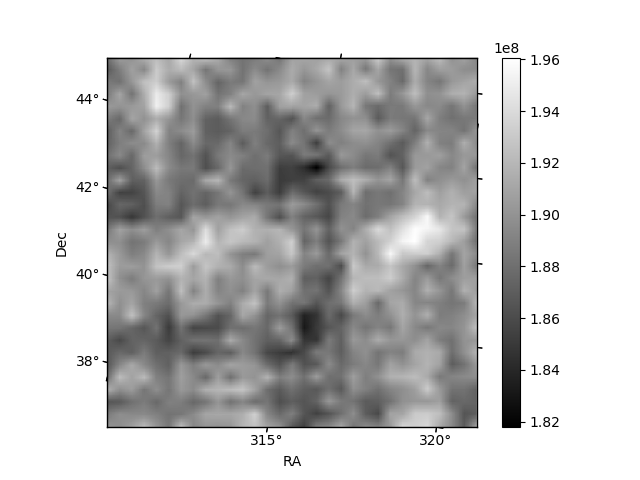
Quadrant B |
|---|---|---|---|
| Quadrant D | 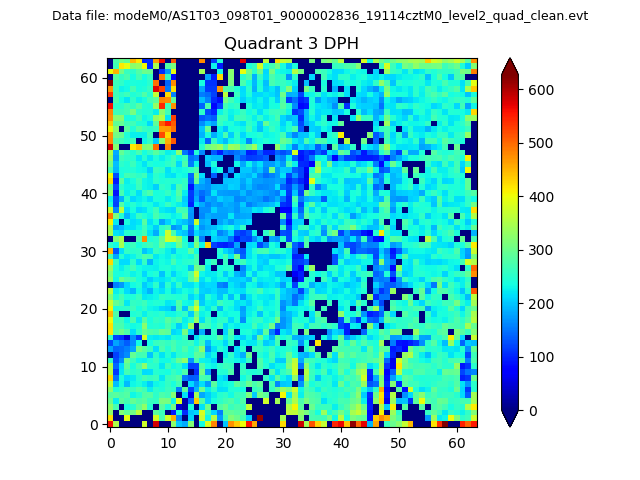 |
 |
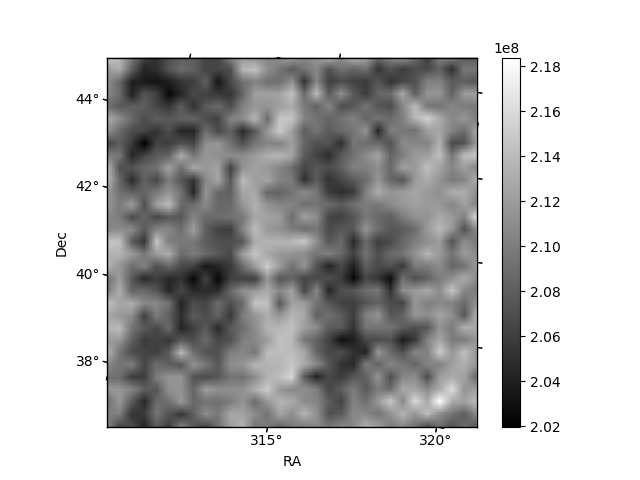
Quadrant C |
| Plot type | Count rate plots | Images |
|---|---|---|
| Comparison with Poisson distribution Blue bars denote a histogram of data divided into 1 sec bins. Red curve is a Poisson curve with rate = median count rate of data. |
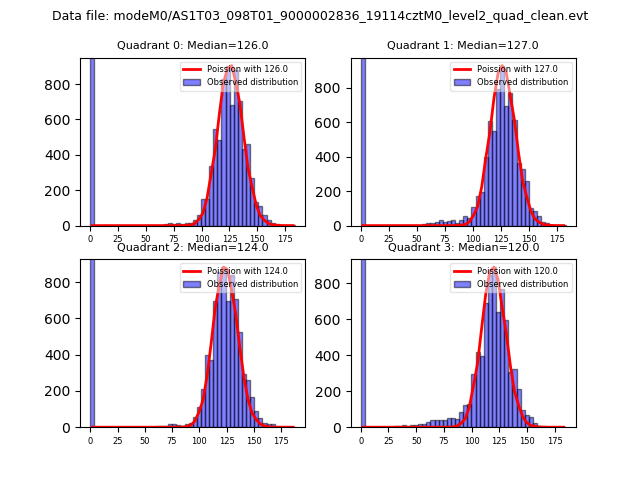 |
 |
| Quadrant-wise count rates Data is divided into 100 sec bins |
 |
|
| Module-wise count rates for Quadrant A Data is divided into 100 sec bins |
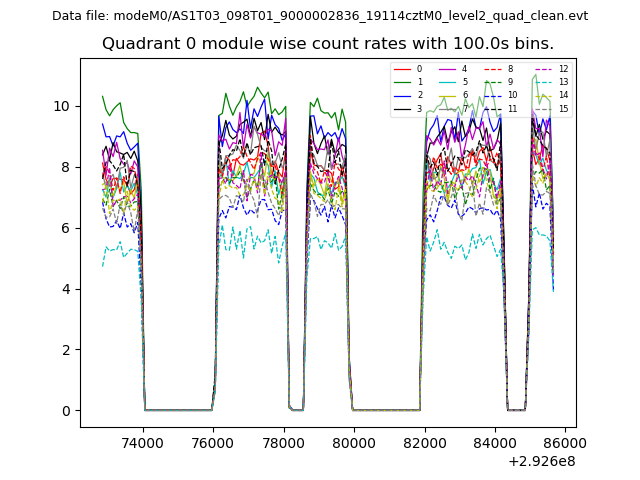 |
 |
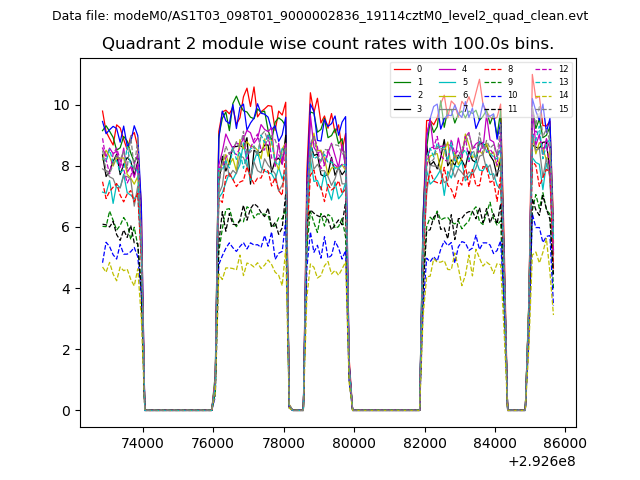
| Module-wise count rates for Quadrant B Data is divided into 100 sec bins |
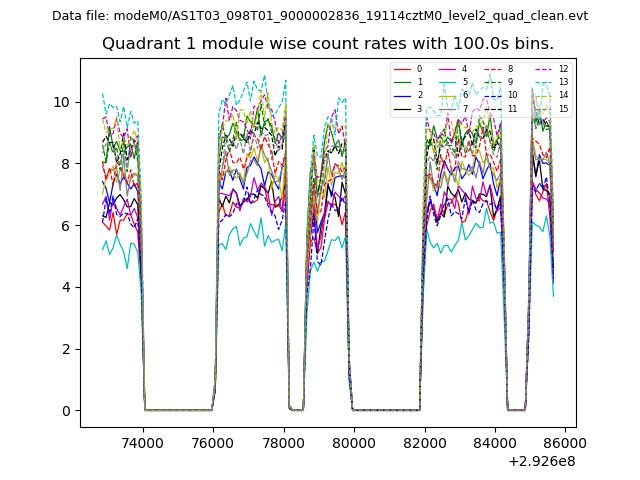 |
 |
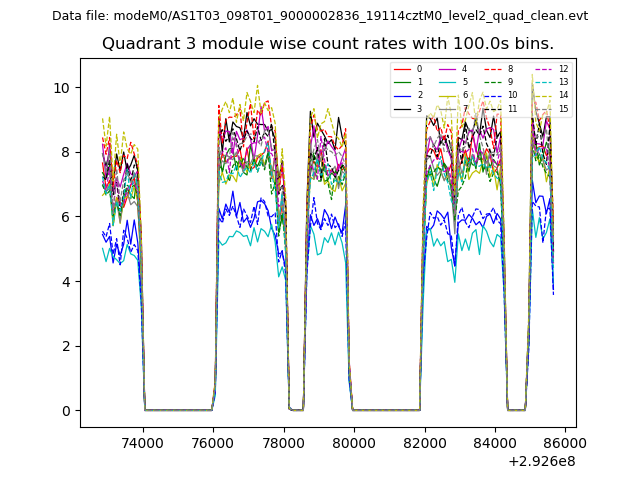
| Module-wise count rates for Quadrant C Data is divided into 100 sec bins |
 |
 |
| Module-wise count rates for Quadrant D Data is divided into 100 sec bins |
 |
 |
| Parameter | Plot |
|---|---|
| CZT HV Monitor | 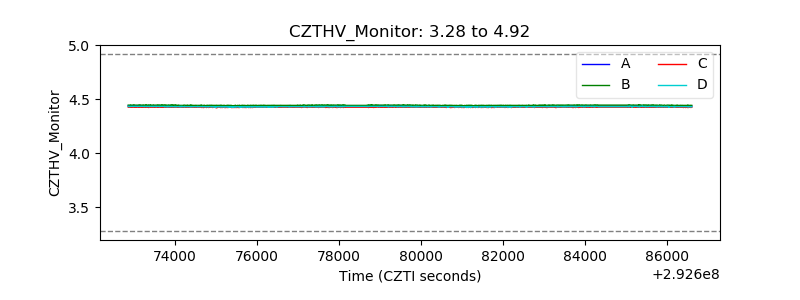 |
| D_VDD | 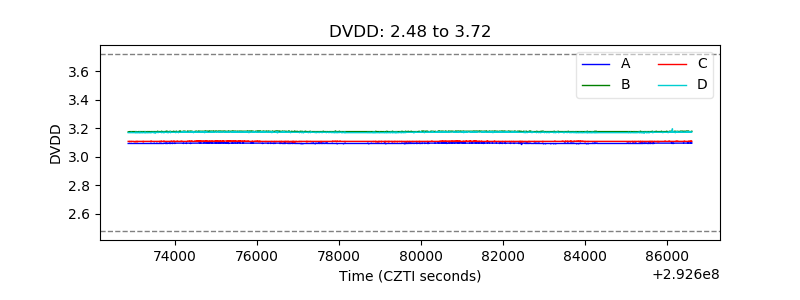 |
| Temperature 1 | 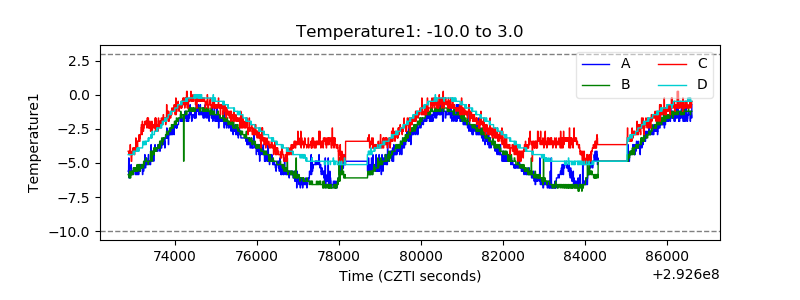 |
| Veto HV Monitor | 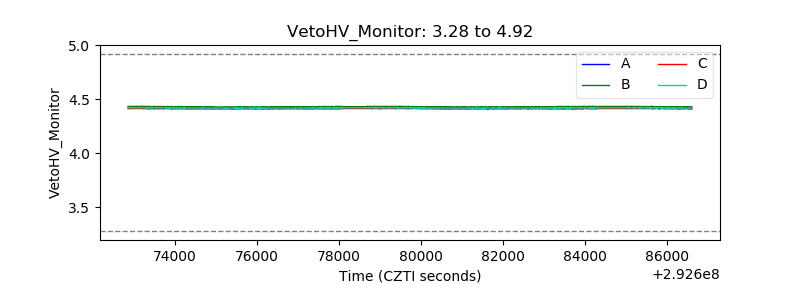 |
| Veto LLD | 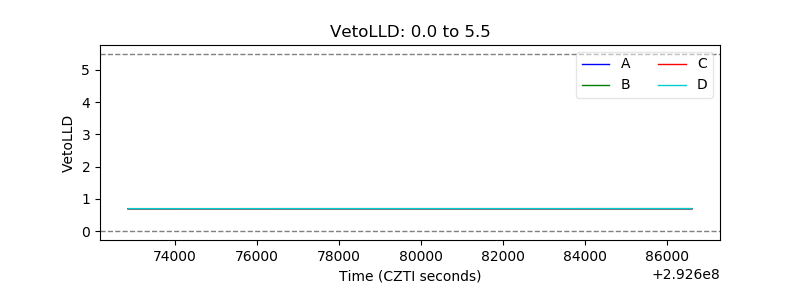 |
| Alpha Counter | 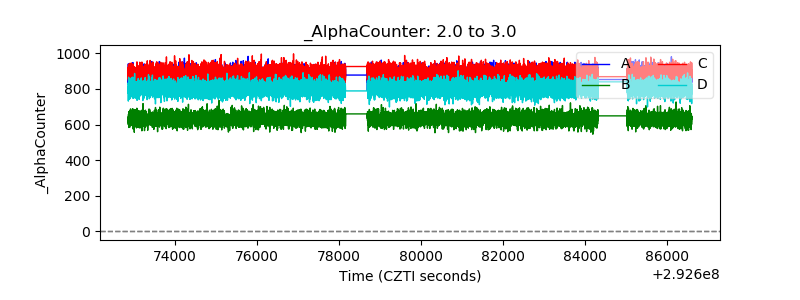 |
| _CPM_Rate | 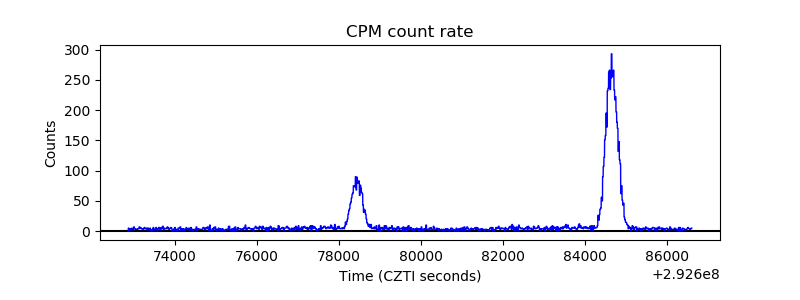 |
| CZT Counter | 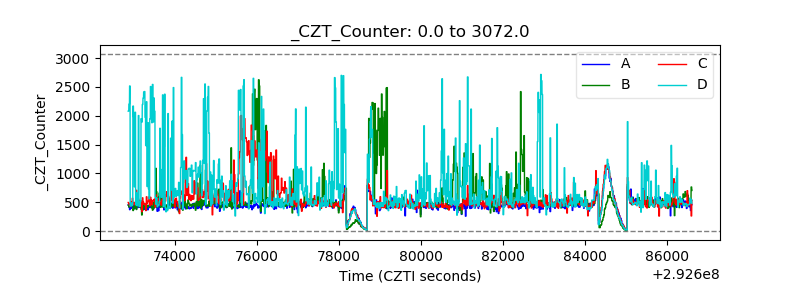 |
| +2.5 Volts monitor |  |
| +5 Volts monitor |  |
| _ROLL_ROT | 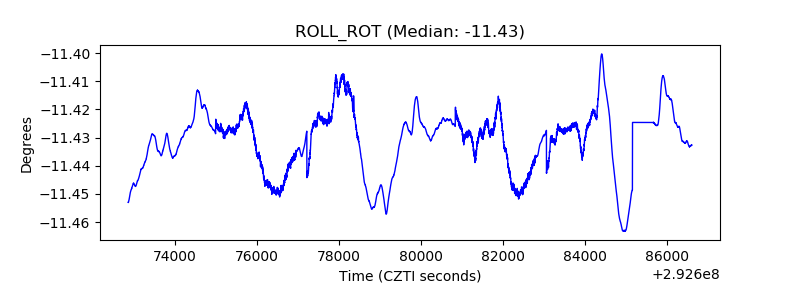 |
| _Roll_DEC | 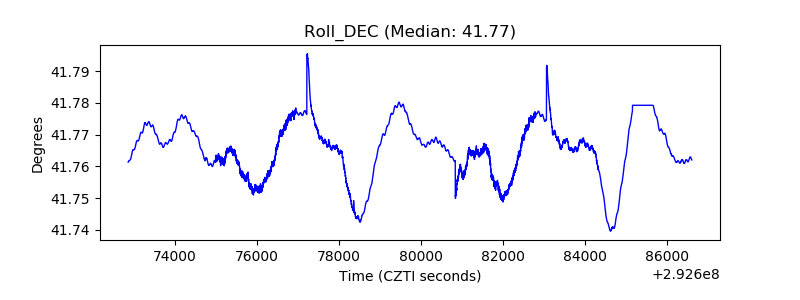 |
| _Roll_RA |  |
| Veto Counter | 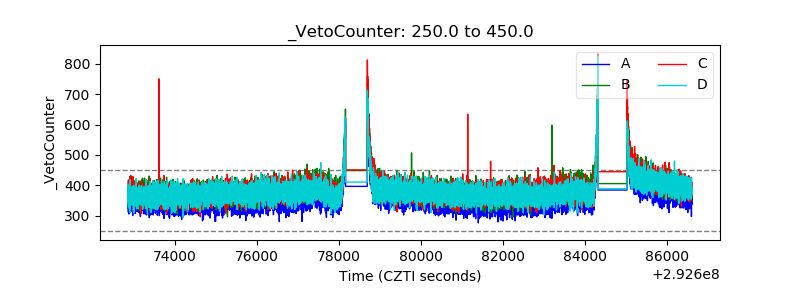 |