| Param | Original file | Final file |
|---|---|---|
| Filename | modeM0/AS1T03_098T01_9000002836_19115cztM0_level2.evt | modeM0/AS1T03_098T01_9000002836_19115cztM0_level2_quad_clean.evt |
| Size (bytes) | 500,428,800 | 65,522,880 |
| Size | 477.2 MB | 62.5 MB |
| Events in quadrant A | 3,018,328 | 390,409 |
| Events in quadrant B | 3,451,483 | 395,080 |
| Events in quadrant C | 3,135,940 | 385,750 |
| Events in quadrant D | 5,114,354 | 364,805 |
| Mode M9 | |||
|---|---|---|---|
| Quadrant | BADHDUFLAG | Total packets | Discarded packets |
| A | 0 | 9 | 0 |
| B | 0 | 9 | 0 |
| C | 0 | 9 | 0 |
| D | 0 | 9 | 0 |
| Mode M0 | |||
|---|---|---|---|
| Quadrant | BADHDUFLAG | Total packets | Discarded packets |
| A | 0 | 13092 | 1 |
| B | 0 | 14335 | 1 |
| C | 0 | 13225 | 1 |
| D | 0 | 19476 | 1 |
| Mode SS | |||
|---|---|---|---|
| Quadrant | BADHDUFLAG | Total packets | Discarded packets |
| A | 0 | 130 | 0 |
| B | 0 | 130 | 0 |
| C | 0 | 130 | 0 |
| D | 0 | 130 | 0 |
| Quadrant | Total seconds | Saturated seconds | Saturation percentage |
|---|---|---|---|
| A | 6417 | 47 | 0.732429% |
| B | 6417 | 94 | 1.464859% |
| C | 6417 | 64 | 0.997351% |
| D | 6417 | 432 | 6.732118% |
Noise dominated data is calculated using 1-second bins in cleaned event files. If a bin has >2000 counts, and if more than 50% of those come from <1% of pixels, then it is considered to be noise-dominated and hence unusable.
| Quadrant | # 1 sec bins | Bins with >0 counts | Bins with >2000 counts | High rate bins dominated by noise | Noise dominated (total time) | Noise dominated (detector-on time) | Marked lightcurve |
|---|---|---|---|---|---|---|---|
| A | 7307 | 6418 | 1 | 1 | 0.01% | 0.02% | 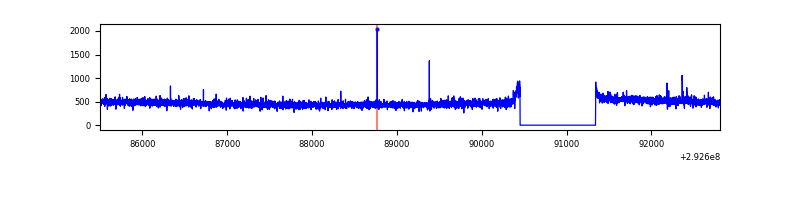 |
| B | 7307 | 6417 | 29 | 29 | 0.40% | 0.45% | 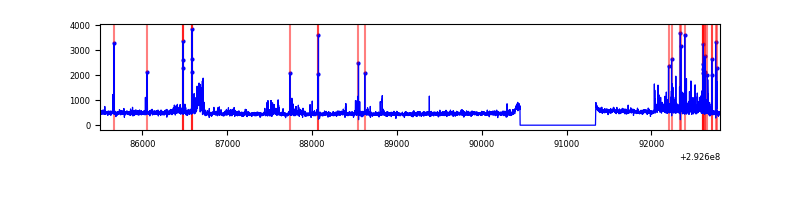 |
| C | 7307 | 6417 | 0 | 0 | 0.00% | 0.00% | 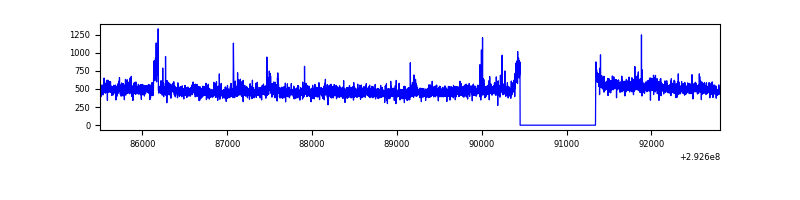 |
| D | 7307 | 6417 | 345 | 345 | 4.72% | 5.38% | 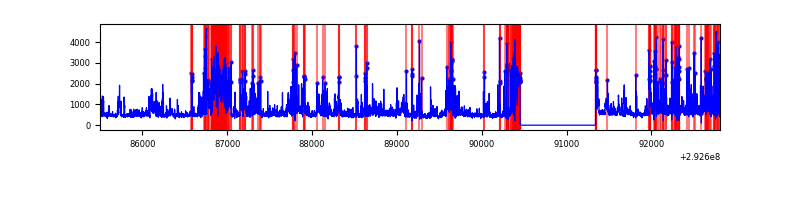 |
Top three noisy pixels from each quadrant. If the there are fewer than three noisy pixels in the level2.evt file, extra rows are filled as -1
| Pixel properties | Quadrant properties | ||||||
|---|---|---|---|---|---|---|---|
| Quadrant | DetID | PixID | Counts | Sigma | Mean | Median | Sigma |
| A | 15 | 174 | 9085 | 51.87 | 781 | 763 | 160.4 |
| A | 13 | 254 | 6873 | 38.08 | 781 | 763 | 160.4 |
| A | 0 | 226 | 6777 | 37.48 | 781 | 763 | 160.4 |
| B | 7 | 220 | 187507 | 1264.8 | 774 | 755 | 147.7 |
| B | 10 | 245 | 97249 | 653.52 | 774 | 755 | 147.7 |
| B | 4 | 216 | 43053 | 286.47 | 774 | 755 | 147.7 |
| C | 14 | 238 | 115209 | 647.7 | 747 | 752 | 176.7 |
| C | 3 | 233 | 106800 | 600.11 | 747 | 752 | 176.7 |
| C | 13 | 61 | 5345 | 25.99 | 747 | 752 | 176.7 |
| D | 12 | 218 | 680732 | 3787.11 | 734 | 713 | 179.6 |
| D | 11 | 176 | 628890 | 3498.4 | 734 | 713 | 179.6 |
| D | 7 | 238 | 530534 | 2950.64 | 734 | 713 | 179.6 |
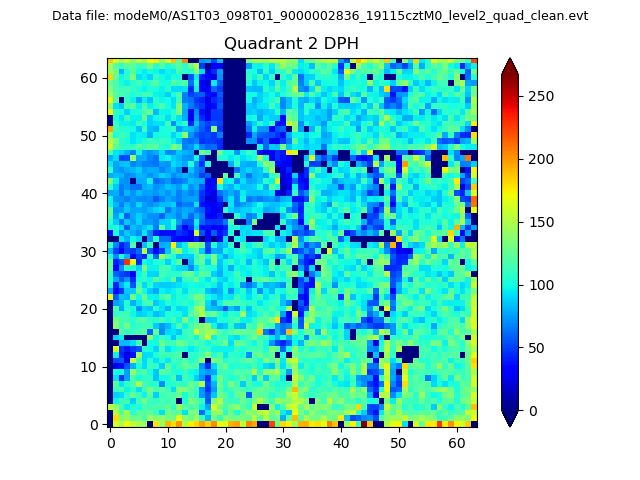
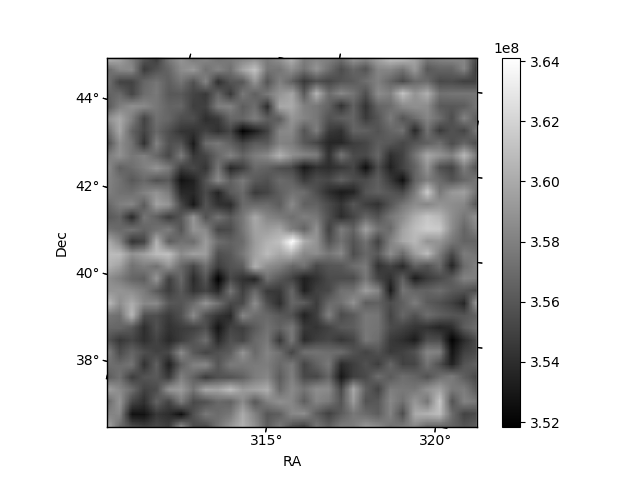
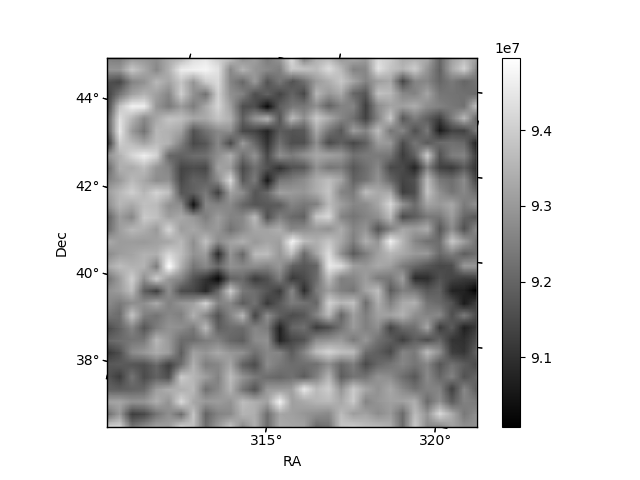
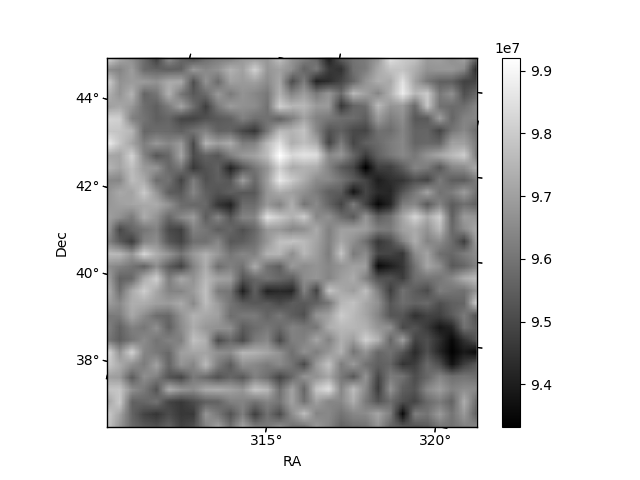
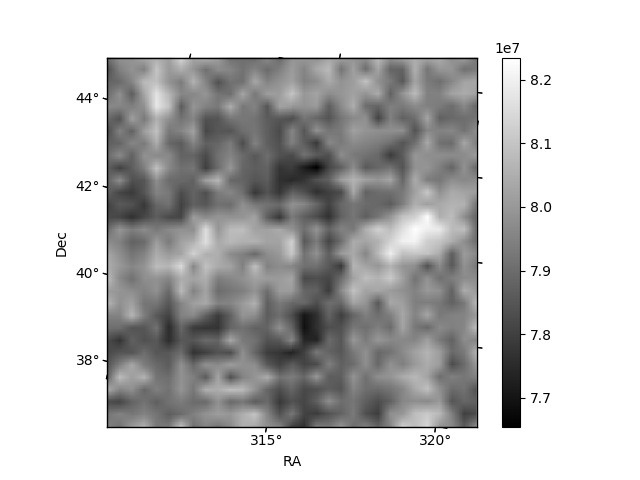
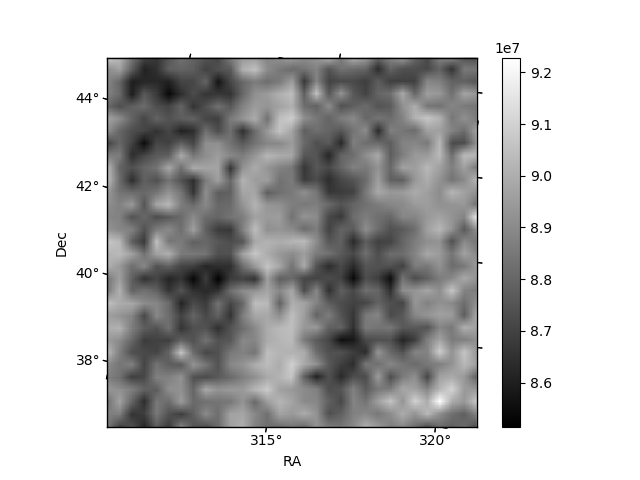
Histogram calculated using DETX and DETY for each event in the final _common_clean file
| Quadrant A | 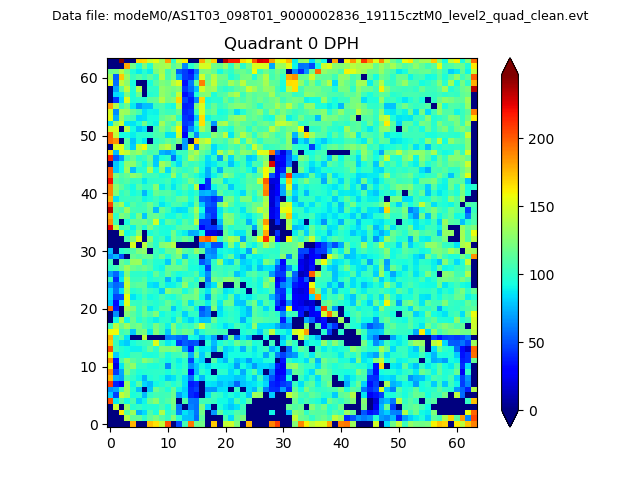 |
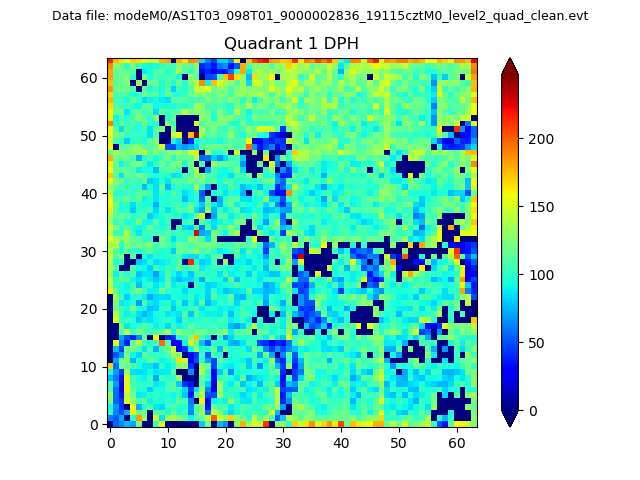 |
Quadrant B |
|---|---|---|---|
| Quadrant D | 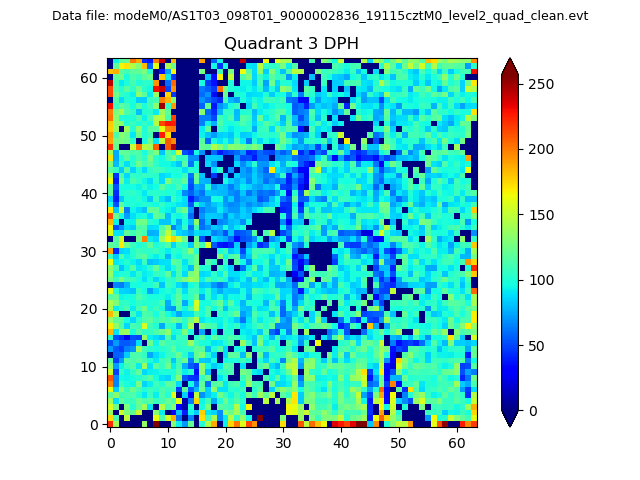 |
 |
Quadrant C |
| Plot type | Count rate plots | Images |
|---|---|---|
| Comparison with Poisson distribution Blue bars denote a histogram of data divided into 1 sec bins. Red curve is a Poisson curve with rate = median count rate of data. |
 |
 |
| Quadrant-wise count rates Data is divided into 100 sec bins |
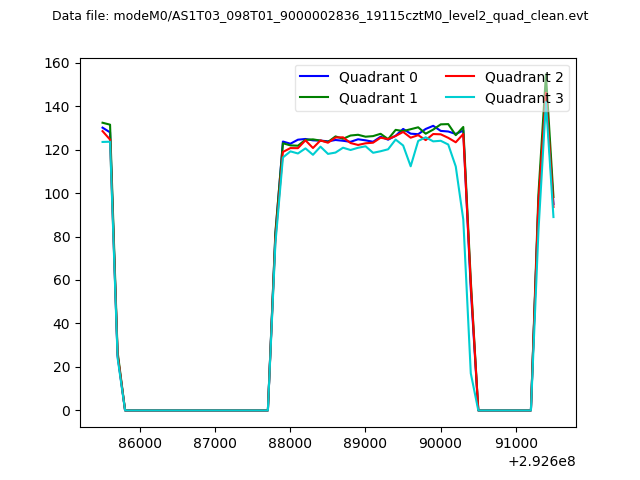 |
|
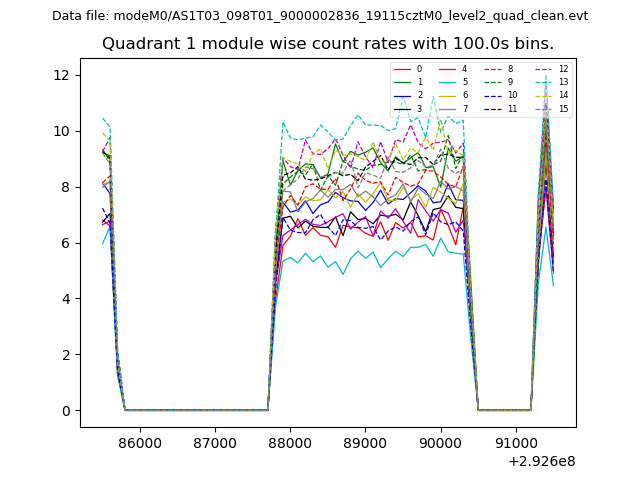
| Module-wise count rates for Quadrant A Data is divided into 100 sec bins |
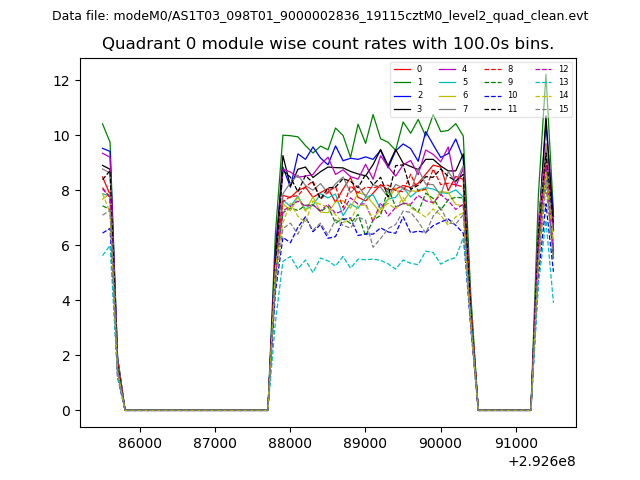 |
 |
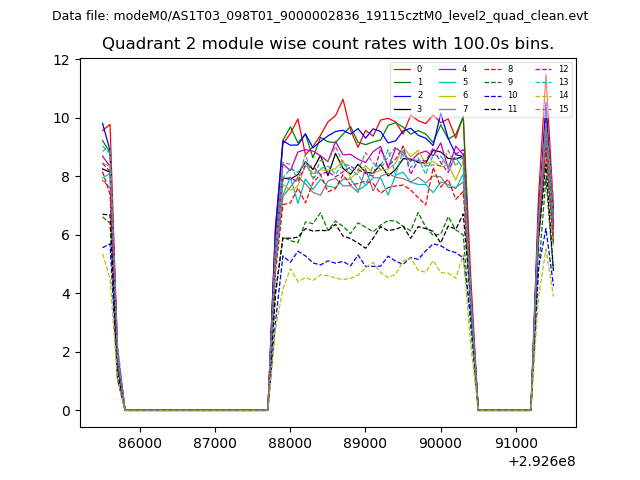
| Module-wise count rates for Quadrant B Data is divided into 100 sec bins |
 |
 |
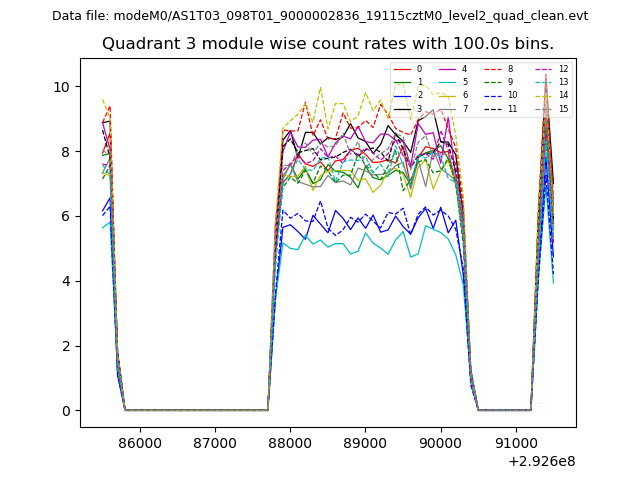
| Module-wise count rates for Quadrant C Data is divided into 100 sec bins |
 |
 |
| Module-wise count rates for Quadrant D Data is divided into 100 sec bins |
 |
 |
| Parameter | Plot |
|---|---|
| CZT HV Monitor | 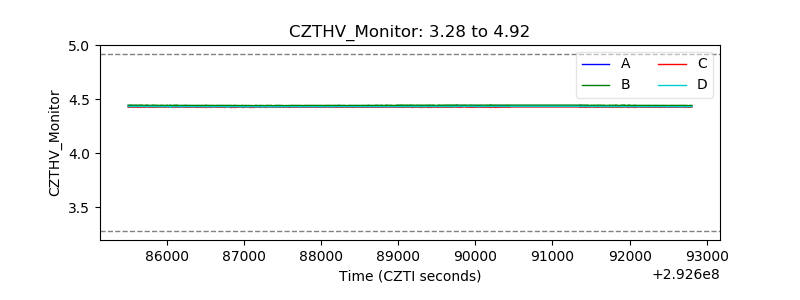 |
| D_VDD | 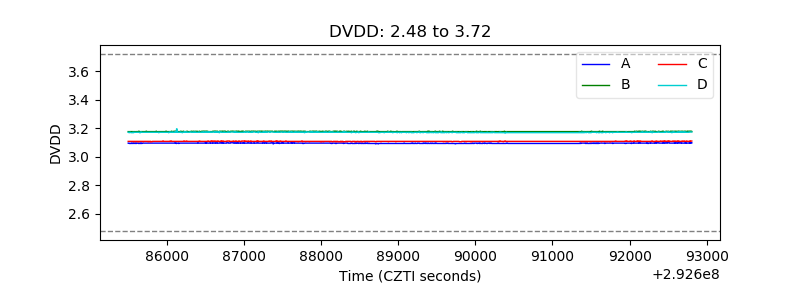 |
| Temperature 1 | 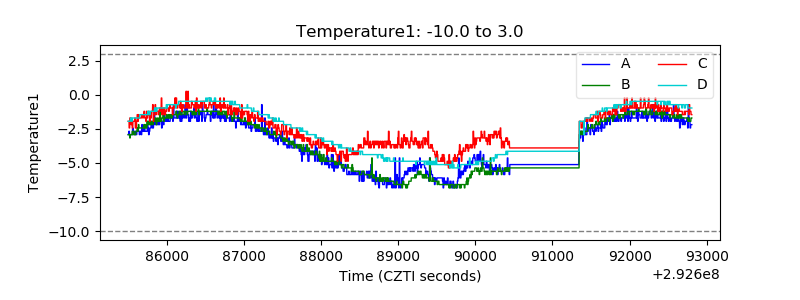 |
| Veto HV Monitor | 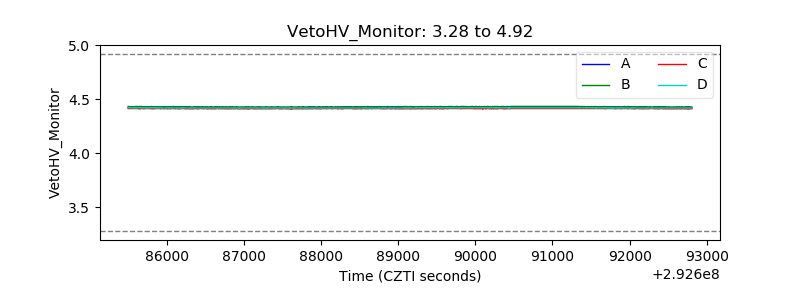 |
| Veto LLD | 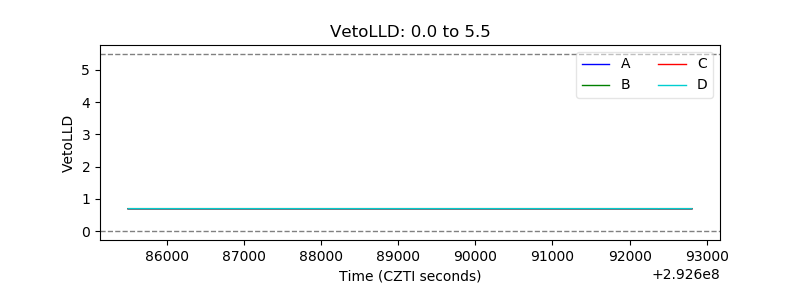 |
| Alpha Counter | 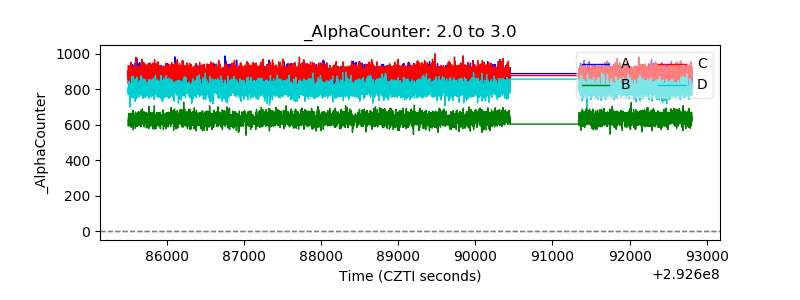 |
| _CPM_Rate | 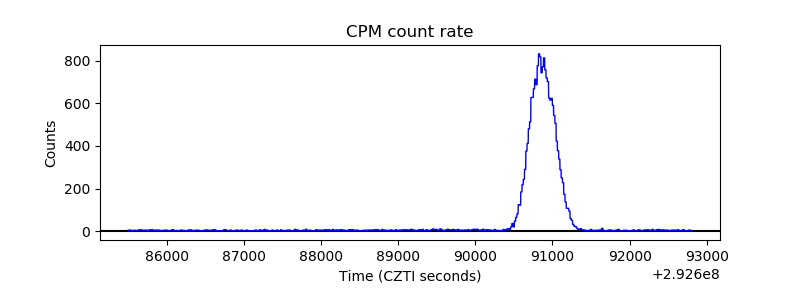 |
| CZT Counter | 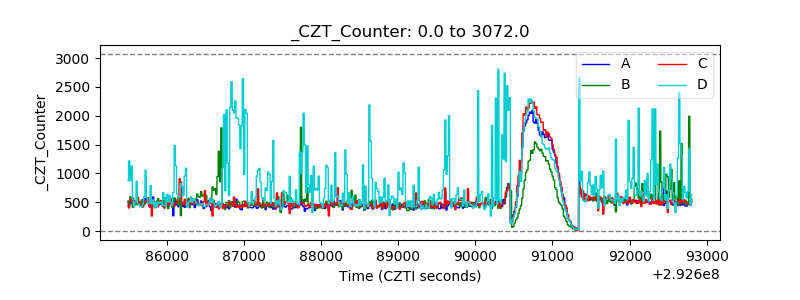 |
| +2.5 Volts monitor | 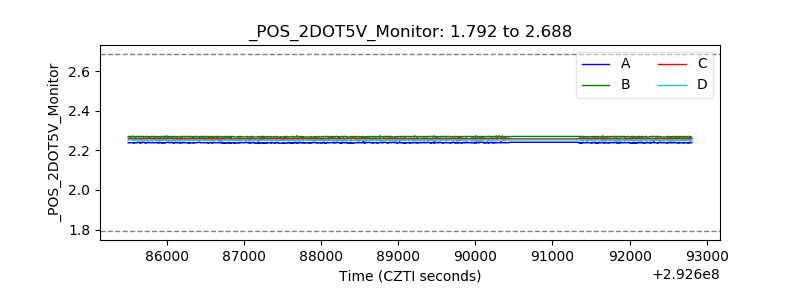 |
| +5 Volts monitor |  |
| _ROLL_ROT | 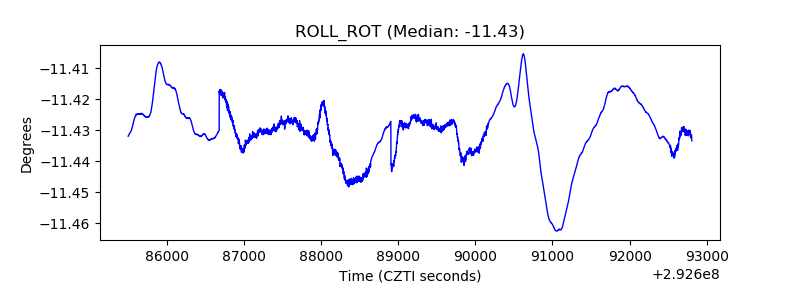 |
| _Roll_DEC | 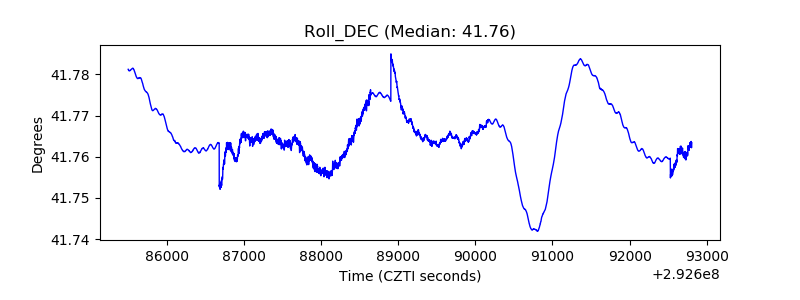 |
| _Roll_RA | 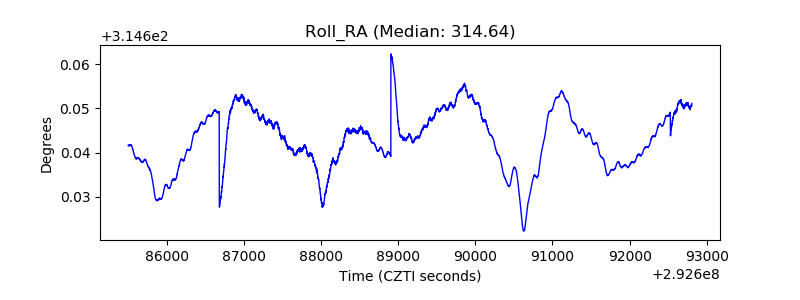 |
| Veto Counter | 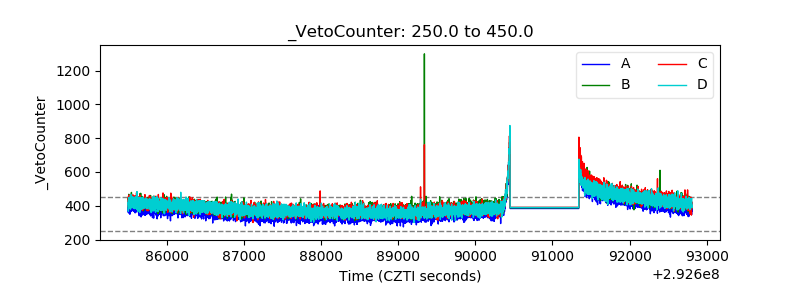 |