| Param | Original file | Final file |
|---|---|---|
| Filename | modeM0/AS1T03_098T01_9000002836_19116cztM0_level2.evt | modeM0/AS1T03_098T01_9000002836_19116cztM0_level2_quad_clean.evt |
| Size (bytes) | 246,263,040 | 17,994,240 |
| Size | 234.9 MB | 17.2 MB |
| Events in quadrant A | 1,332,023 | 88,159 |
| Events in quadrant B | 1,636,548 | 88,527 |
| Events in quadrant C | 1,367,403 | 86,730 |
| Events in quadrant D | 2,928,969 | 79,250 |
| Mode M0 | |||
|---|---|---|---|
| Quadrant | BADHDUFLAG | Total packets | Discarded packets |
| A | 0 | 5711 | 0 |
| B | 0 | 6708 | 0 |
| C | 0 | 5733 | 0 |
| D | 0 | 10589 | 0 |
| Mode SS | |||
|---|---|---|---|
| Quadrant | BADHDUFLAG | Total packets | Discarded packets |
| A | 0 | 56 | 0 |
| B | 0 | 56 | 0 |
| C | 0 | 56 | 0 |
| D | 0 | 56 | 0 |
| Quadrant | Total seconds | Saturated seconds | Saturation percentage |
|---|---|---|---|
| A | 2818 | 5 | 0.177431% |
| B | 2818 | 52 | 1.845280% |
| C | 2818 | 14 | 0.496806% |
| D | 2819 | 466 | 16.530685% |
Noise dominated data is calculated using 1-second bins in cleaned event files. If a bin has >2000 counts, and if more than 50% of those come from <1% of pixels, then it is considered to be noise-dominated and hence unusable.
| Quadrant | # 1 sec bins | Bins with >0 counts | Bins with >2000 counts | High rate bins dominated by noise | Noise dominated (total time) | Noise dominated (detector-on time) | Marked lightcurve |
|---|---|---|---|---|---|---|---|
| A | 2818 | 2818 | 0 | 0 | 0.00% | 0.00% | 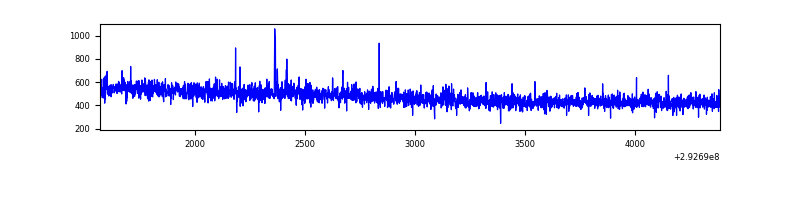 |
| B | 2818 | 2818 | 24 | 24 | 0.85% | 0.85% | 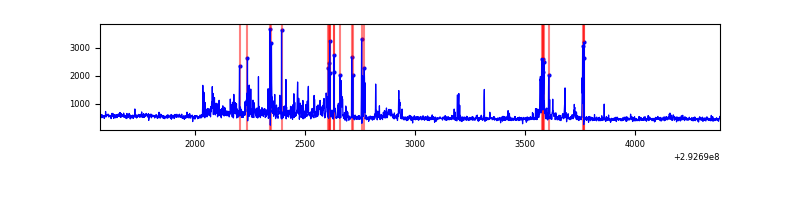 |
| C | 2818 | 2818 | 0 | 0 | 0.00% | 0.00% | 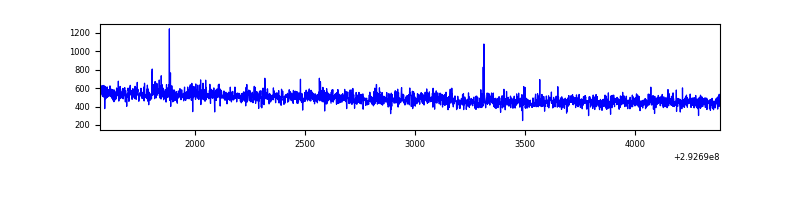 |
| D | 2819 | 2819 | 350 | 350 | 12.42% | 12.42% | 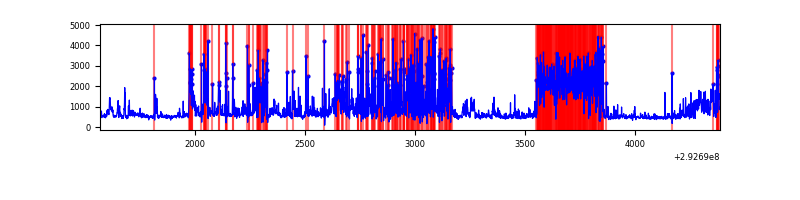 |
Top three noisy pixels from each quadrant. If the there are fewer than three noisy pixels in the level2.evt file, extra rows are filled as -1
| Pixel properties | Quadrant properties | ||||||
|---|---|---|---|---|---|---|---|
| Quadrant | DetID | PixID | Counts | Sigma | Mean | Median | Sigma |
| A | 15 | 174 | 5755 | 75.8 | 344 | 336 | 71.5 |
| A | 0 | 226 | 2987 | 37.08 | 344 | 336 | 71.5 |
| A | 12 | 194 | 2542 | 30.86 | 344 | 336 | 71.5 |
| B | 7 | 220 | 240691 | 3626.86 | 340 | 332 | 66.3 |
| B | 0 | 197 | 16295 | 240.87 | 340 | 332 | 66.3 |
| B | 4 | 216 | 14838 | 218.89 | 340 | 332 | 66.3 |
| C | 14 | 238 | 51517 | 646.1 | 331 | 333 | 79.2 |
| C | 3 | 233 | 21131 | 262.53 | 331 | 333 | 79.2 |
| C | 0 | 207 | 2396 | 26.04 | 331 | 333 | 79.2 |
| D | 7 | 238 | 1196211 | 15232.4 | 315 | 306 | 78.5 |
| D | 11 | 176 | 266336 | 3388.46 | 315 | 306 | 78.5 |
| D | 1 | 52 | 168463 | 2141.84 | 315 | 306 | 78.5 |
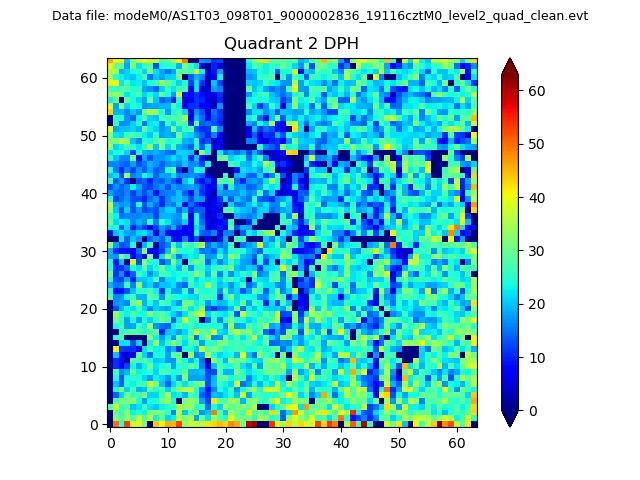
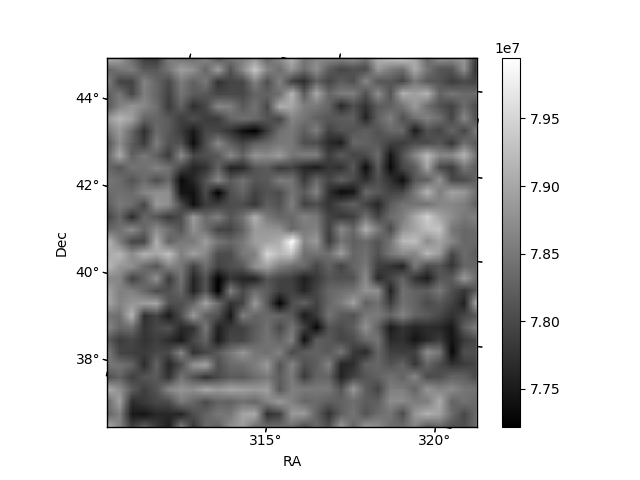
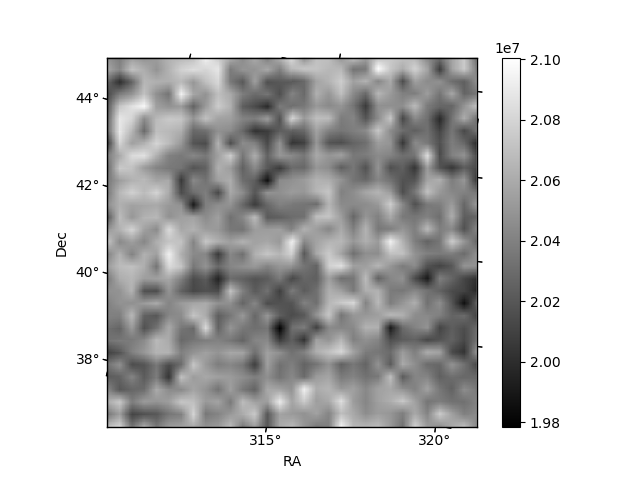
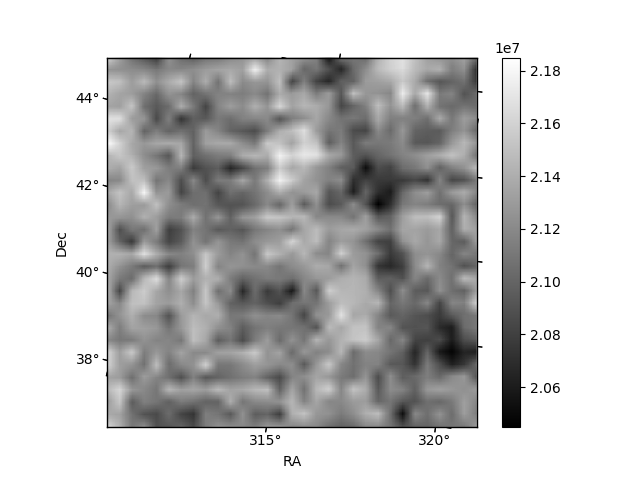
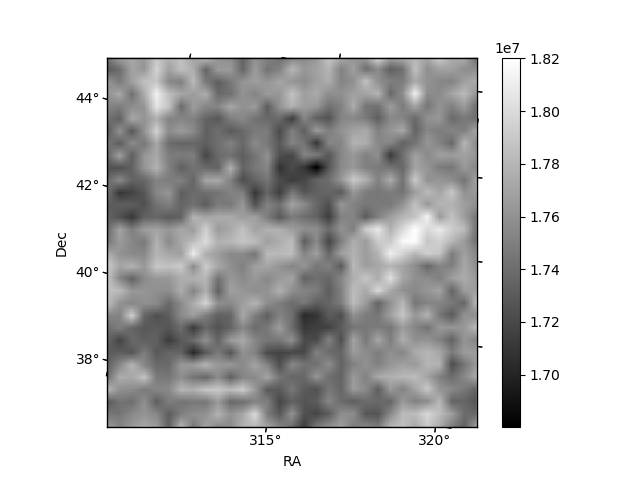
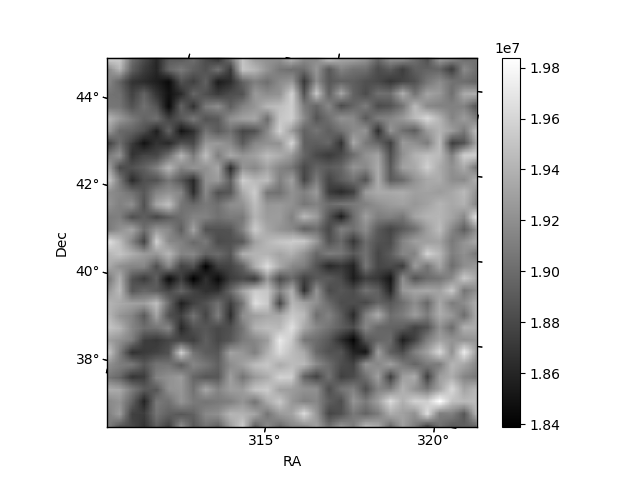
Histogram calculated using DETX and DETY for each event in the final _common_clean file
| Quadrant A | 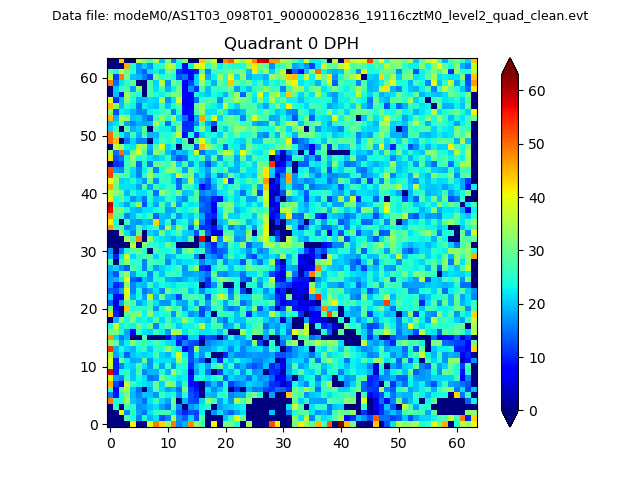 |
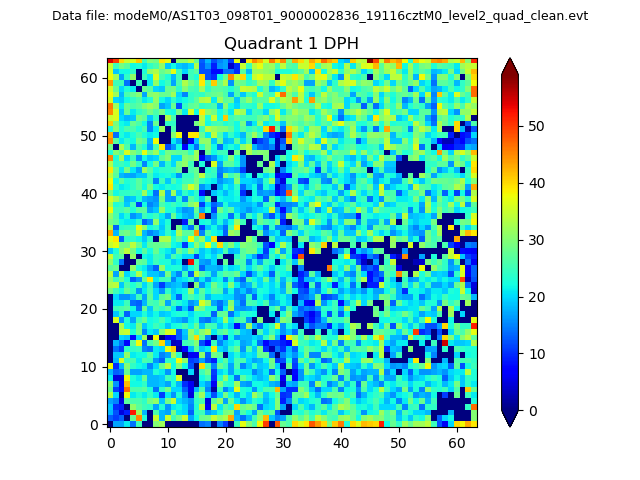 |
Quadrant B |
|---|---|---|---|
| Quadrant D | 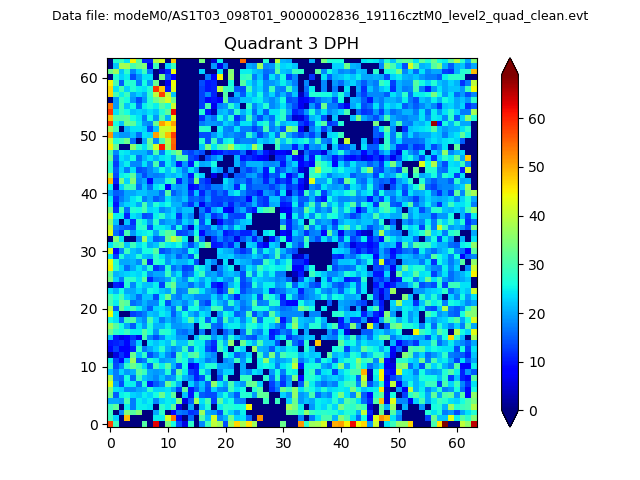 |
 |
Quadrant C |
| Plot type | Count rate plots | Images |
|---|---|---|
| Comparison with Poisson distribution Blue bars denote a histogram of data divided into 1 sec bins. Red curve is a Poisson curve with rate = median count rate of data. |
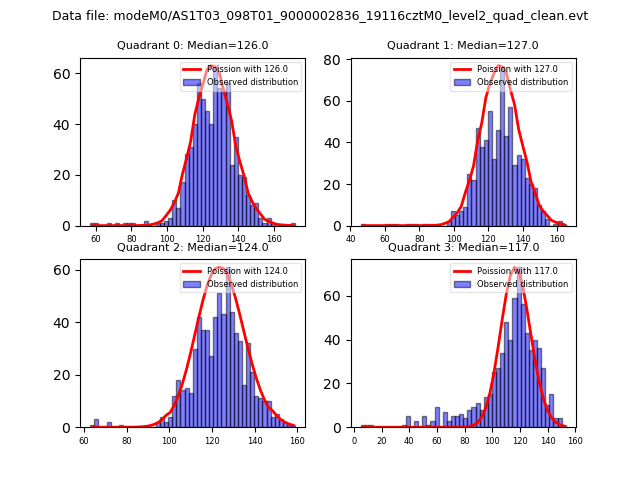 |
 |
| Quadrant-wise count rates Data is divided into 100 sec bins |
 |
|
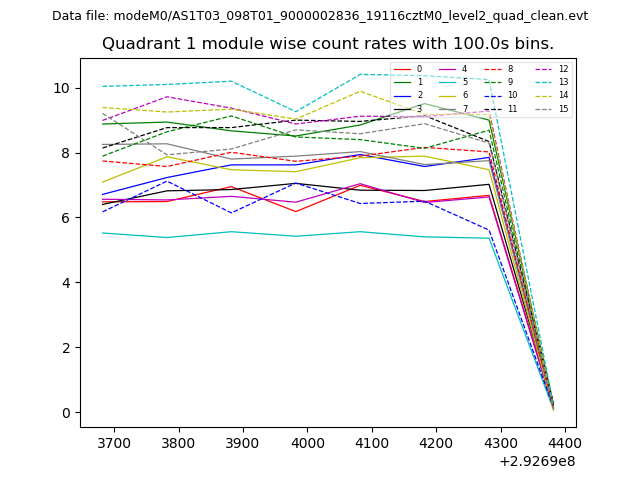
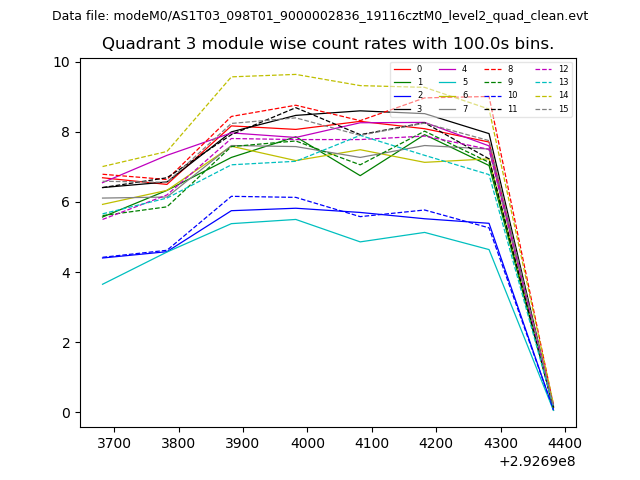
| Module-wise count rates for Quadrant A Data is divided into 100 sec bins |
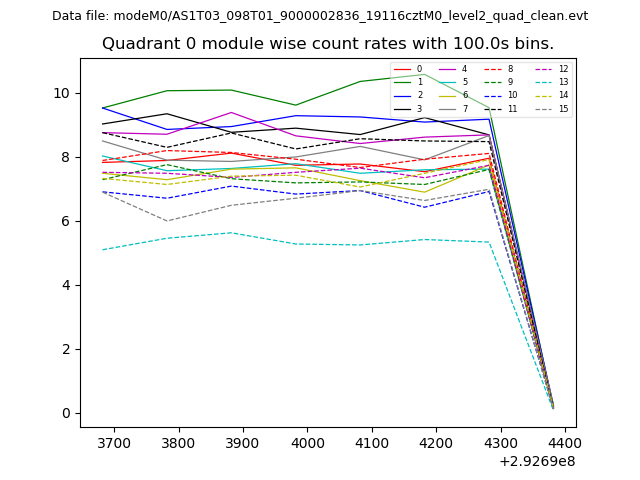 |
 |
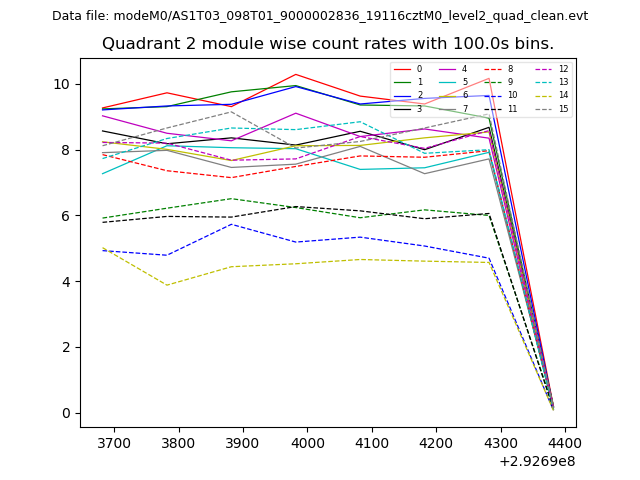
| Module-wise count rates for Quadrant B Data is divided into 100 sec bins |
 |
 |
| Module-wise count rates for Quadrant C Data is divided into 100 sec bins |
 |
 |
| Module-wise count rates for Quadrant D Data is divided into 100 sec bins |
 |
 |
| Parameter | Plot |
|---|---|
| CZT HV Monitor | 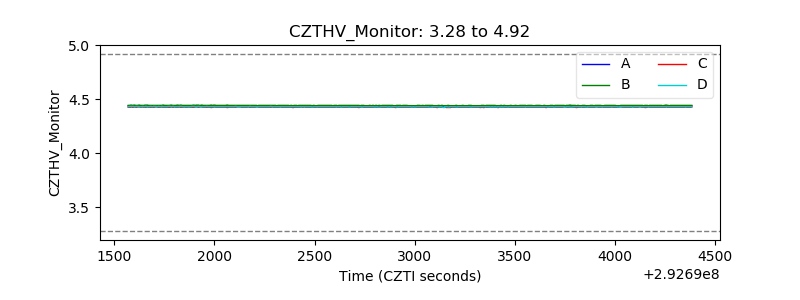 |
| D_VDD | 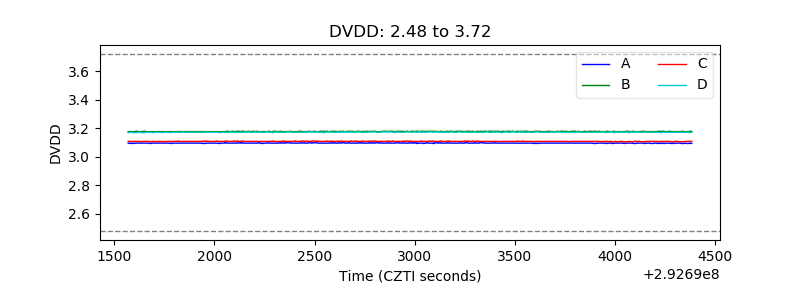 |
| Temperature 1 | 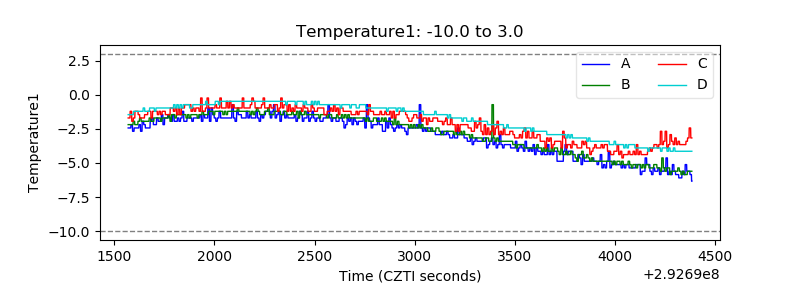 |
| Veto HV Monitor | 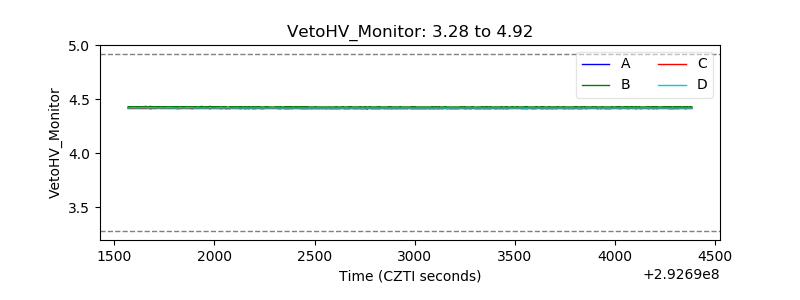 |
| Veto LLD |  |
| Alpha Counter | 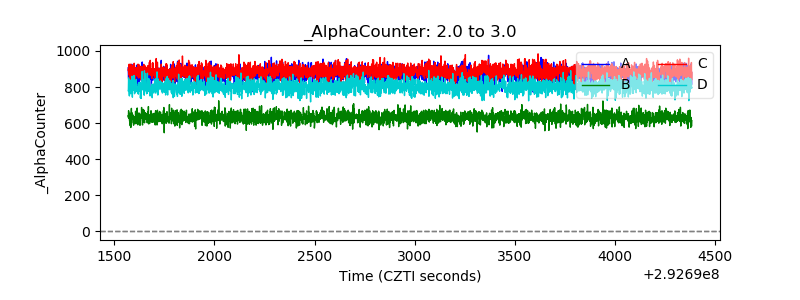 |
| _CPM_Rate | 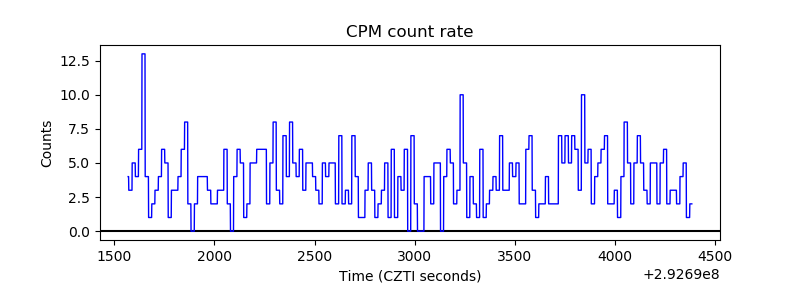 |
| CZT Counter | 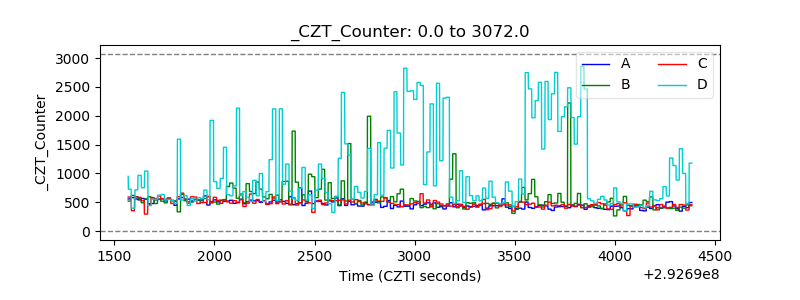 |
| +2.5 Volts monitor |  |
| +5 Volts monitor |  |
| _ROLL_ROT | 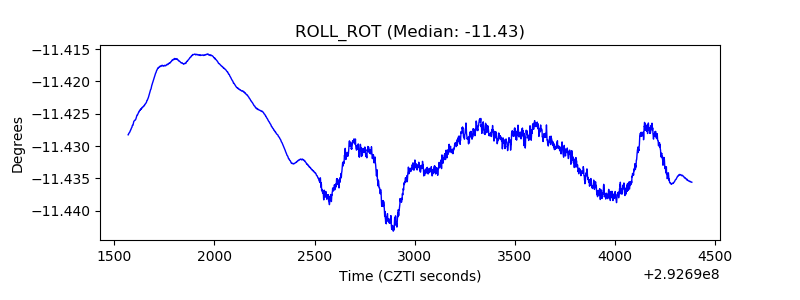 |
| _Roll_DEC | 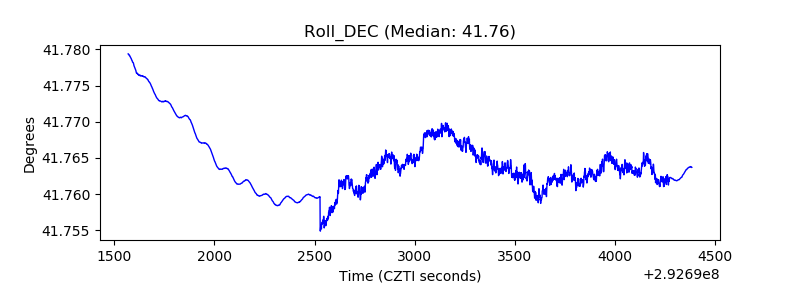 |
| _Roll_RA | 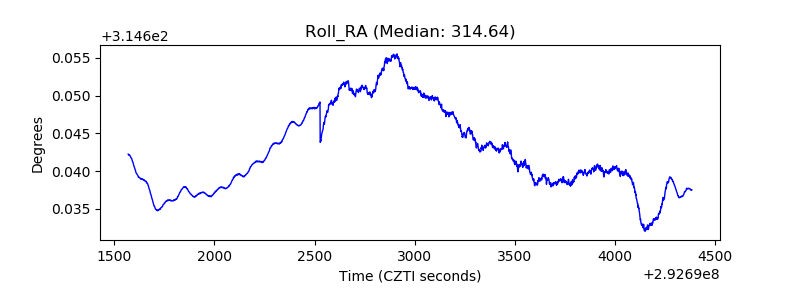 |
| Veto Counter | 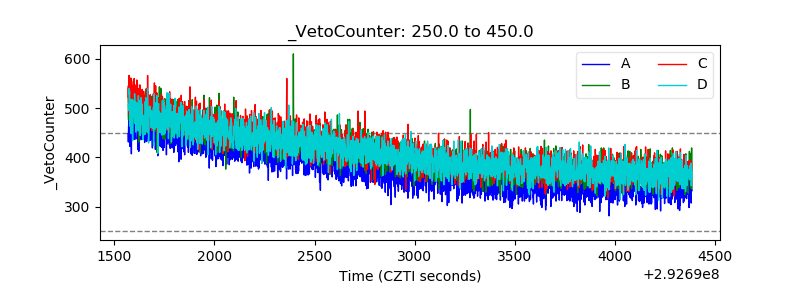 |