| Param | Original file | Final file |
|---|---|---|
| Filename | modeM0/AS1A05_046T01_9000002838_19116cztM0_level2.evt | modeM0/AS1A05_046T01_9000002838_19116cztM0_level2_quad_clean.evt |
| Size (bytes) | 244,926,720 | 31,826,880 |
| Size | 233.6 MB | 30.4 MB |
| Events in quadrant A | 1,412,567 | 194,552 |
| Events in quadrant B | 1,562,138 | 197,580 |
| Events in quadrant C | 1,410,323 | 191,508 |
| Events in quadrant D | 2,847,405 | 186,158 |
| Mode M0 | |||
|---|---|---|---|
| Quadrant | BADHDUFLAG | Total packets | Discarded packets |
| A | 0 | 5844 | 1 |
| B | 0 | 6352 | 1 |
| C | 0 | 5790 | 1 |
| D | 0 | 10214 | 1 |
| Mode SS | |||
|---|---|---|---|
| Quadrant | BADHDUFLAG | Total packets | Discarded packets |
| A | 0 | 56 | 0 |
| B | 0 | 56 | 0 |
| C | 0 | 56 | 0 |
| D | 0 | 56 | 0 |
| Mode M9 | |||
|---|---|---|---|
| Quadrant | BADHDUFLAG | Total packets | Discarded packets |
| A | 0 | 10 | 0 |
| B | 0 | 10 | 0 |
| C | 0 | 10 | 0 |
| D | 0 | 10 | 0 |
| Quadrant | Total seconds | Saturated seconds | Saturation percentage |
|---|---|---|---|
| A | 2702 | 46 | 1.702443% |
| B | 2702 | 86 | 3.182828% |
| C | 2701 | 62 | 2.295446% |
| D | 2701 | 495 | 18.326546% |
Noise dominated data is calculated using 1-second bins in cleaned event files. If a bin has >2000 counts, and if more than 50% of those come from <1% of pixels, then it is considered to be noise-dominated and hence unusable.
| Quadrant | # 1 sec bins | Bins with >0 counts | Bins with >2000 counts | High rate bins dominated by noise | Noise dominated (total time) | Noise dominated (detector-on time) | Marked lightcurve |
|---|---|---|---|---|---|---|---|
| A | 3732 | 2703 | 0 | 0 | 0.00% | 0.00% | 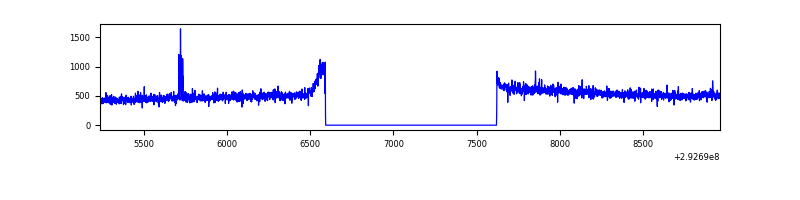 |
| B | 3732 | 2702 | 15 | 15 | 0.40% | 0.56% | 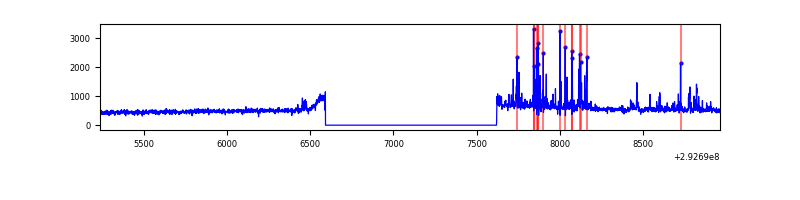 |
| C | 3731 | 2702 | 0 | 0 | 0.00% | 0.00% | 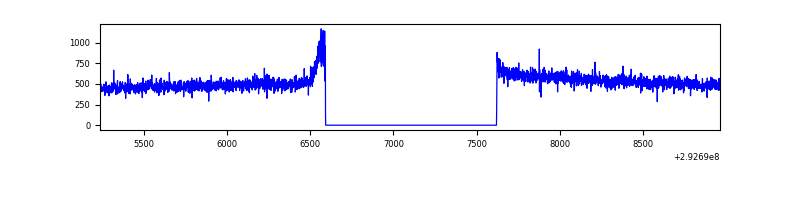 |
| D | 3731 | 2702 | 302 | 302 | 8.09% | 11.18% | 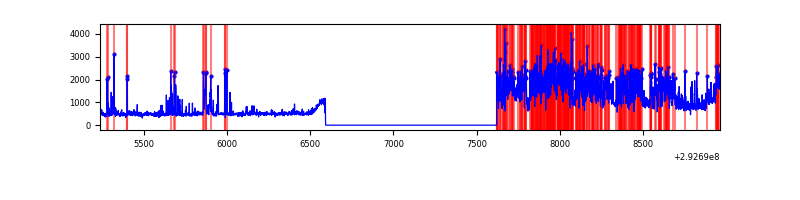 |
Top three noisy pixels from each quadrant. If the there are fewer than three noisy pixels in the level2.evt file, extra rows are filled as -1
| Pixel properties | Quadrant properties | ||||||
|---|---|---|---|---|---|---|---|
| Quadrant | DetID | PixID | Counts | Sigma | Mean | Median | Sigma |
| A | 9 | 143 | 14404 | 189.03 | 362 | 354 | 74.3 |
| A | 0 | 226 | 3228 | 38.67 | 362 | 354 | 74.3 |
| A | 13 | 254 | 2903 | 34.29 | 362 | 354 | 74.3 |
| B | 7 | 220 | 122177 | 1716.66 | 360 | 351 | 71.0 |
| B | 0 | 197 | 14622 | 201.09 | 360 | 351 | 71.0 |
| B | 12 | 111 | 7965 | 107.29 | 360 | 351 | 71.0 |
| C | 14 | 238 | 53310 | 644.25 | 346 | 349 | 82.2 |
| C | 3 | 233 | 4099 | 45.62 | 346 | 349 | 82.2 |
| C | 13 | 61 | 2435 | 25.38 | 346 | 349 | 82.2 |
| D | 7 | 238 | 1107837 | 13365.89 | 335 | 324 | 82.9 |
| D | 12 | 218 | 321954 | 3881.55 | 335 | 324 | 82.9 |
| D | 11 | 176 | 60704 | 728.69 | 335 | 324 | 82.9 |
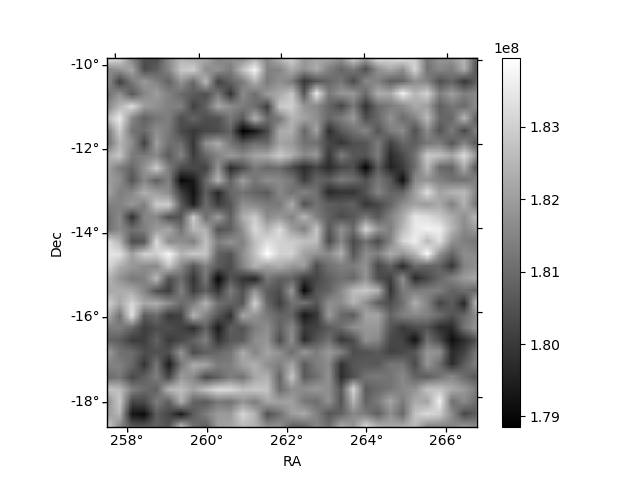
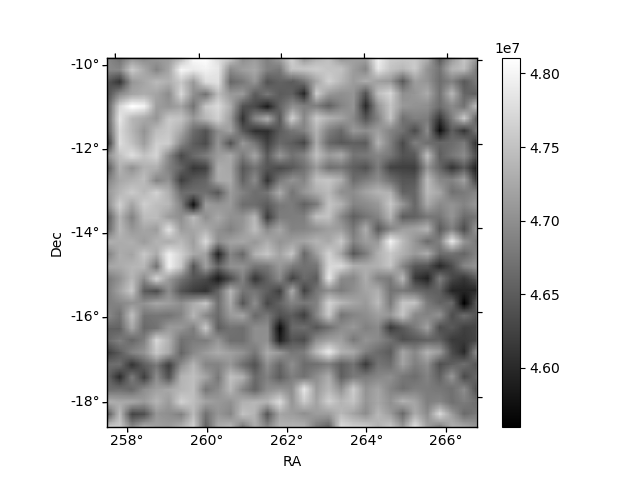
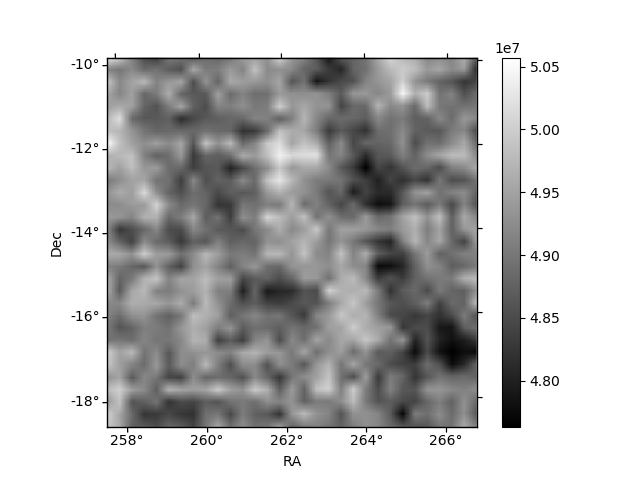
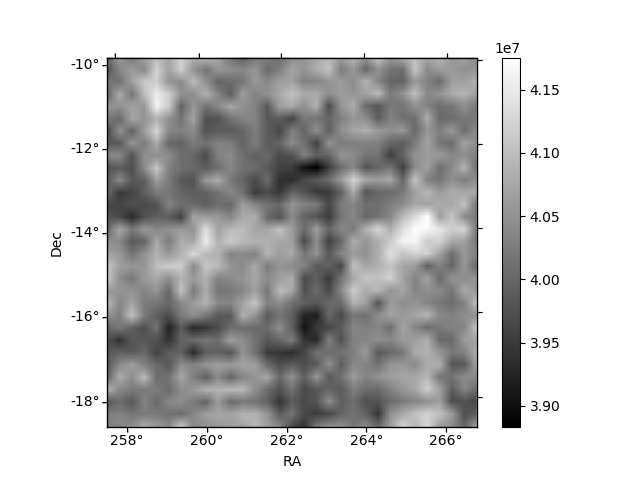
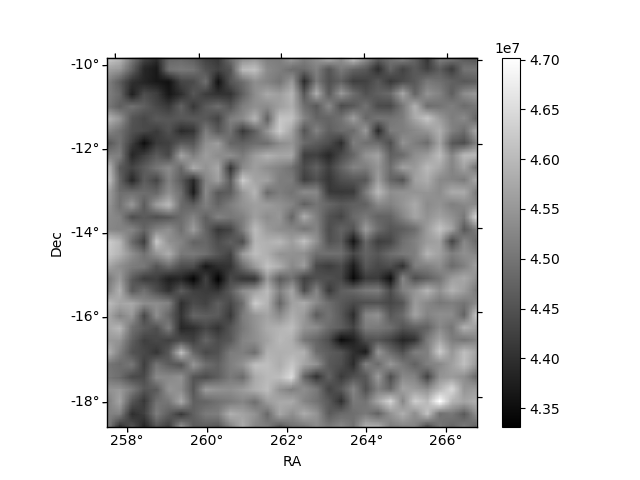
Histogram calculated using DETX and DETY for each event in the final _common_clean file
| Quadrant A | 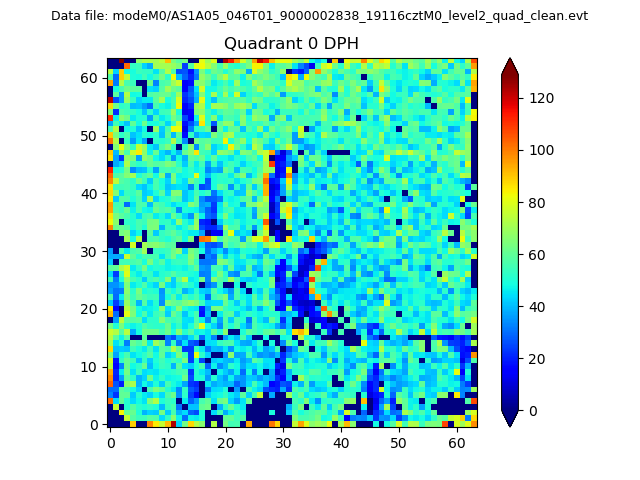 |
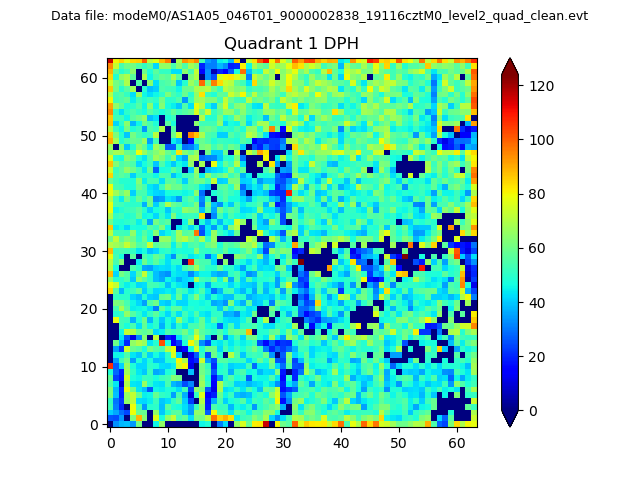 |
Quadrant B |
|---|---|---|---|
| Quadrant D |  |
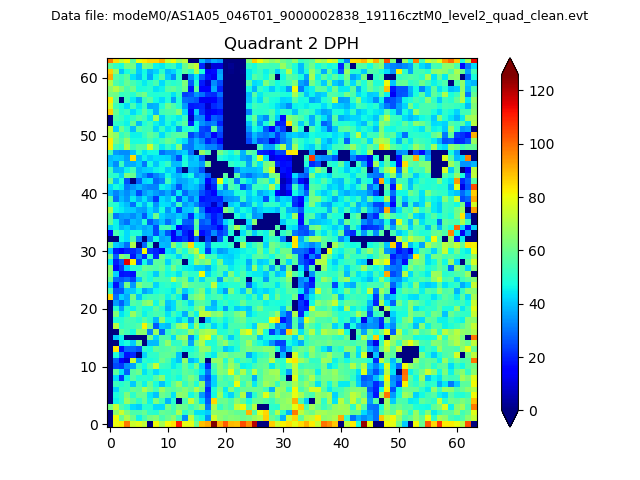 |
Quadrant C |
| Plot type | Count rate plots | Images |
|---|---|---|
| Comparison with Poisson distribution Blue bars denote a histogram of data divided into 1 sec bins. Red curve is a Poisson curve with rate = median count rate of data. |
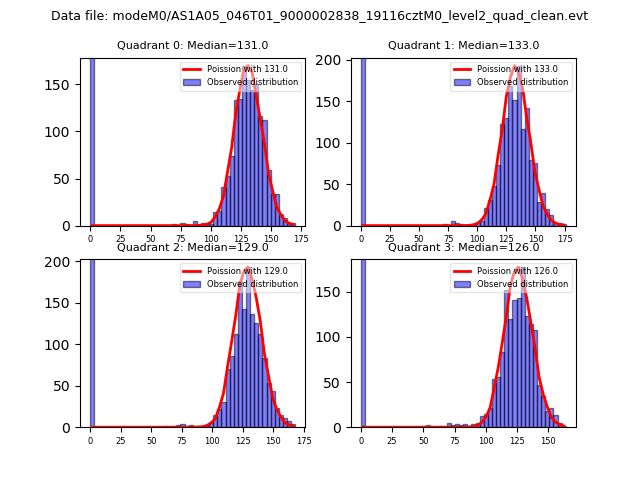 |
 |
| Quadrant-wise count rates Data is divided into 100 sec bins |
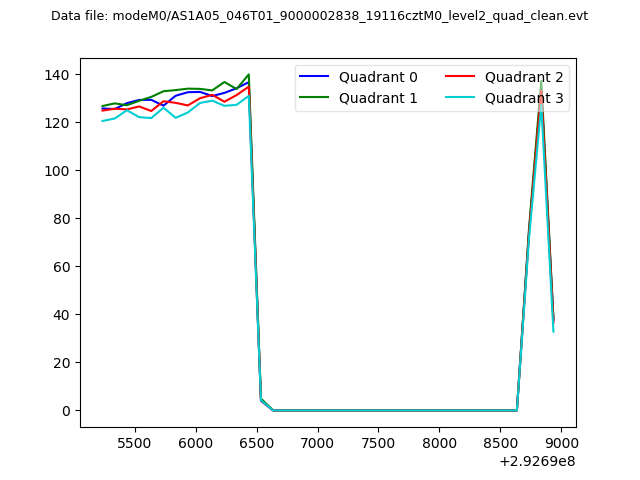 |
|
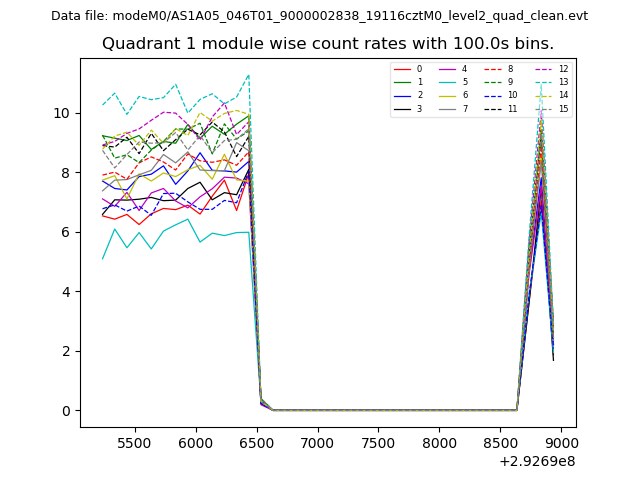
| Module-wise count rates for Quadrant A Data is divided into 100 sec bins |
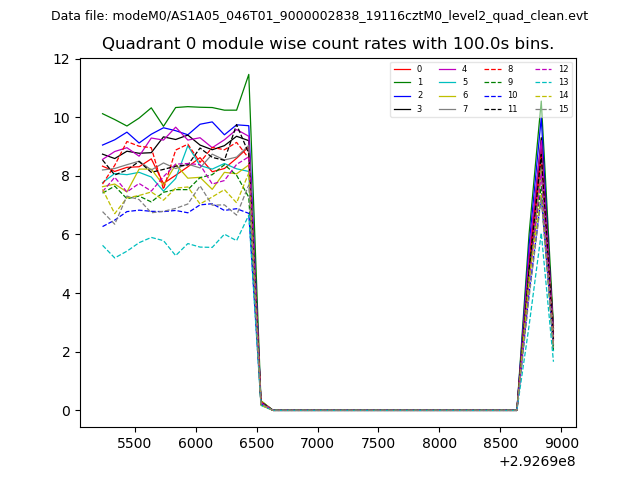 |
 |
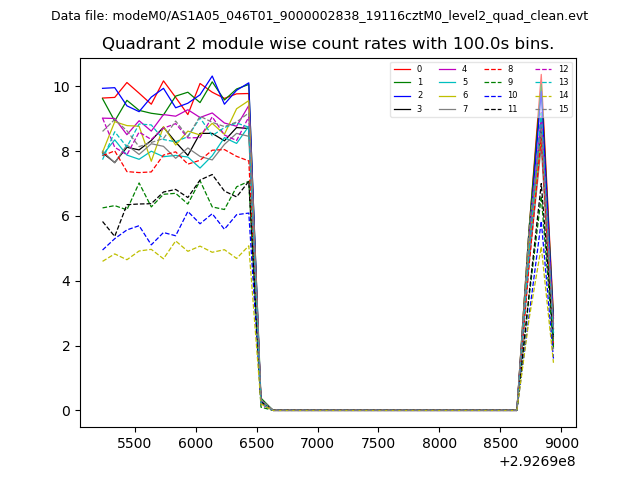
| Module-wise count rates for Quadrant B Data is divided into 100 sec bins |
 |
 |
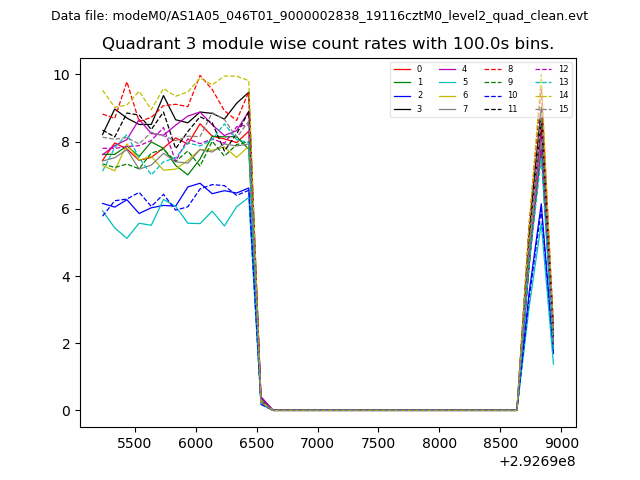
| Module-wise count rates for Quadrant C Data is divided into 100 sec bins |
 |
 |
| Module-wise count rates for Quadrant D Data is divided into 100 sec bins |
 |
 |
| Parameter | Plot |
|---|---|
| CZT HV Monitor | 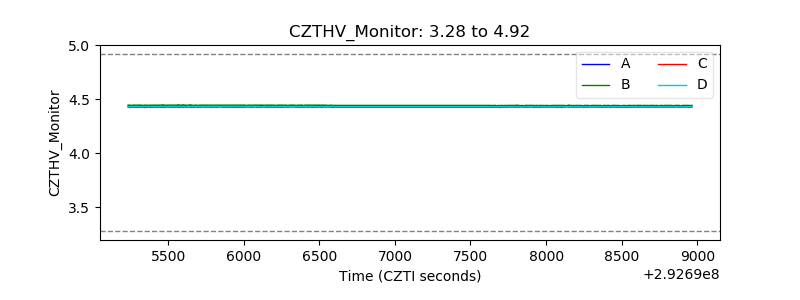 |
| D_VDD | 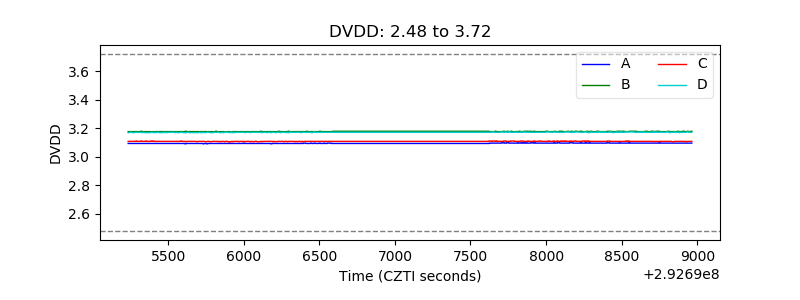 |
| Temperature 1 | 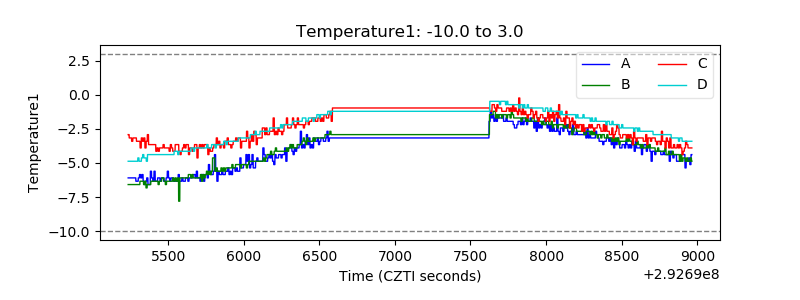 |
| Veto HV Monitor |  |
| Veto LLD | 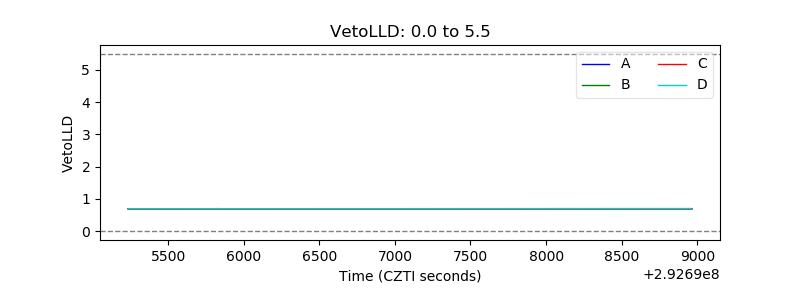 |
| Alpha Counter | 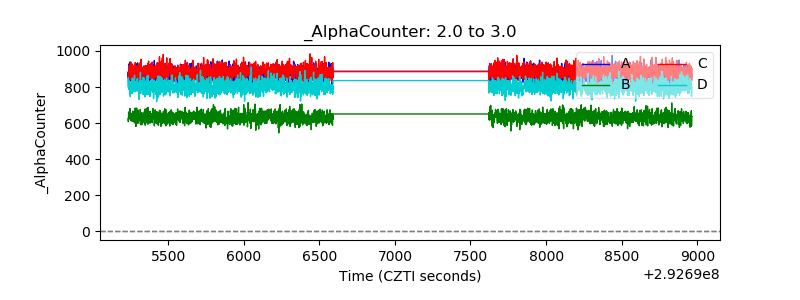 |
| _CPM_Rate |  |
| CZT Counter | 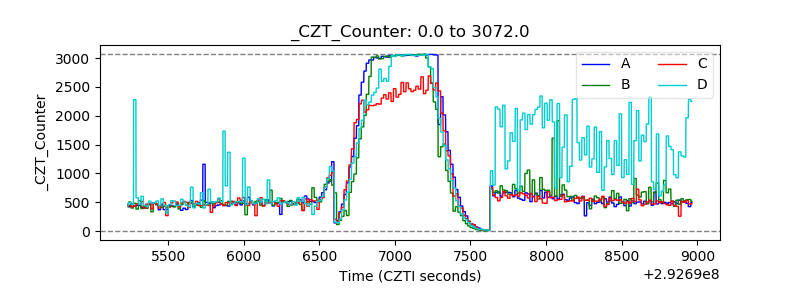 |
| +2.5 Volts monitor | 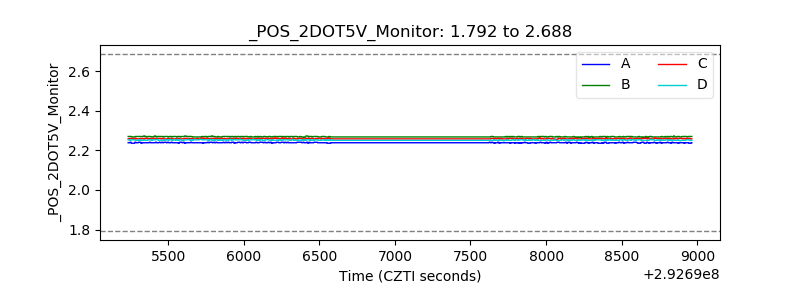 |
| +5 Volts monitor | 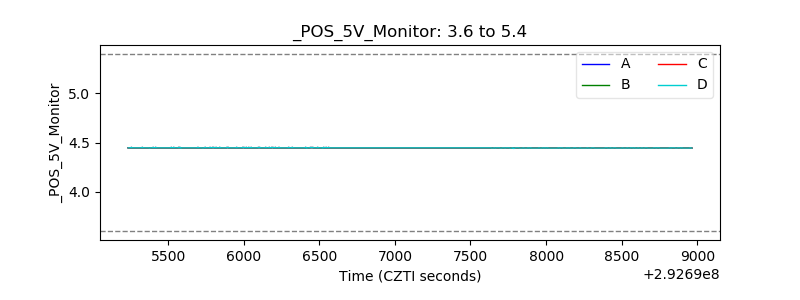 |
| _ROLL_ROT | 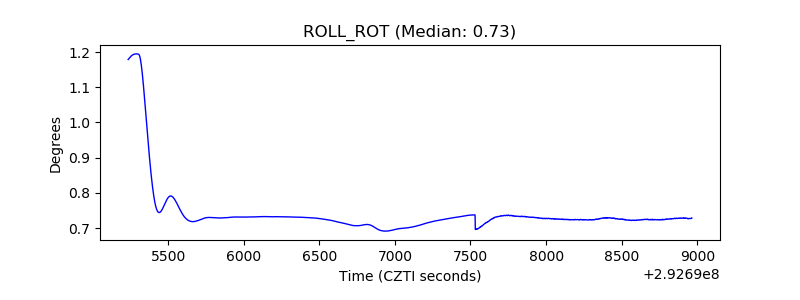 |
| _Roll_DEC | 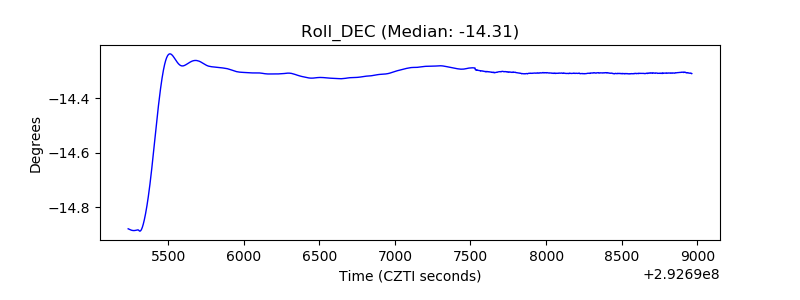 |
| _Roll_RA | 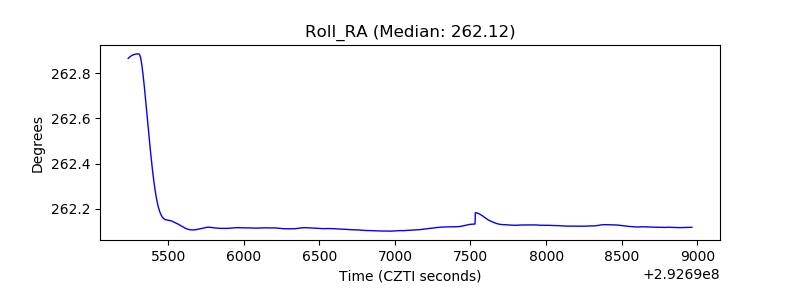 |
| Veto Counter | 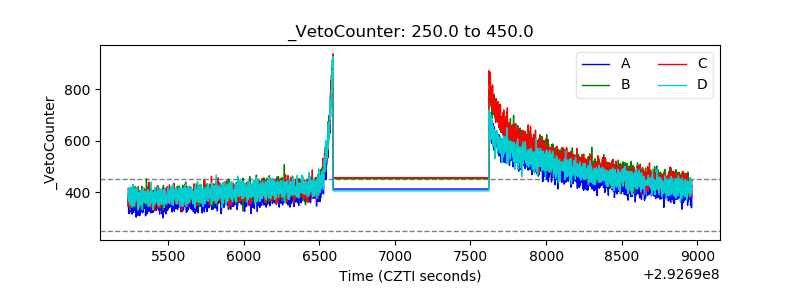 |