| Param | Original file | Final file |
|---|---|---|
| Filename | modeM0/AS1A05_046T01_9000002838_19119cztM0_level2.evt | modeM0/AS1A05_046T01_9000002838_19119cztM0_level2_quad_clean.evt |
| Size (bytes) | 513,509,760 | 95,808,960 |
| Size | 489.7 MB | 91.4 MB |
| Events in quadrant A | 3,094,187 | 626,745 |
| Events in quadrant B | 3,311,652 | 645,231 |
| Events in quadrant C | 3,168,288 | 623,192 |
| Events in quadrant D | 5,562,448 | 578,794 |
| Mode M0 | |||
|---|---|---|---|
| Quadrant | BADHDUFLAG | Total packets | Discarded packets |
| A | 0 | 13085 | 1 |
| B | 0 | 13860 | 2 |
| C | 0 | 13185 | 1 |
| D | 0 | 20826 | 1 |
| Mode SS | |||
|---|---|---|---|
| Quadrant | BADHDUFLAG | Total packets | Discarded packets |
| A | 0 | 124 | 0 |
| B | 0 | 124 | 0 |
| C | 0 | 124 | 0 |
| D | 0 | 124 | 0 |
| Mode M9 | |||
|---|---|---|---|
| Quadrant | BADHDUFLAG | Total packets | Discarded packets |
| A | 0 | 13 | 0 |
| B | 0 | 13 | 0 |
| C | 0 | 13 | 0 |
| D | 0 | 13 | 0 |
| Quadrant | Total seconds | Saturated seconds | Saturation percentage |
|---|---|---|---|
| A | 6124 | 35 | 0.571522% |
| B | 6124 | 53 | 0.865447% |
| C | 6124 | 61 | 0.996081% |
| D | 6124 | 427 | 6.972567% |
Noise dominated data is calculated using 1-second bins in cleaned event files. If a bin has >2000 counts, and if more than 50% of those come from <1% of pixels, then it is considered to be noise-dominated and hence unusable.
| Quadrant | # 1 sec bins | Bins with >0 counts | Bins with >2000 counts | High rate bins dominated by noise | Noise dominated (total time) | Noise dominated (detector-on time) | Marked lightcurve |
|---|---|---|---|---|---|---|---|
| A | 7389 | 6125 | 2 | 2 | 0.03% | 0.03% | 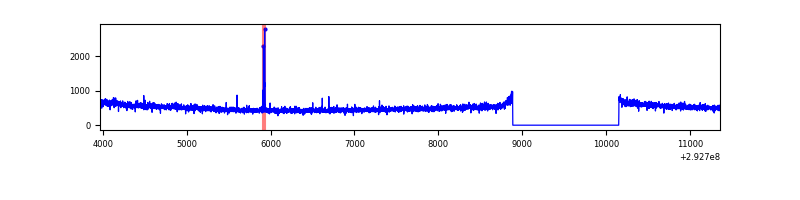 |
| B | 7389 | 6125 | 3 | 3 | 0.04% | 0.05% | 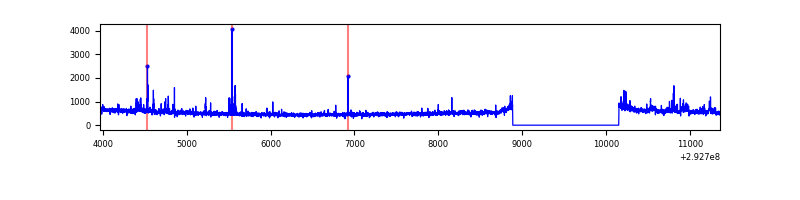 |
| C | 7389 | 6125 | 0 | 0 | 0.00% | 0.00% | 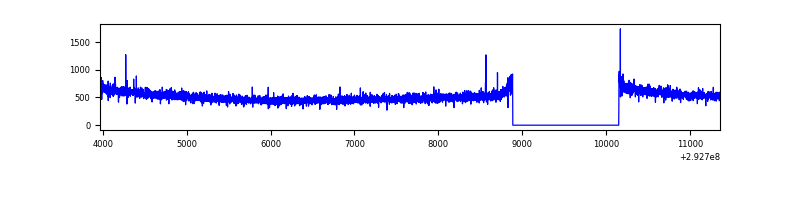 |
| D | 7389 | 6124 | 330 | 330 | 4.47% | 5.39% | 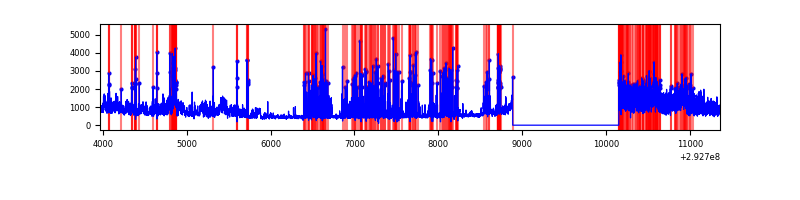 |
Top three noisy pixels from each quadrant. If the there are fewer than three noisy pixels in the level2.evt file, extra rows are filled as -1
| Pixel properties | Quadrant properties | ||||||
|---|---|---|---|---|---|---|---|
| Quadrant | DetID | PixID | Counts | Sigma | Mean | Median | Sigma |
| A | 4 | 2 | 16408 | 97.26 | 797 | 784 | 160.6 |
| A | 11 | 29 | 7659 | 42.8 | 797 | 784 | 160.6 |
| A | 0 | 226 | 6970 | 38.51 | 797 | 784 | 160.6 |
| B | 3 | 112 | 47235 | 307.38 | 805 | 787 | 151.1 |
| B | 10 | 245 | 39016 | 252.98 | 805 | 787 | 151.1 |
| B | 0 | 197 | 33602 | 217.16 | 805 | 787 | 151.1 |
| C | 14 | 238 | 120741 | 663.8 | 776 | 784 | 180.7 |
| C | 3 | 233 | 16295 | 85.83 | 776 | 784 | 180.7 |
| C | 0 | 207 | 6455 | 31.38 | 776 | 784 | 180.7 |
| D | 7 | 238 | 2176036 | 11782.58 | 759 | 739 | 184.6 |
| D | 12 | 218 | 265397 | 1433.53 | 759 | 739 | 184.6 |
| D | 11 | 176 | 167161 | 901.43 | 759 | 739 | 184.6 |
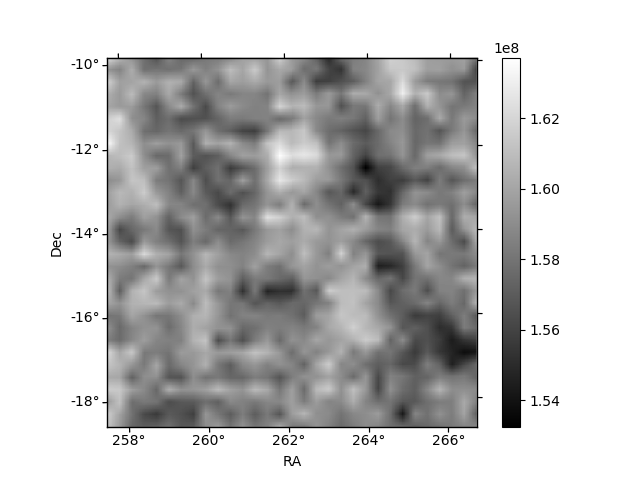
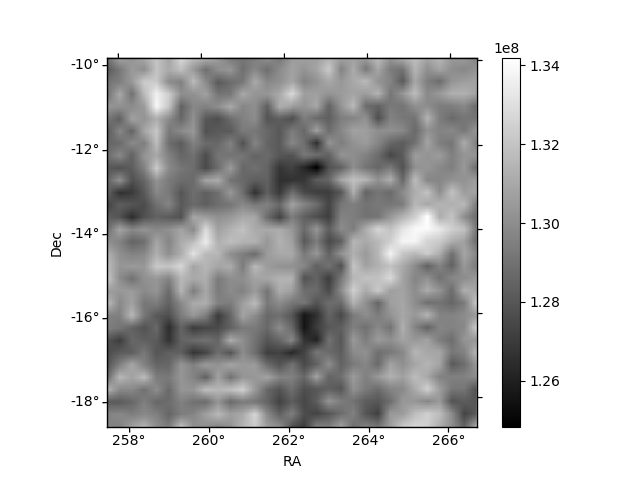
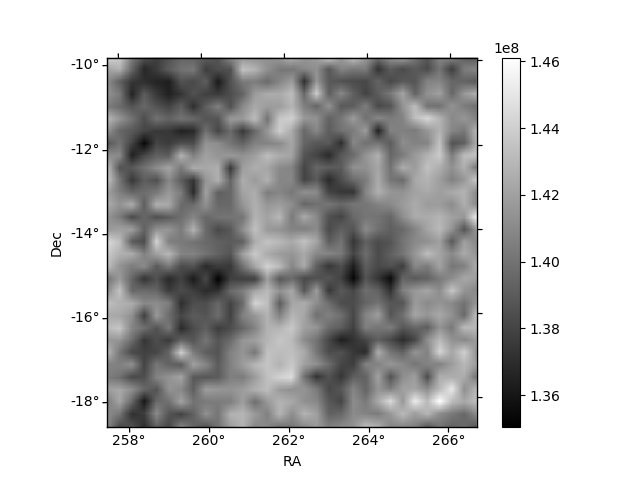
Histogram calculated using DETX and DETY for each event in the final _common_clean file
| Quadrant A | 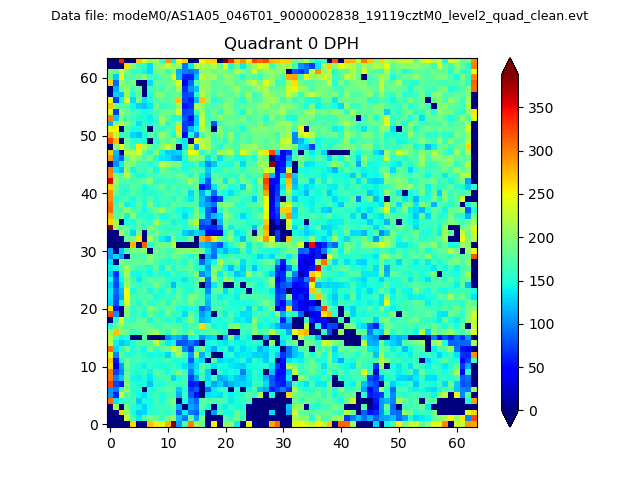 |
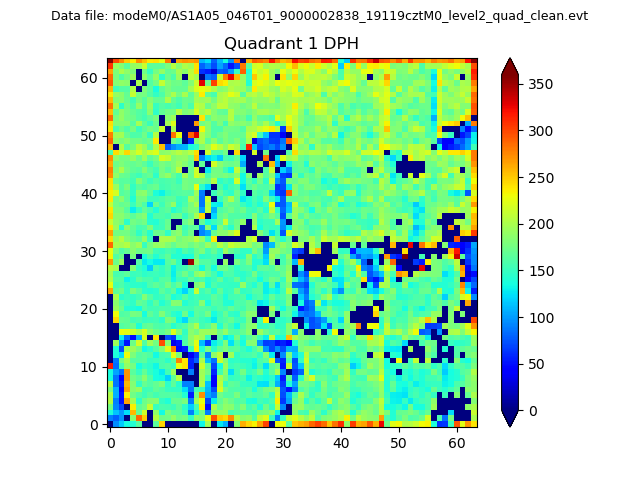 |
Quadrant B |
|---|---|---|---|
| Quadrant D | 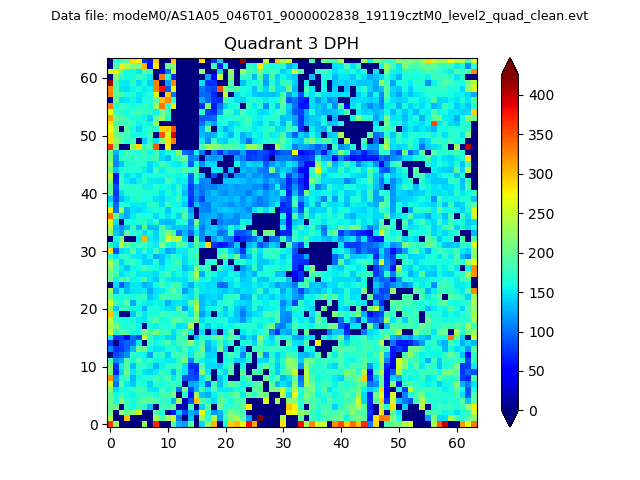 |
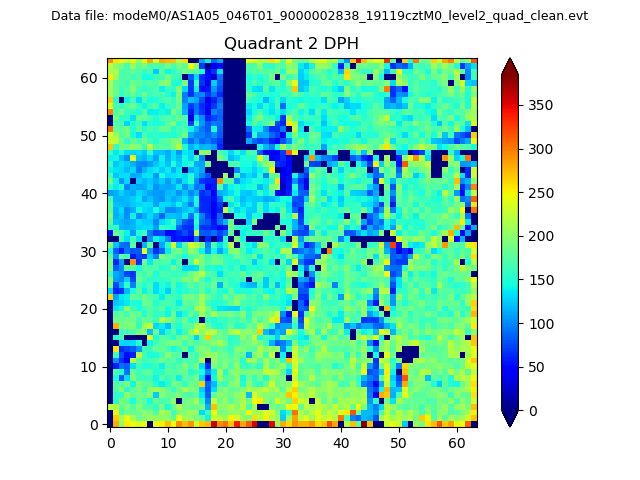 |
Quadrant C |
| Plot type | Count rate plots | Images |
|---|---|---|
| Comparison with Poisson distribution Blue bars denote a histogram of data divided into 1 sec bins. Red curve is a Poisson curve with rate = median count rate of data. |
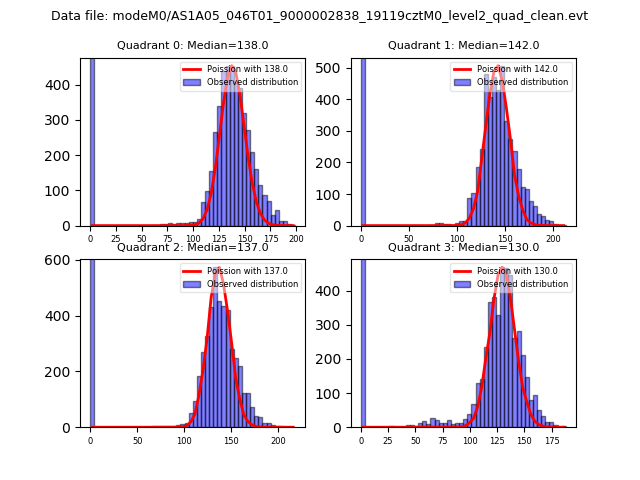 |
 |
| Quadrant-wise count rates Data is divided into 100 sec bins |
 |
|
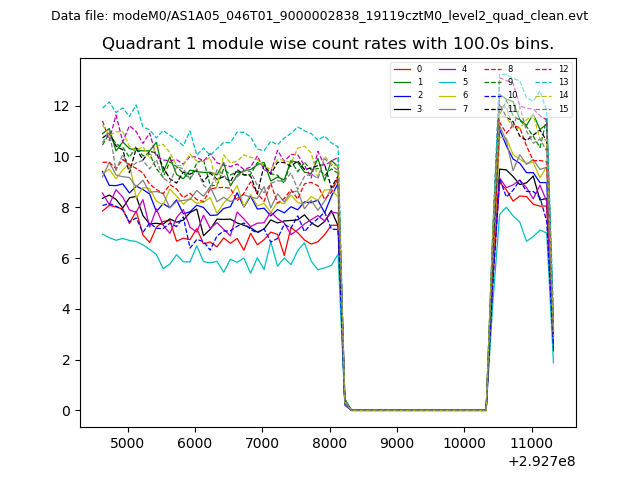
| Module-wise count rates for Quadrant A Data is divided into 100 sec bins |
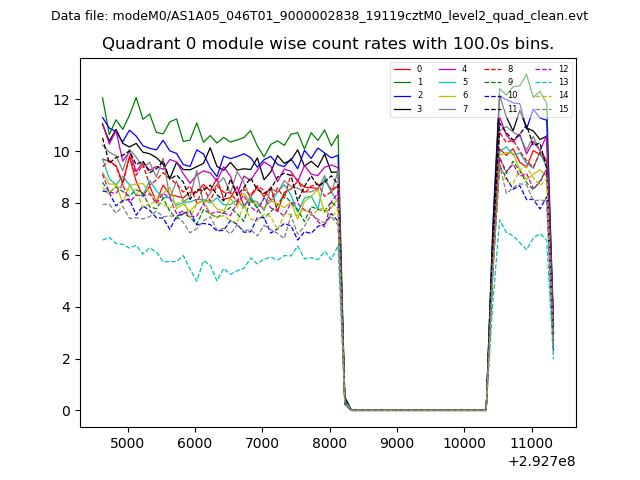 |
 |
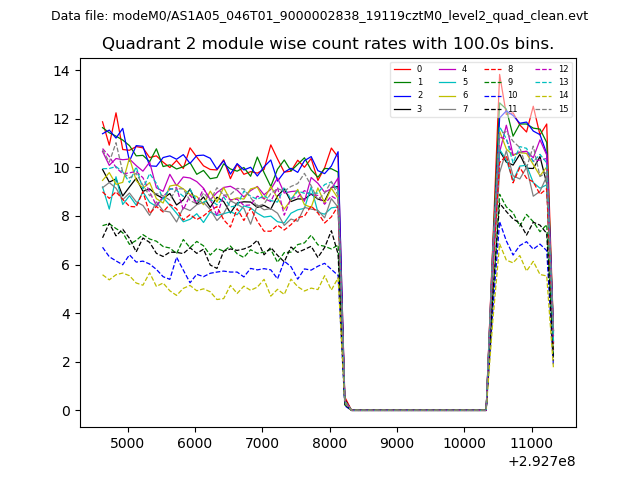
| Module-wise count rates for Quadrant B Data is divided into 100 sec bins |
 |
 |
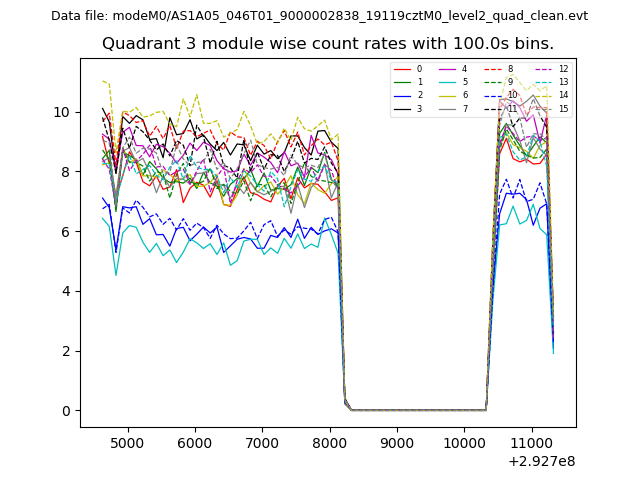
| Module-wise count rates for Quadrant C Data is divided into 100 sec bins |
 |
 |
| Module-wise count rates for Quadrant D Data is divided into 100 sec bins |
 |
 |
| Parameter | Plot |
|---|---|
| CZT HV Monitor | 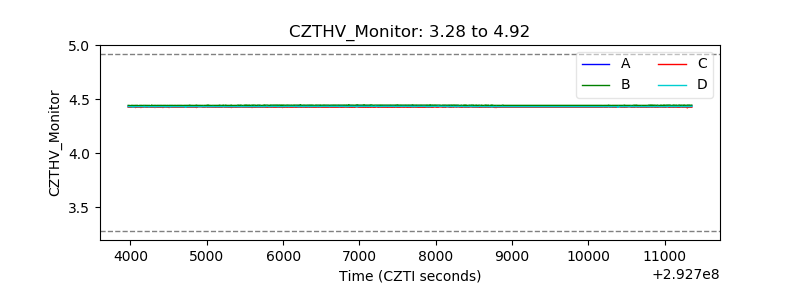 |
| D_VDD | 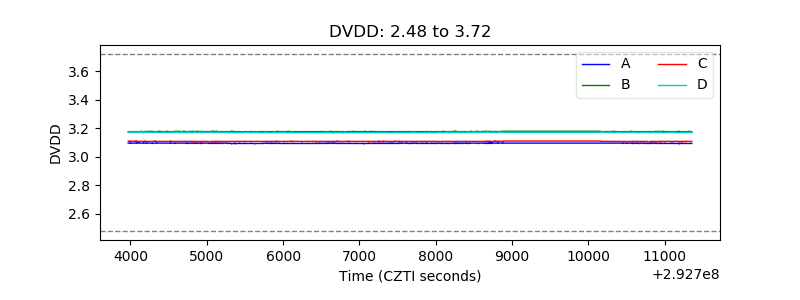 |
| Temperature 1 | 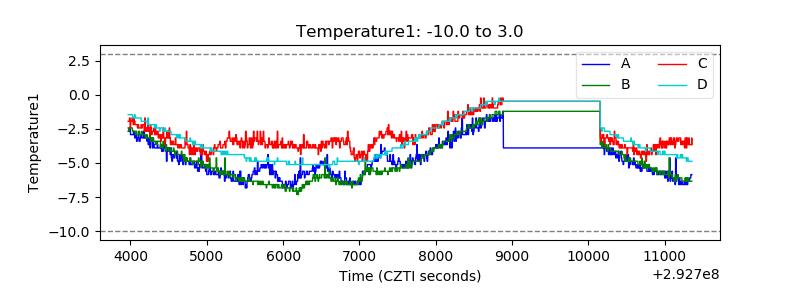 |
| Veto HV Monitor | 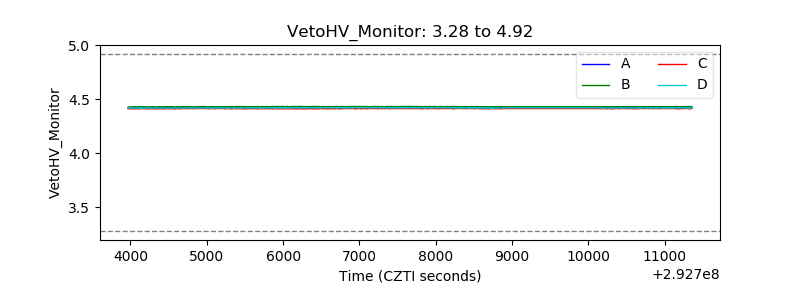 |
| Veto LLD | 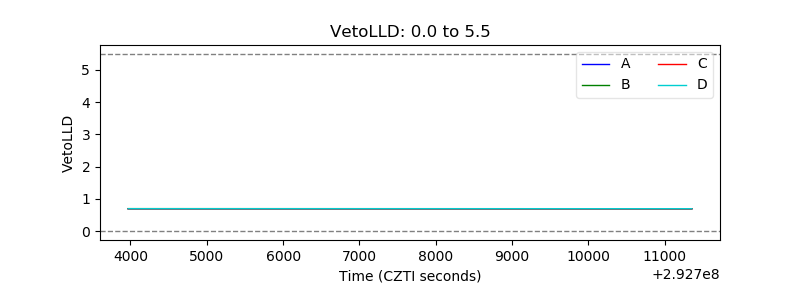 |
| Alpha Counter | 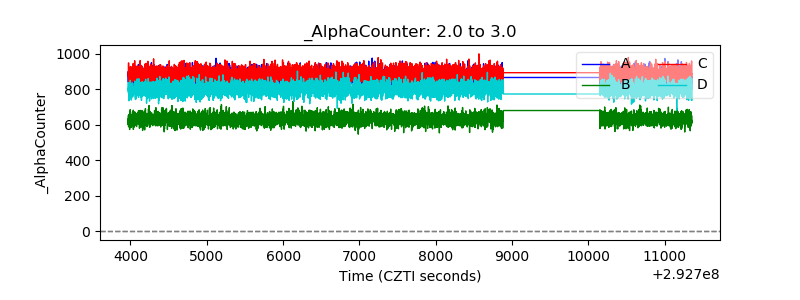 |
| _CPM_Rate |  |
| CZT Counter | 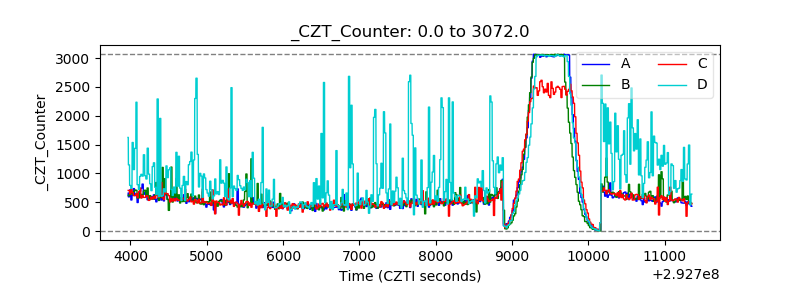 |
| +2.5 Volts monitor |  |
| +5 Volts monitor |  |
| _ROLL_ROT | 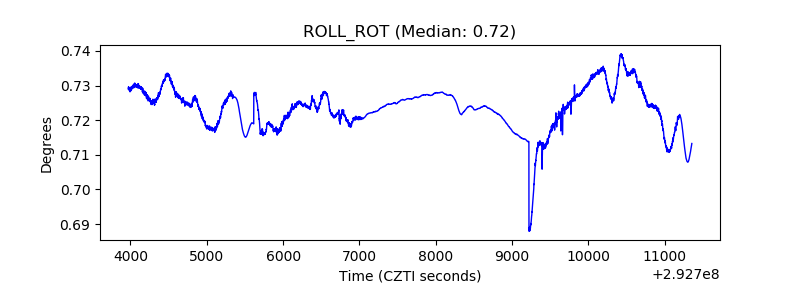 |
| _Roll_DEC | 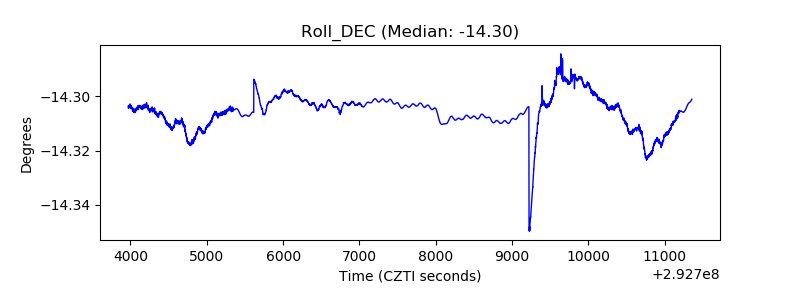 |
| _Roll_RA | 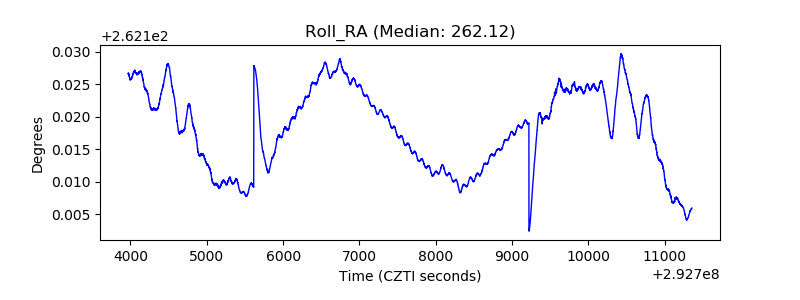 |
| Veto Counter | 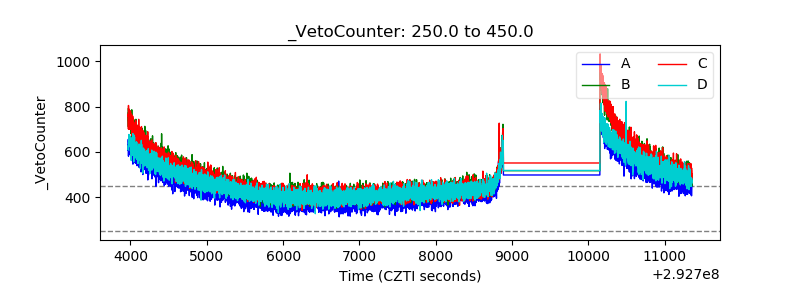 |