| Param | Original file | Final file |
|---|---|---|
| Filename | modeM0/AS1A05_046T01_9000002838_19120cztM0_level2.evt | modeM0/AS1A05_046T01_9000002838_19120cztM0_level2_quad_clean.evt |
| Size (bytes) | 546,217,920 | 108,385,920 |
| Size | 520.9 MB | 103.4 MB |
| Events in quadrant A | 3,297,669 | 712,324 |
| Events in quadrant B | 3,665,891 | 742,060 |
| Events in quadrant C | 3,423,844 | 710,887 |
| Events in quadrant D | 5,716,878 | 666,409 |
| Mode M0 | |||
|---|---|---|---|
| Quadrant | BADHDUFLAG | Total packets | Discarded packets |
| A | 0 | 13842 | 2 |
| B | 0 | 14970 | 2 |
| C | 0 | 14089 | 2 |
| D | 0 | 21283 | 2 |
| Mode SS | |||
|---|---|---|---|
| Quadrant | BADHDUFLAG | Total packets | Discarded packets |
| A | 0 | 132 | 0 |
| B | 0 | 132 | 0 |
| C | 0 | 132 | 0 |
| D | 0 | 132 | 0 |
| Mode M9 | |||
|---|---|---|---|
| Quadrant | BADHDUFLAG | Total packets | Discarded packets |
| A | 0 | 26 | 0 |
| B | 0 | 26 | 0 |
| C | 0 | 26 | 0 |
| D | 0 | 26 | 0 |
| Quadrant | Total seconds | Saturated seconds | Saturation percentage |
|---|---|---|---|
| A | 6469 | 48 | 0.742000% |
| B | 6469 | 114 | 1.762251% |
| C | 6469 | 101 | 1.561292% |
| D | 6469 | 486 | 7.512753% |
Noise dominated data is calculated using 1-second bins in cleaned event files. If a bin has >2000 counts, and if more than 50% of those come from <1% of pixels, then it is considered to be noise-dominated and hence unusable.
| Quadrant | # 1 sec bins | Bins with >0 counts | Bins with >2000 counts | High rate bins dominated by noise | Noise dominated (total time) | Noise dominated (detector-on time) | Marked lightcurve |
|---|---|---|---|---|---|---|---|
| A | 9044 | 6471 | 0 | 0 | 0.00% | 0.00% | 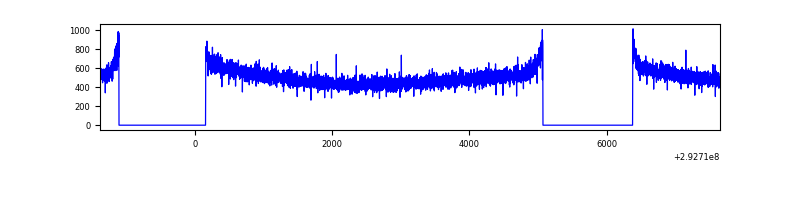 |
| B | 9044 | 6471 | 9 | 9 | 0.10% | 0.14% | 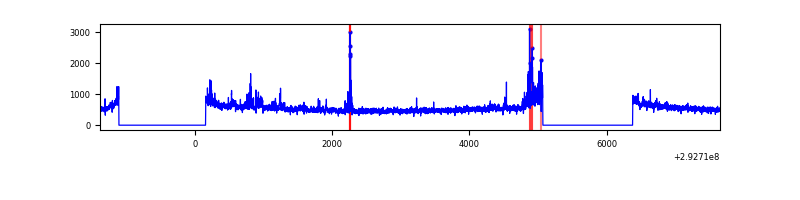 |
| C | 9044 | 6471 | 4 | 4 | 0.04% | 0.06% | 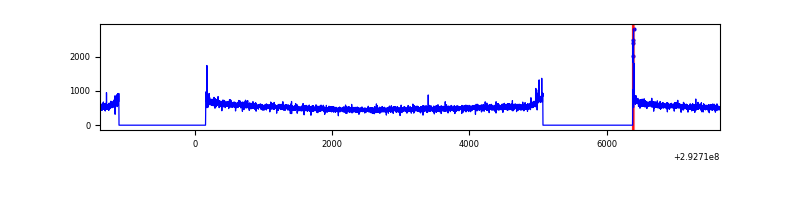 |
| D | 9044 | 6470 | 341 | 341 | 3.77% | 5.27% | 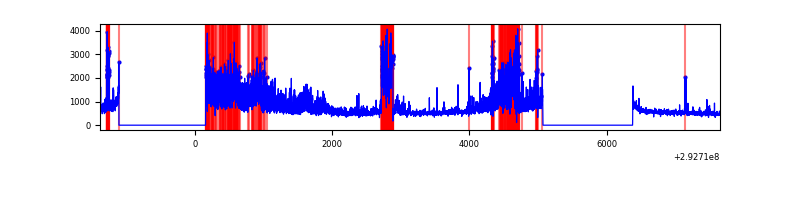 |
Top three noisy pixels from each quadrant. If the there are fewer than three noisy pixels in the level2.evt file, extra rows are filled as -1
| Pixel properties | Quadrant properties | ||||||
|---|---|---|---|---|---|---|---|
| Quadrant | DetID | PixID | Counts | Sigma | Mean | Median | Sigma |
| A | 0 | 226 | 7478 | 38.66 | 856 | 840 | 171.7 |
| A | 13 | 254 | 6348 | 32.07 | 856 | 840 | 171.7 |
| A | 3 | 137 | 6267 | 31.6 | 856 | 840 | 171.7 |
| B | 10 | 245 | 175226 | 1078.68 | 865 | 846 | 161.7 |
| B | 7 | 220 | 56357 | 343.38 | 865 | 846 | 161.7 |
| B | 12 | 111 | 18659 | 110.19 | 865 | 846 | 161.7 |
| C | 14 | 238 | 130663 | 666.97 | 836 | 842 | 194.6 |
| C | 9 | 54 | 25230 | 125.3 | 836 | 842 | 194.6 |
| C | 3 | 233 | 6356 | 28.33 | 836 | 842 | 194.6 |
| D | 7 | 238 | 1903843 | 9565.79 | 817 | 796 | 198.9 |
| D | 12 | 218 | 514682 | 2583.08 | 817 | 796 | 198.9 |
| D | 11 | 176 | 102186 | 509.64 | 817 | 796 | 198.9 |
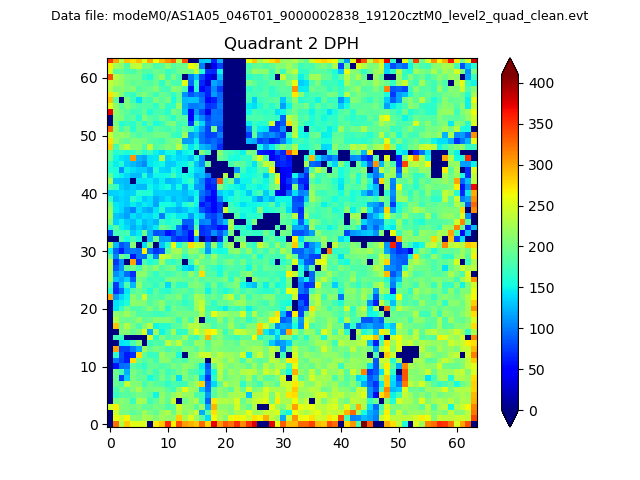
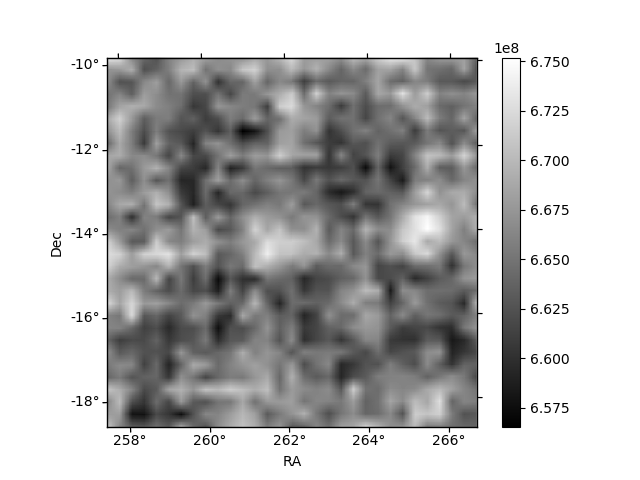
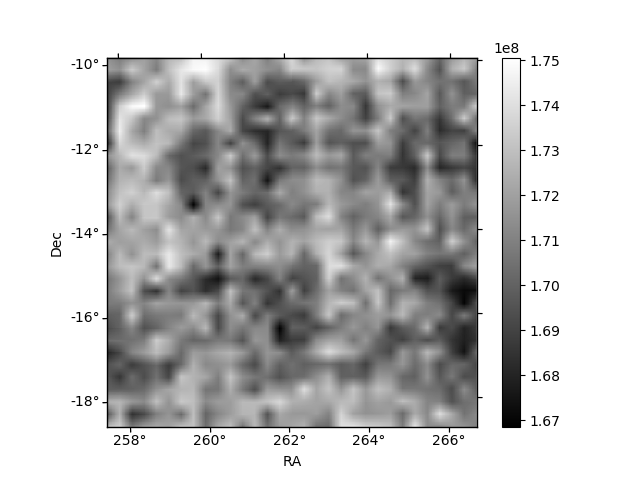
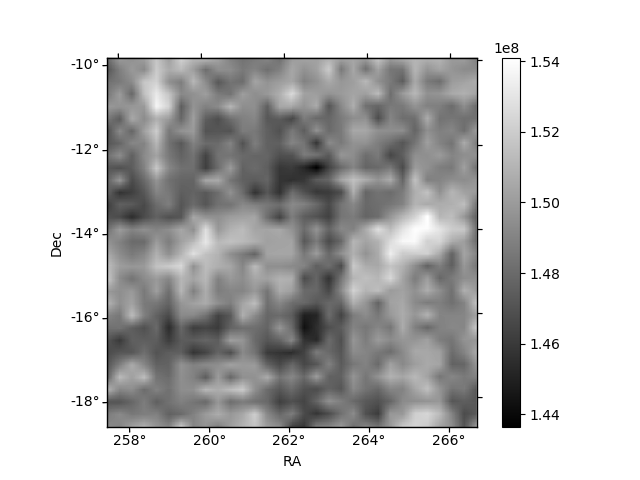
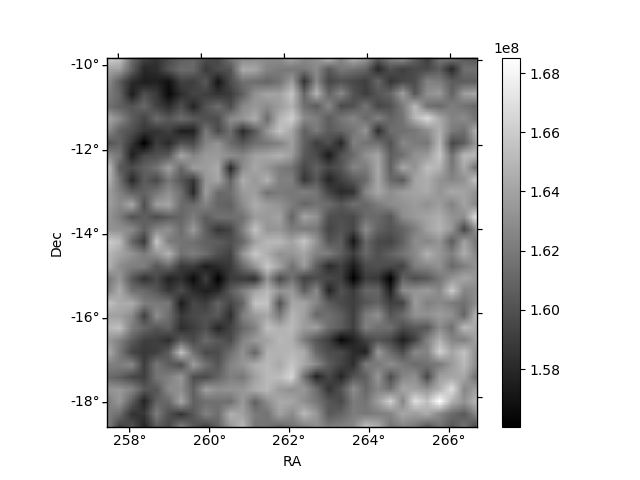
Histogram calculated using DETX and DETY for each event in the final _common_clean file
| Quadrant A | 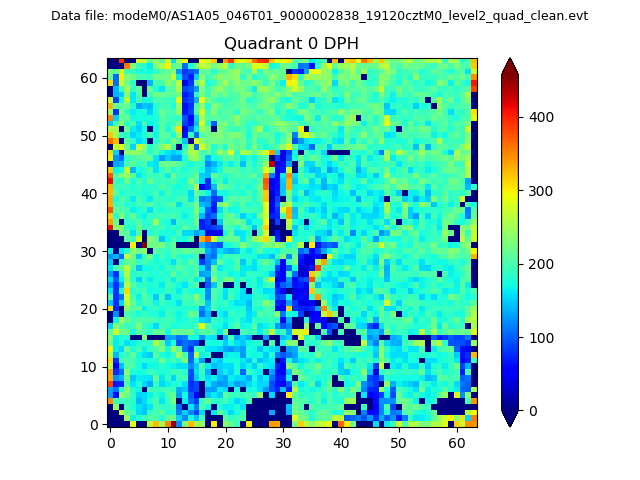 |
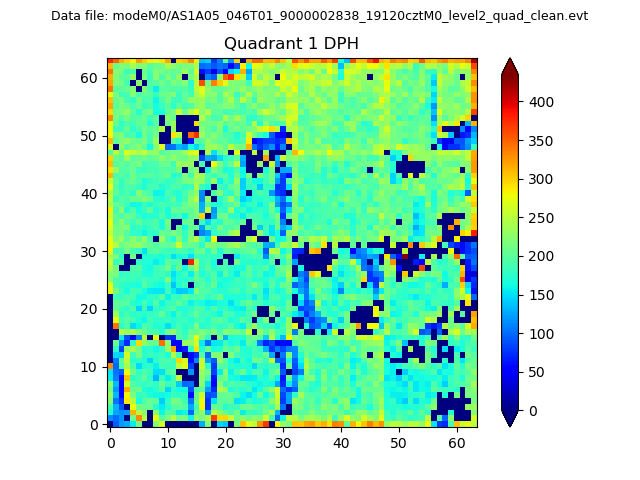 |
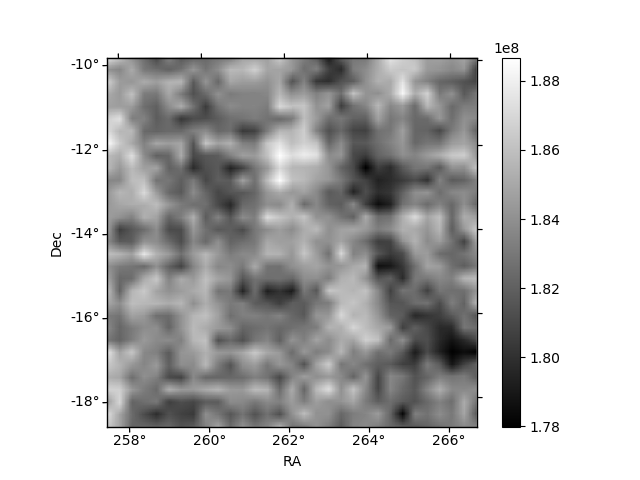
Quadrant B |
|---|---|---|---|
| Quadrant D | 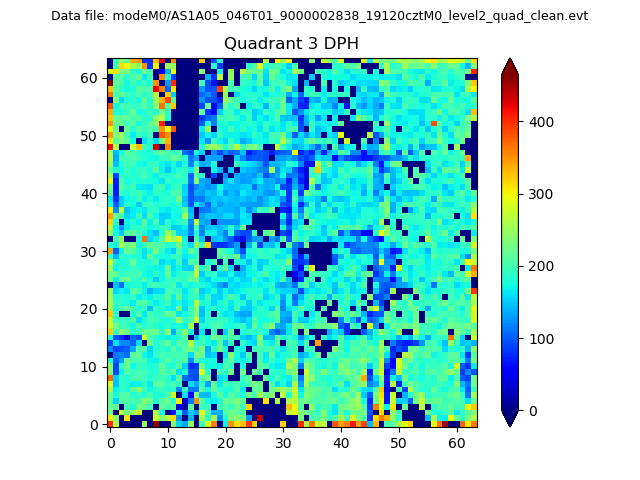 |
 |
Quadrant C |
| Plot type | Count rate plots | Images |
|---|---|---|
| Comparison with Poisson distribution Blue bars denote a histogram of data divided into 1 sec bins. Red curve is a Poisson curve with rate = median count rate of data. |
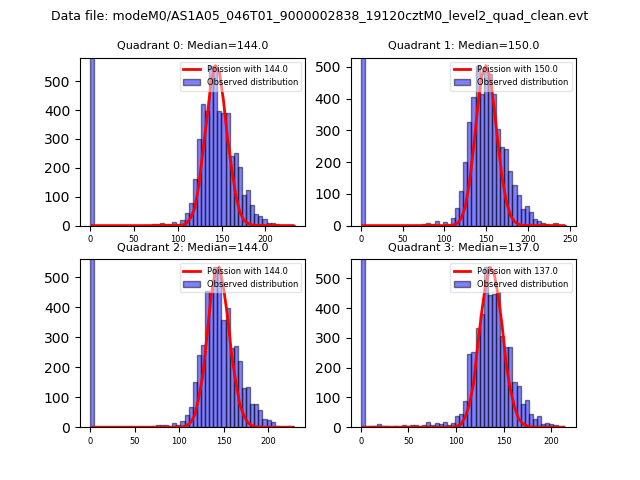 |
 |
| Quadrant-wise count rates Data is divided into 100 sec bins |
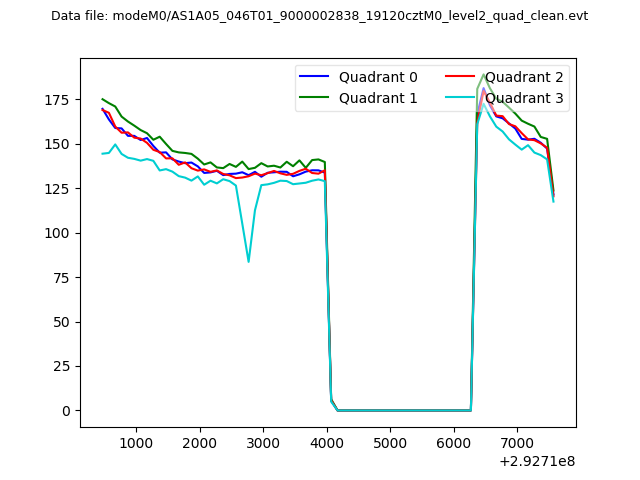 |
|
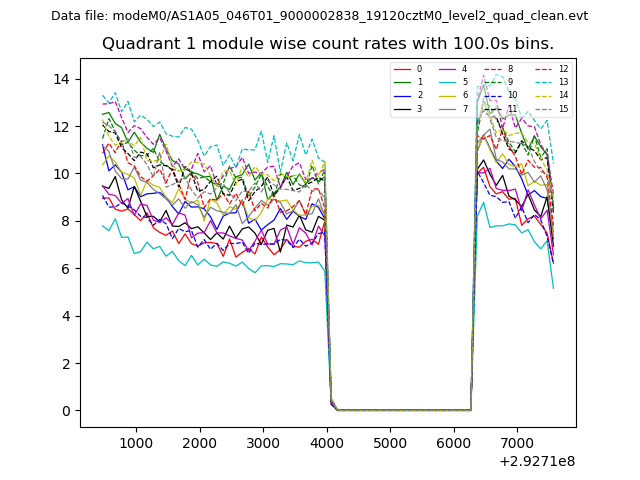
| Module-wise count rates for Quadrant A Data is divided into 100 sec bins |
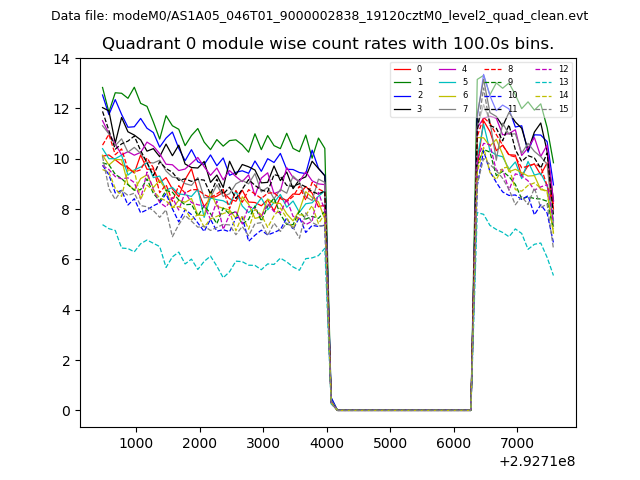 |
 |
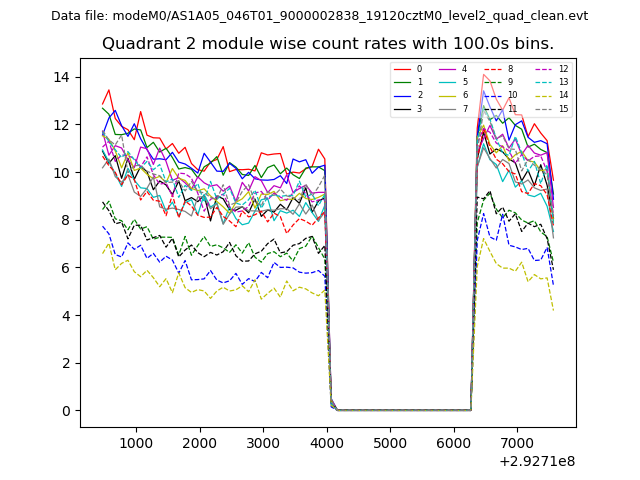
| Module-wise count rates for Quadrant B Data is divided into 100 sec bins |
 |
 |
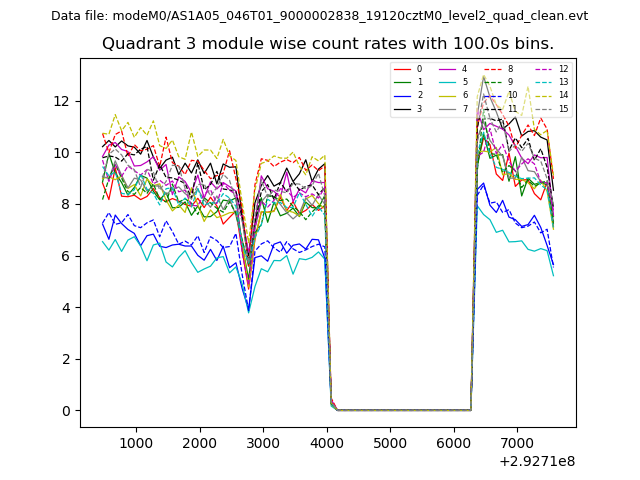
| Module-wise count rates for Quadrant C Data is divided into 100 sec bins |
 |
 |
| Module-wise count rates for Quadrant D Data is divided into 100 sec bins |
 |
 |
| Parameter | Plot |
|---|---|
| CZT HV Monitor | 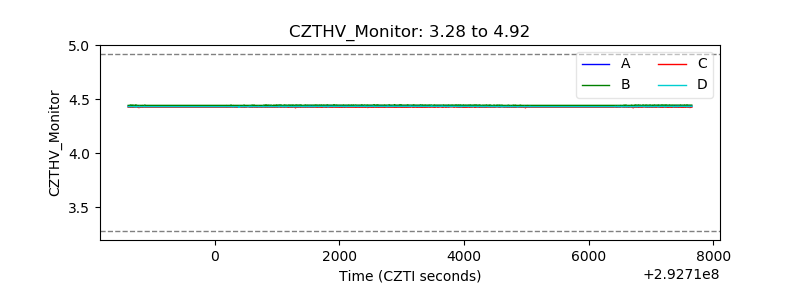 |
| D_VDD | 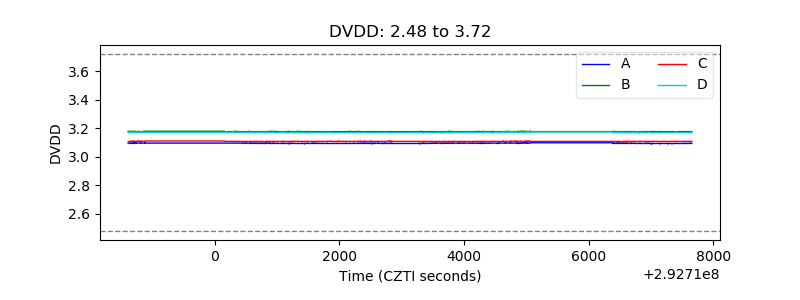 |
| Temperature 1 | 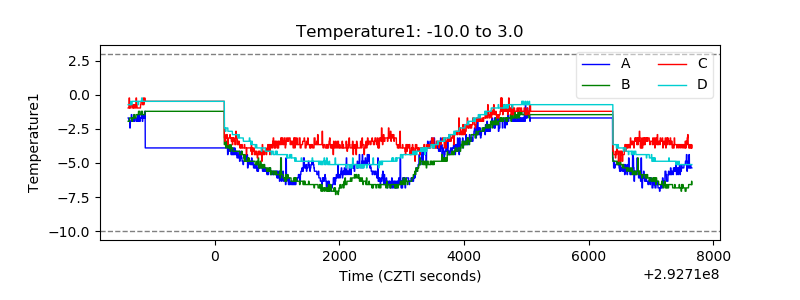 |
| Veto HV Monitor | 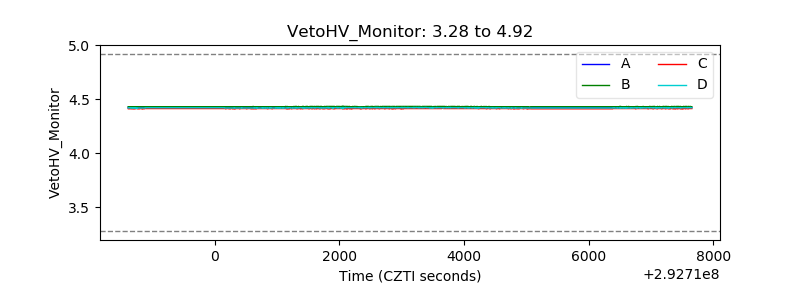 |
| Veto LLD | 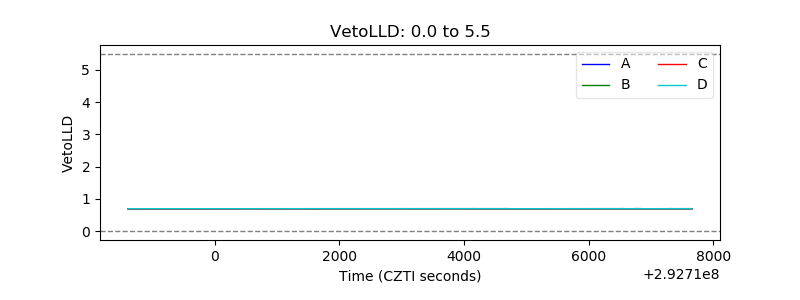 |
| Alpha Counter | 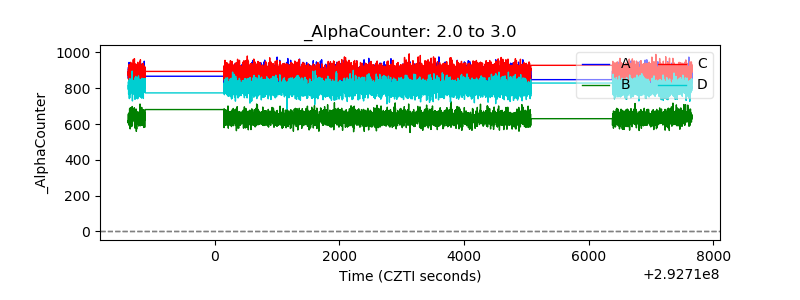 |
| _CPM_Rate | 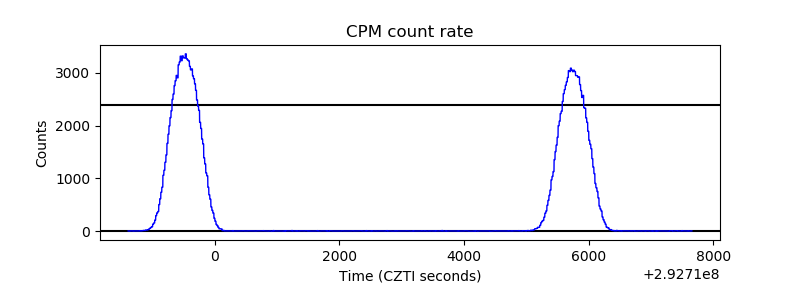 |
| CZT Counter |  |
| +2.5 Volts monitor |  |
| +5 Volts monitor |  |
| _ROLL_ROT | 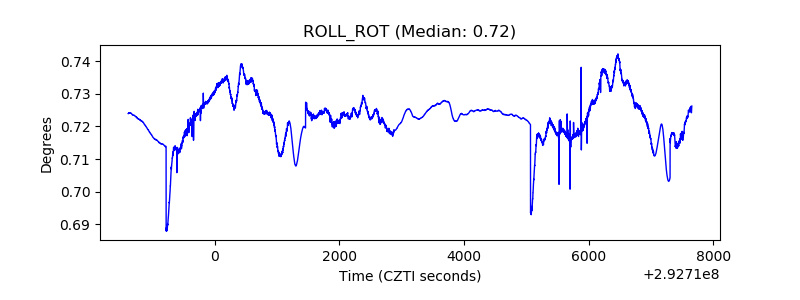 |
| _Roll_DEC | 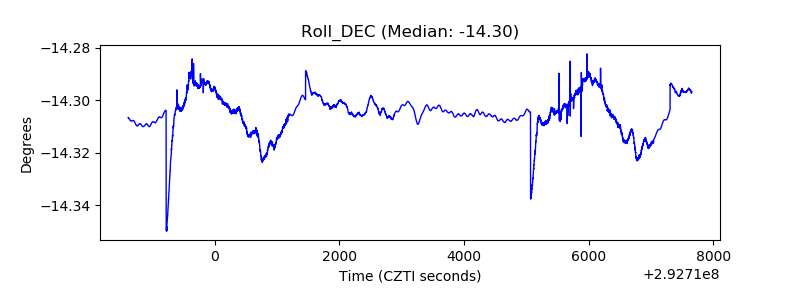 |
| _Roll_RA | 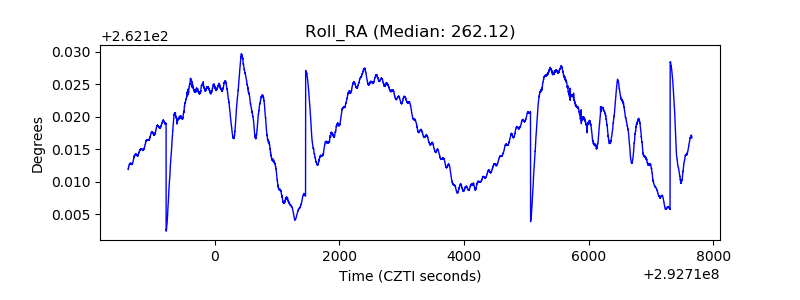 |
| Veto Counter | 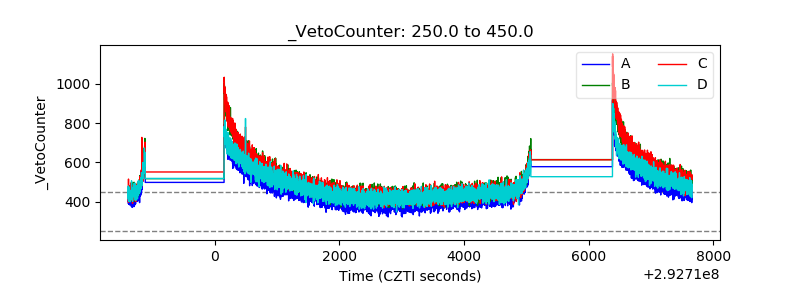 |