| Param | Original file | Final file |
|---|---|---|
| Filename | modeM0/AS1A05_046T01_9000002838_19121cztM0_level2.evt | modeM0/AS1A05_046T01_9000002838_19121cztM0_level2_quad_clean.evt |
| Size (bytes) | 458,354,880 | 108,973,440 |
| Size | 437.1 MB | 103.9 MB |
| Events in quadrant A | 3,210,745 | 714,487 |
| Events in quadrant B | 3,303,803 | 746,699 |
| Events in quadrant C | 3,596,883 | 711,114 |
| Events in quadrant D | 3,340,842 | 687,495 |
| Mode M0 | |||
|---|---|---|---|
| Quadrant | BADHDUFLAG | Total packets | Discarded packets |
| A | 0 | 13496 | 2 |
| B | 0 | 13696 | 2 |
| C | 0 | 14491 | 2 |
| D | 0 | 13985 | 2 |
| Mode SS | |||
|---|---|---|---|
| Quadrant | BADHDUFLAG | Total packets | Discarded packets |
| A | 0 | 128 | 0 |
| B | 0 | 128 | 0 |
| C | 0 | 128 | 0 |
| D | 0 | 128 | 0 |
| Mode M9 | |||
|---|---|---|---|
| Quadrant | BADHDUFLAG | Total packets | Discarded packets |
| A | 0 | 20 | 0 |
| B | 0 | 21 | 0 |
| C | 0 | 21 | 0 |
| D | 0 | 21 | 0 |
| Quadrant | Total seconds | Saturated seconds | Saturation percentage |
|---|---|---|---|
| A | 6314 | 77 | 1.219512% |
| B | 6314 | 69 | 1.092810% |
| C | 6314 | 229 | 3.626861% |
| D | 6314 | 51 | 0.807729% |
Noise dominated data is calculated using 1-second bins in cleaned event files. If a bin has >2000 counts, and if more than 50% of those come from <1% of pixels, then it is considered to be noise-dominated and hence unusable.
| Quadrant | # 1 sec bins | Bins with >0 counts | Bins with >2000 counts | High rate bins dominated by noise | Noise dominated (total time) | Noise dominated (detector-on time) | Marked lightcurve |
|---|---|---|---|---|---|---|---|
| A | 7604 | 6315 | 11 | 11 | 0.14% | 0.17% | 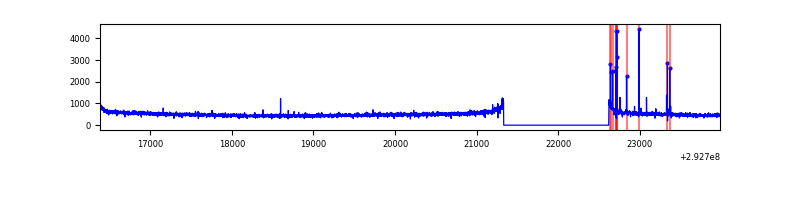 |
| B | 7604 | 6315 | 0 | 0 | 0.00% | 0.00% | 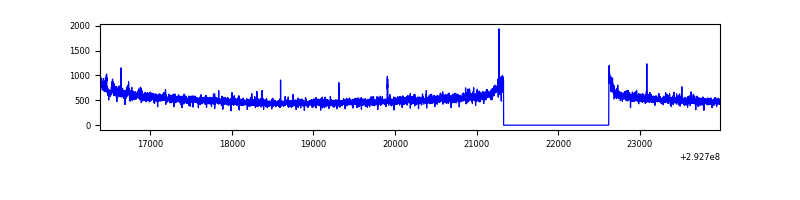 |
| C | 7604 | 6315 | 50 | 50 | 0.66% | 0.79% | 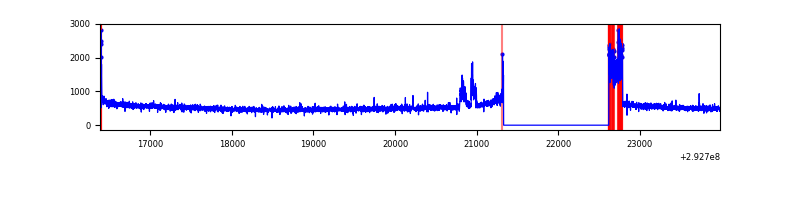 |
| D | 7604 | 6315 | 22 | 22 | 0.29% | 0.35% | 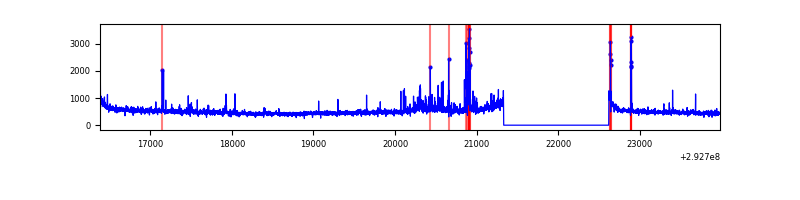 |
Top three noisy pixels from each quadrant. If the there are fewer than three noisy pixels in the level2.evt file, extra rows are filled as -1
| Pixel properties | Quadrant properties | ||||||
|---|---|---|---|---|---|---|---|
| Quadrant | DetID | PixID | Counts | Sigma | Mean | Median | Sigma |
| A | 9 | 143 | 61365 | 368.13 | 818 | 804 | 164.5 |
| A | 0 | 226 | 7180 | 38.76 | 818 | 804 | 164.5 |
| A | 3 | 137 | 5952 | 31.29 | 818 | 804 | 164.5 |
| B | 10 | 245 | 35274 | 218.76 | 832 | 812 | 157.5 |
| B | 12 | 111 | 17987 | 109.03 | 832 | 812 | 157.5 |
| B | 11 | 111 | 15614 | 93.96 | 832 | 812 | 157.5 |
| C | 3 | 233 | 339465 | 1819.92 | 798 | 806 | 186.1 |
| C | 14 | 238 | 124205 | 663.13 | 798 | 806 | 186.1 |
| C | 9 | 54 | 17213 | 88.17 | 798 | 806 | 186.1 |
| D | 1 | 52 | 99441 | 508.83 | 801 | 782 | 193.9 |
| D | 12 | 218 | 76221 | 389.08 | 801 | 782 | 193.9 |
| D | 11 | 176 | 72814 | 371.5 | 801 | 782 | 193.9 |
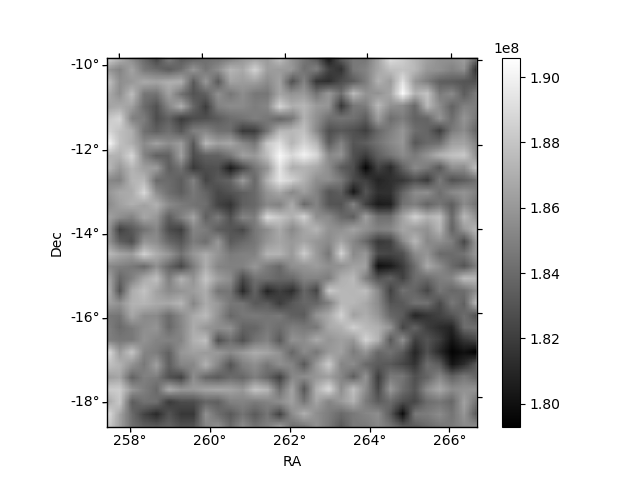
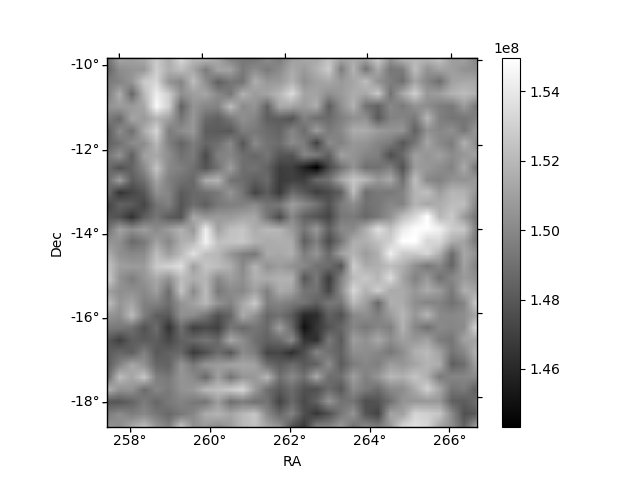
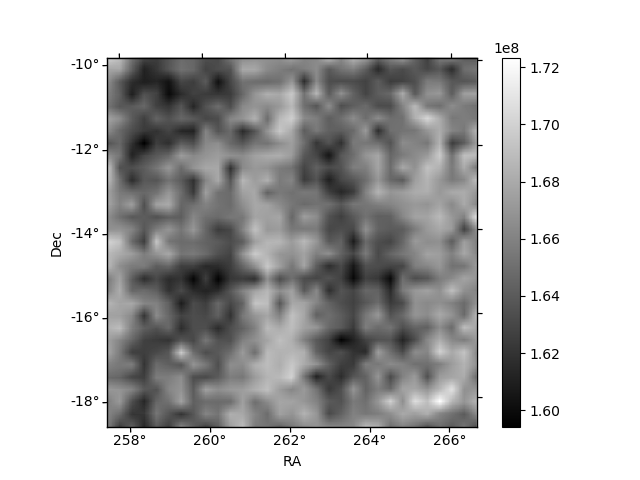
Histogram calculated using DETX and DETY for each event in the final _common_clean file
| Quadrant A | 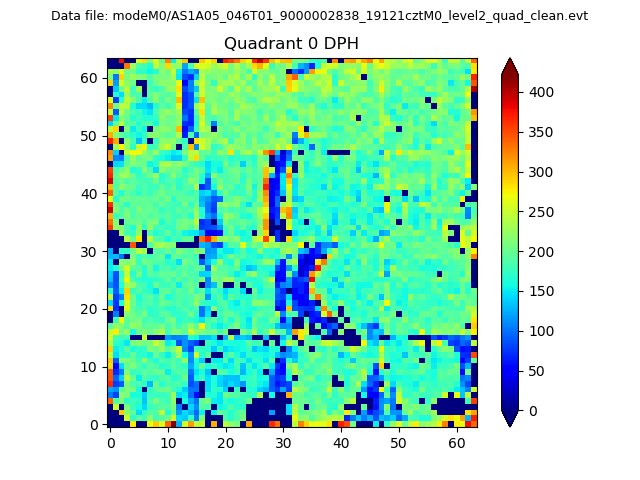 |
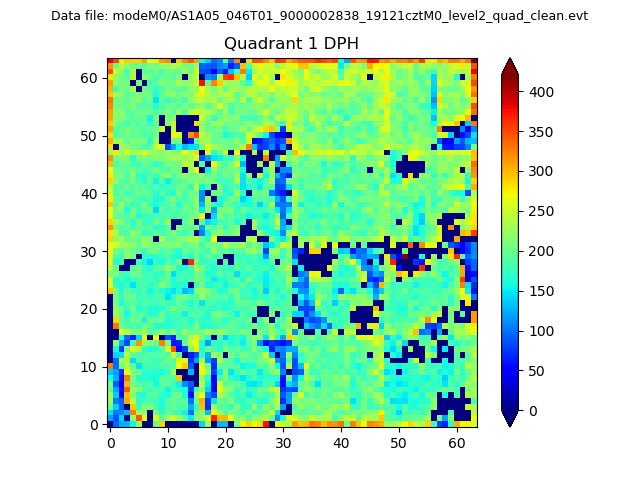 |
Quadrant B |
|---|---|---|---|
| Quadrant D | 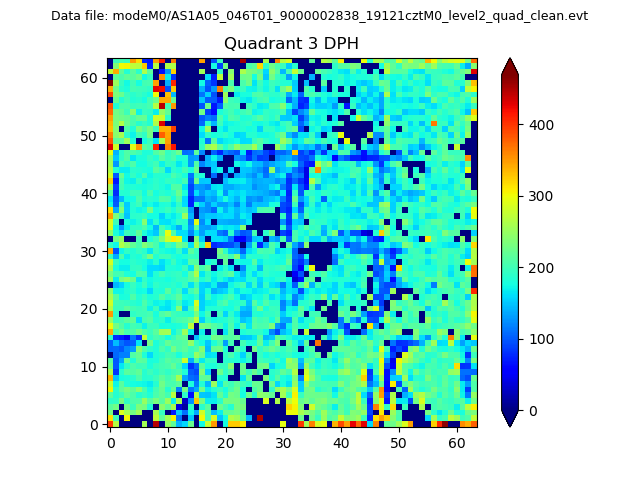 |
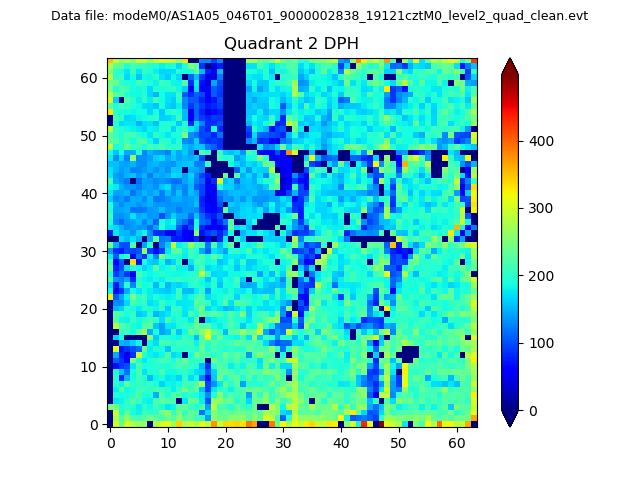 |
Quadrant C |
| Plot type | Count rate plots | Images |
|---|---|---|
| Comparison with Poisson distribution Blue bars denote a histogram of data divided into 1 sec bins. Red curve is a Poisson curve with rate = median count rate of data. |
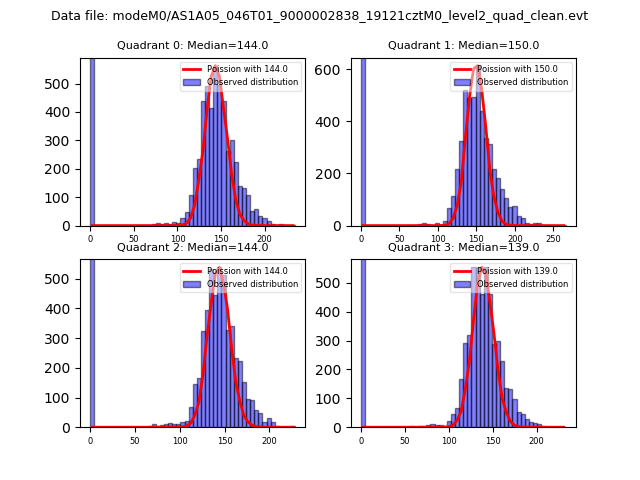 |
 |
| Quadrant-wise count rates Data is divided into 100 sec bins |
 |
|
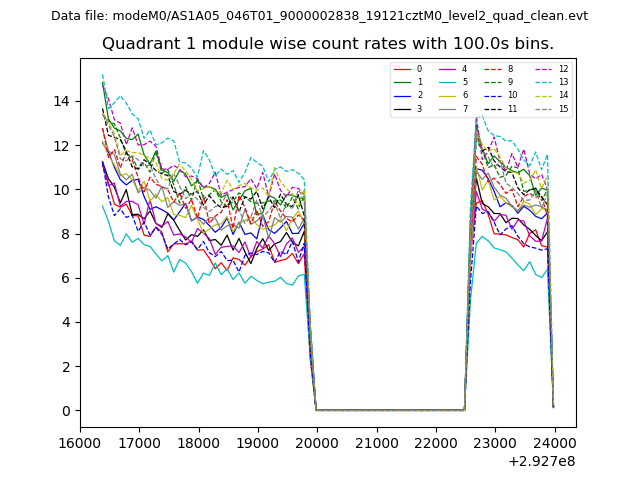
| Module-wise count rates for Quadrant A Data is divided into 100 sec bins |
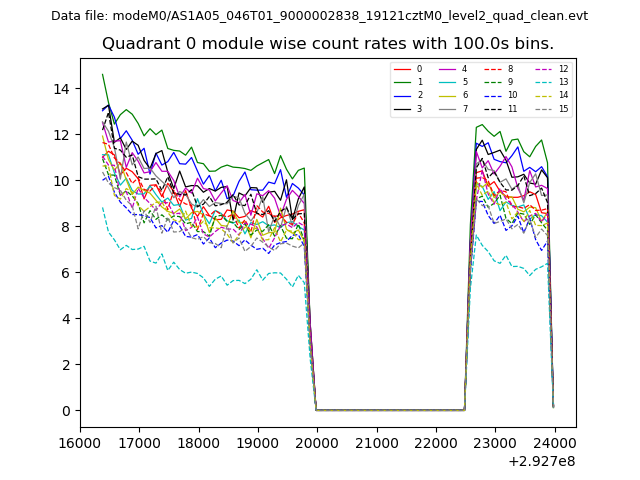 |
 |
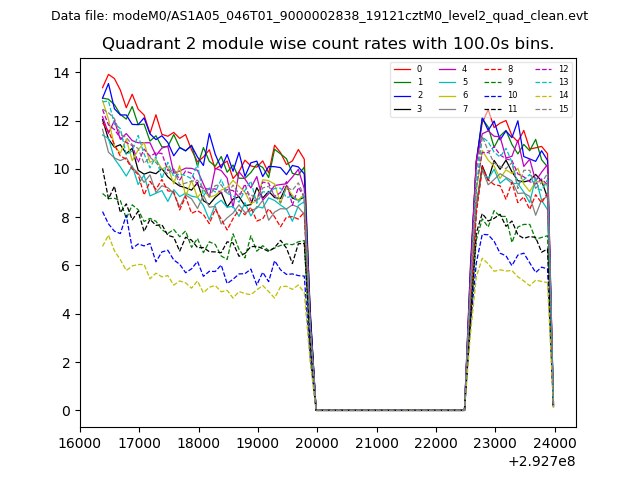
| Module-wise count rates for Quadrant B Data is divided into 100 sec bins |
 |
 |
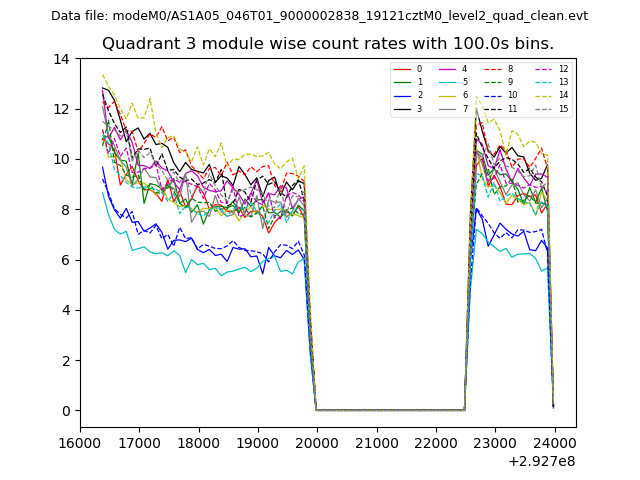
| Module-wise count rates for Quadrant C Data is divided into 100 sec bins |
 |
 |
| Module-wise count rates for Quadrant D Data is divided into 100 sec bins |
 |
 |
| Parameter | Plot |
|---|---|
| CZT HV Monitor | 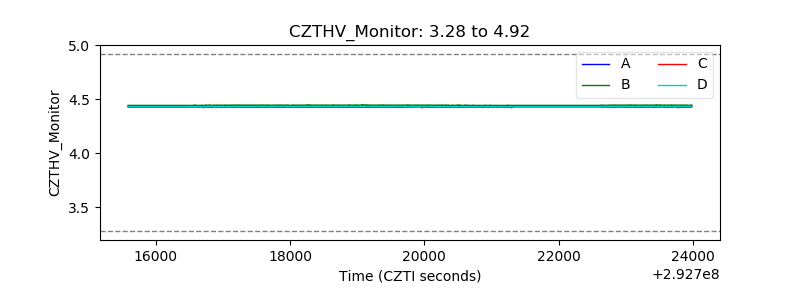 |
| D_VDD | 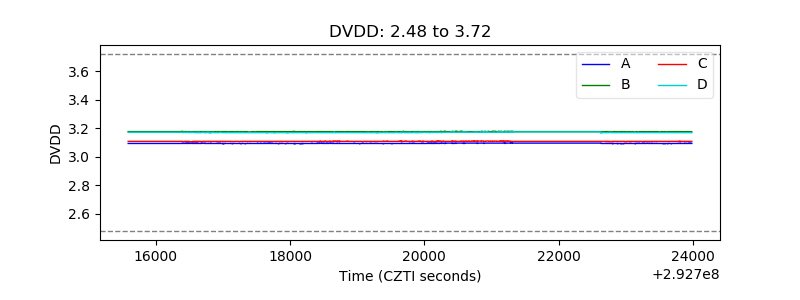 |
| Temperature 1 | 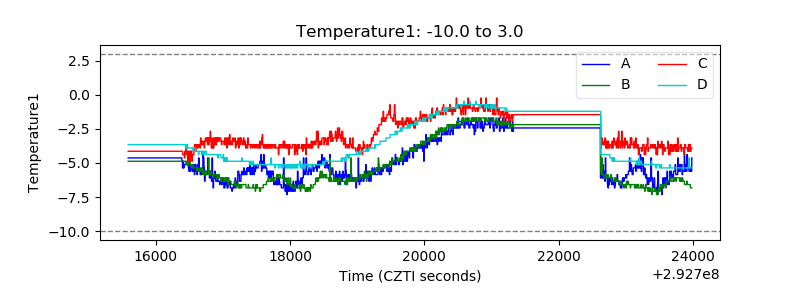 |
| Veto HV Monitor | 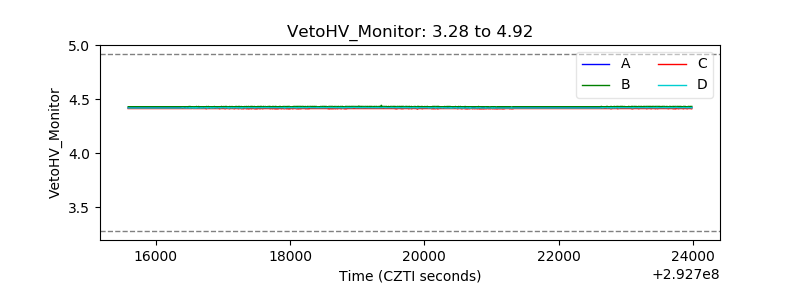 |
| Veto LLD | 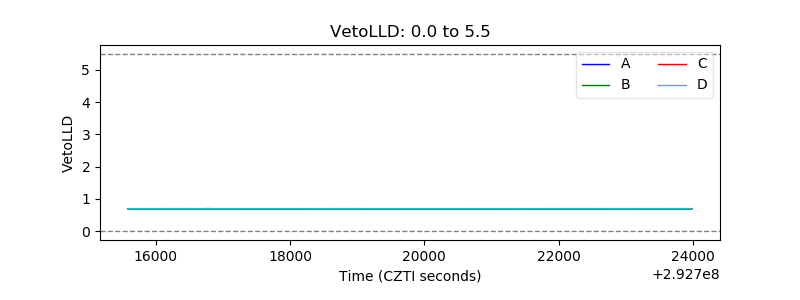 |
| Alpha Counter | 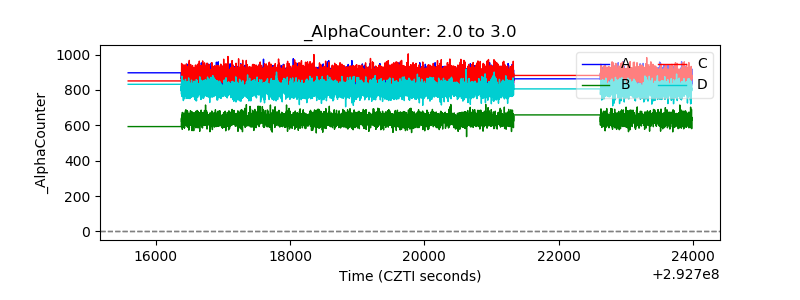 |
| _CPM_Rate | 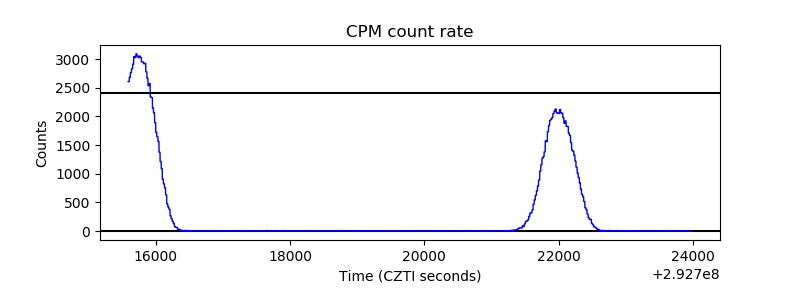 |
| CZT Counter | 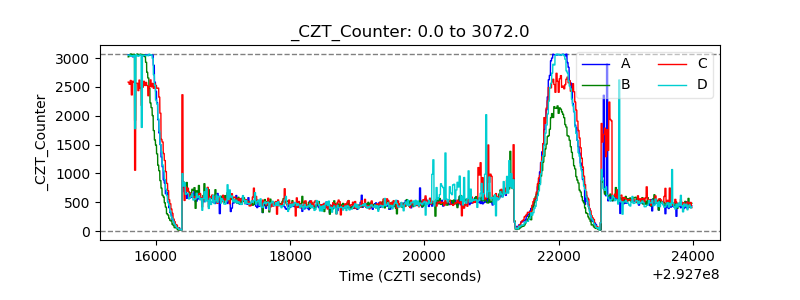 |
| +2.5 Volts monitor |  |
| +5 Volts monitor |  |
| _ROLL_ROT | 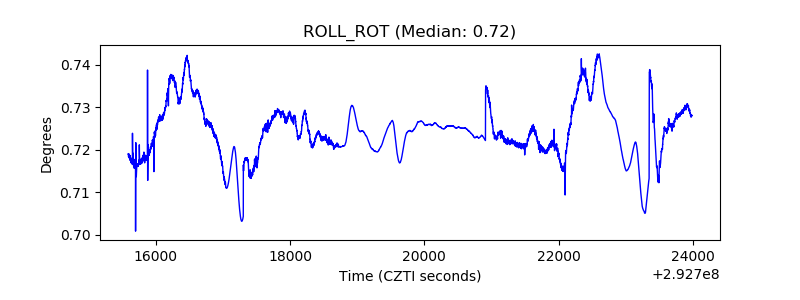 |
| _Roll_DEC | 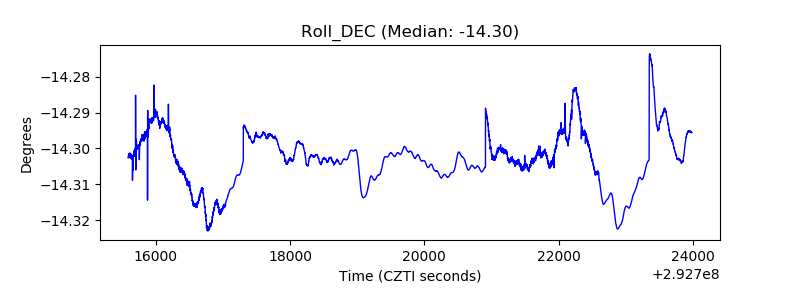 |
| _Roll_RA | 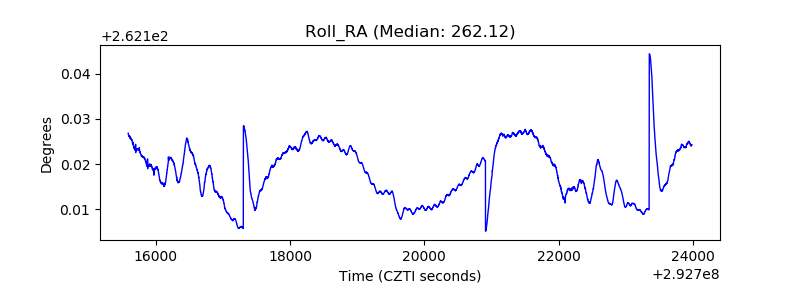 |
| Veto Counter | 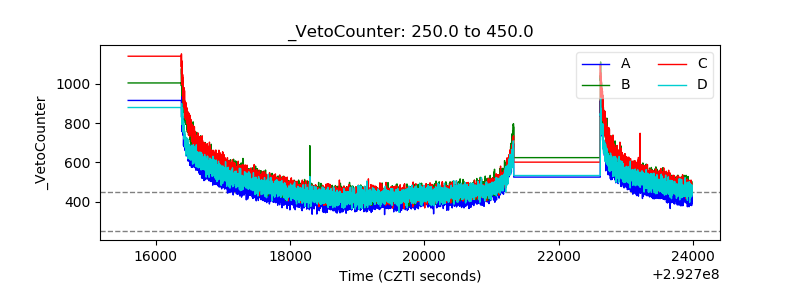 |