| Param | Original file | Final file |
|---|---|---|
| Filename | modeM0/AS1A05_046T01_9000002838_19124cztM0_level2.evt | modeM0/AS1A05_046T01_9000002838_19124cztM0_level2_quad_clean.evt |
| Size (bytes) | 553,020,480 | 105,606,720 |
| Size | 527.4 MB | 100.7 MB |
| Events in quadrant A | 3,532,927 | 672,578 |
| Events in quadrant B | 4,377,274 | 691,096 |
| Events in quadrant C | 3,654,527 | 672,732 |
| Events in quadrant D | 4,671,068 | 636,479 |
| Mode M0 | |||
|---|---|---|---|
| Quadrant | BADHDUFLAG | Total packets | Discarded packets |
| A | 0 | 15519 | 8 |
| B | 0 | 18171 | 6 |
| C | 0 | 15578 | 12 |
| D | 0 | 19136 | 4 |
| Mode SS | |||
|---|---|---|---|
| Quadrant | BADHDUFLAG | Total packets | Discarded packets |
| A | 0 | 154 | 0 |
| B | 0 | 154 | 0 |
| C | 0 | 154 | 0 |
| D | 0 | 154 | 0 |
| Mode M9 | |||
|---|---|---|---|
| Quadrant | BADHDUFLAG | Total packets | Discarded packets |
| A | 0 | 5 | 0 |
| B | 0 | 5 | 0 |
| C | 0 | 5 | 0 |
| D | 0 | 5 | 0 |
| Quadrant | Total seconds | Saturated seconds | Saturation percentage |
|---|---|---|---|
| A | 7547 | 99 | 1.311780% |
| B | 7549 | 215 | 2.848059% |
| C | 7546 | 112 | 1.484230% |
| D | 7549 | 378 | 5.007286% |
Noise dominated data is calculated using 1-second bins in cleaned event files. If a bin has >2000 counts, and if more than 50% of those come from <1% of pixels, then it is considered to be noise-dominated and hence unusable.
| Quadrant | # 1 sec bins | Bins with >0 counts | Bins with >2000 counts | High rate bins dominated by noise | Noise dominated (total time) | Noise dominated (detector-on time) | Marked lightcurve |
|---|---|---|---|---|---|---|---|
| A | 8090 | 7551 | 1 | 1 | 0.01% | 0.01% | 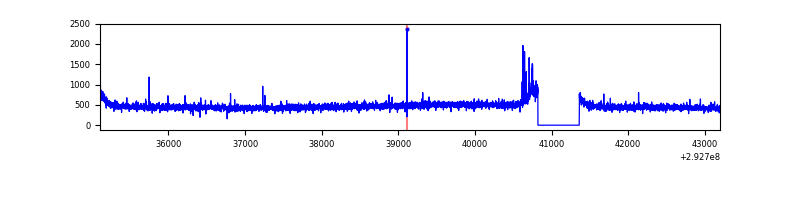 |
| B | 8091 | 7552 | 61 | 61 | 0.75% | 0.81% | 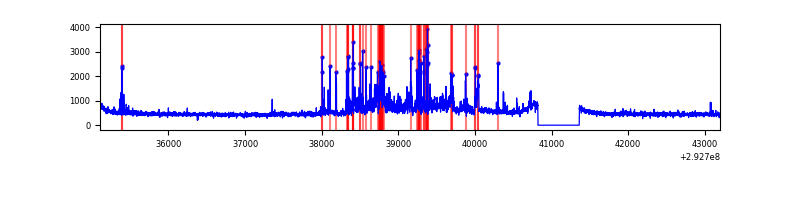 |
| C | 8090 | 7551 | 0 | 0 | 0.00% | 0.00% | 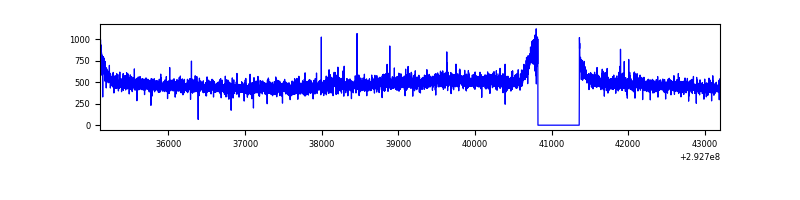 |
| D | 8090 | 7551 | 217 | 217 | 2.68% | 2.87% | 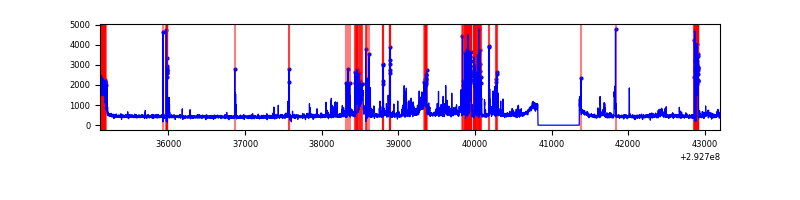 |
Top three noisy pixels from each quadrant. If the there are fewer than three noisy pixels in the level2.evt file, extra rows are filled as -1
| Pixel properties | Quadrant properties | ||||||
|---|---|---|---|---|---|---|---|
| Quadrant | DetID | PixID | Counts | Sigma | Mean | Median | Sigma |
| A | 9 | 143 | 22048 | 113.79 | 911 | 891 | 185.9 |
| A | 0 | 226 | 7973 | 38.09 | 911 | 891 | 185.9 |
| A | 13 | 254 | 7962 | 38.03 | 911 | 891 | 185.9 |
| B | 10 | 245 | 323058 | 1821.55 | 909 | 881 | 176.9 |
| B | 6 | 36 | 230155 | 1296.29 | 909 | 881 | 176.9 |
| B | 7 | 220 | 157713 | 886.71 | 909 | 881 | 176.9 |
| C | 14 | 238 | 136864 | 647.11 | 887 | 894 | 210.1 |
| C | 3 | 233 | 56593 | 265.08 | 887 | 894 | 210.1 |
| C | 13 | 61 | 6203 | 25.27 | 887 | 894 | 210.1 |
| D | 11 | 176 | 568272 | 2620.04 | 882 | 856 | 216.6 |
| D | 1 | 52 | 533456 | 2459.28 | 882 | 856 | 216.6 |
| D | 7 | 238 | 110601 | 506.75 | 882 | 856 | 216.6 |
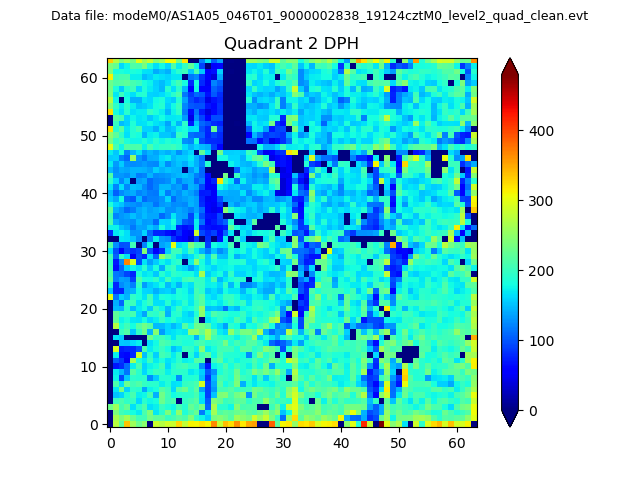
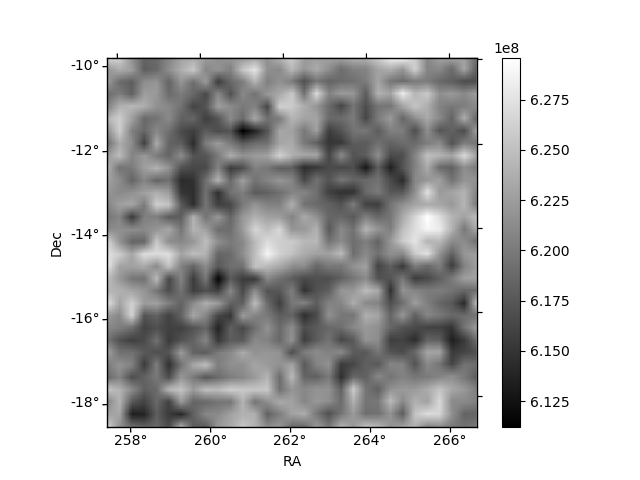
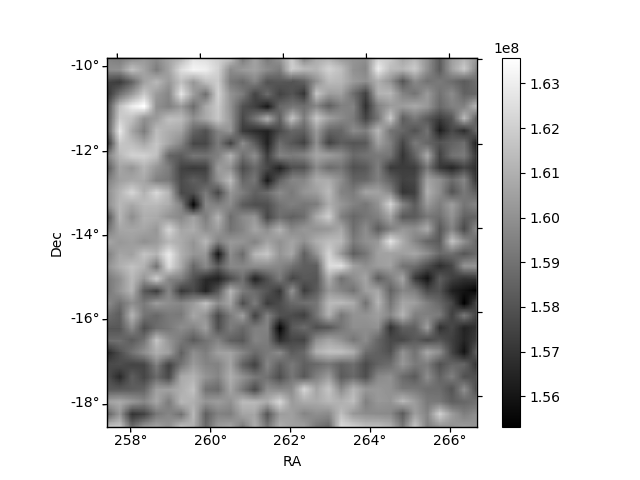
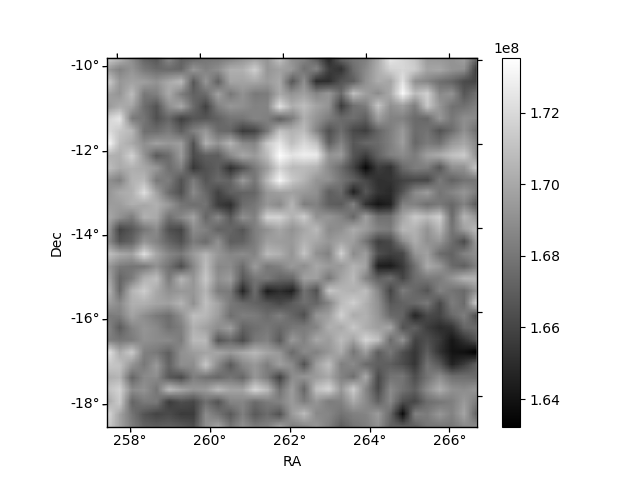
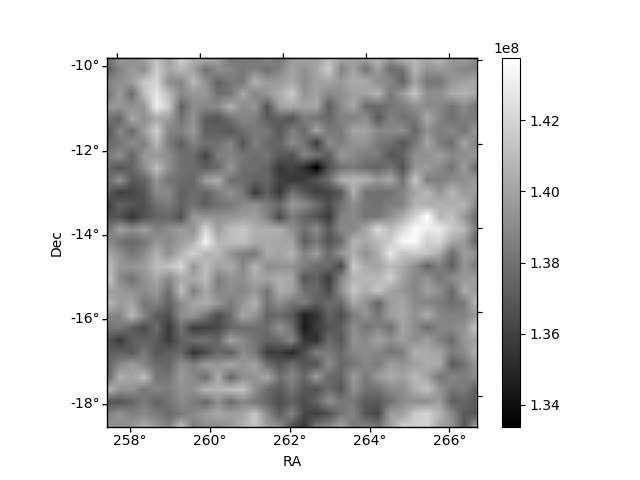
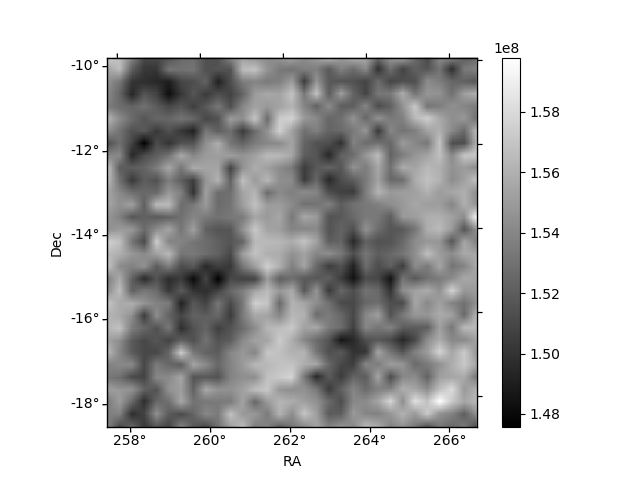
Histogram calculated using DETX and DETY for each event in the final _common_clean file
| Quadrant A | 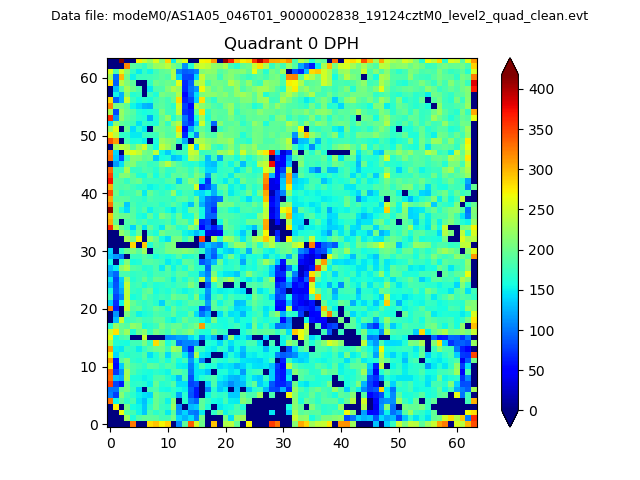 |
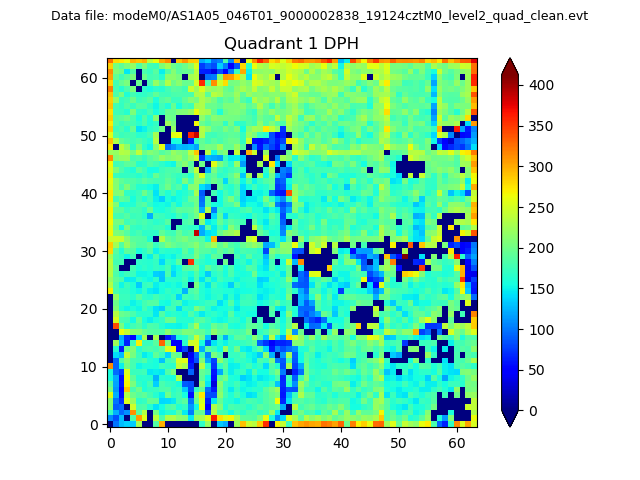 |
Quadrant B |
|---|---|---|---|
| Quadrant D | 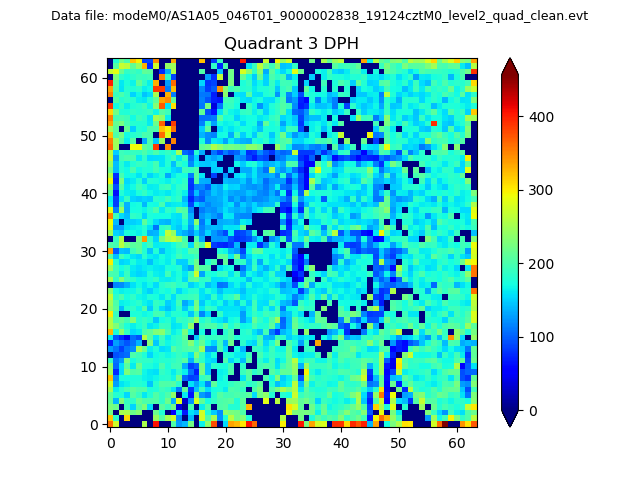 |
 |
Quadrant C |
| Plot type | Count rate plots | Images |
|---|---|---|
| Comparison with Poisson distribution Blue bars denote a histogram of data divided into 1 sec bins. Red curve is a Poisson curve with rate = median count rate of data. |
 |
 |
| Quadrant-wise count rates Data is divided into 100 sec bins |
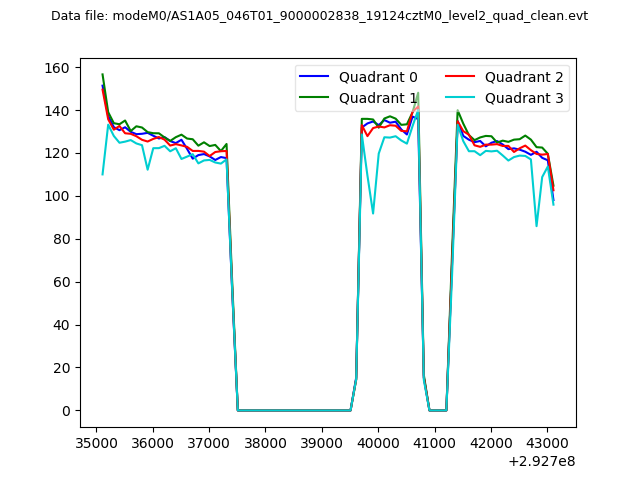 |
|
| Module-wise count rates for Quadrant A Data is divided into 100 sec bins |
 |
 |
| Module-wise count rates for Quadrant B Data is divided into 100 sec bins |
 |
 |
| Module-wise count rates for Quadrant C Data is divided into 100 sec bins |
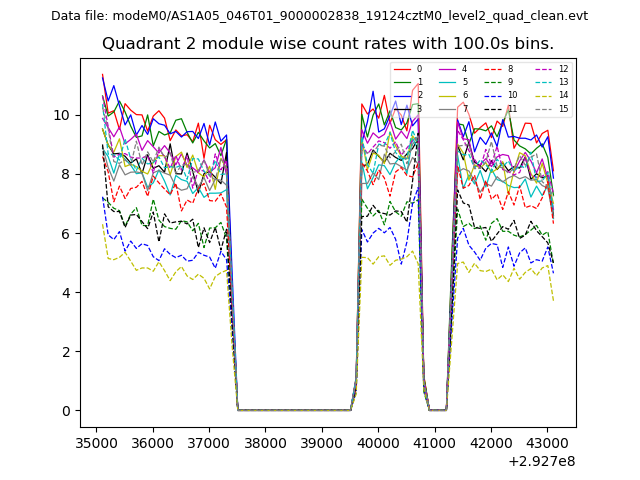 |
 |
| Module-wise count rates for Quadrant D Data is divided into 100 sec bins |
 |
 |
| Parameter | Plot |
|---|---|
| CZT HV Monitor | 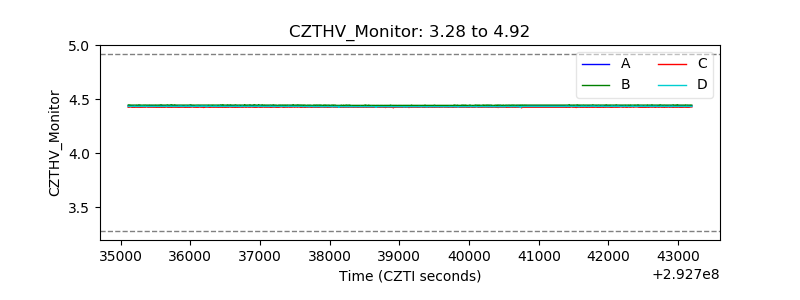 |
| D_VDD | 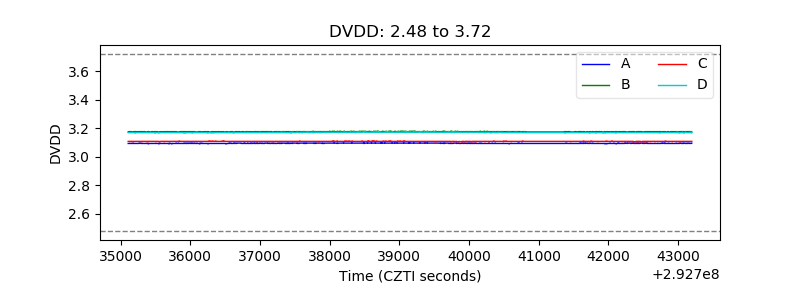 |
| Temperature 1 | 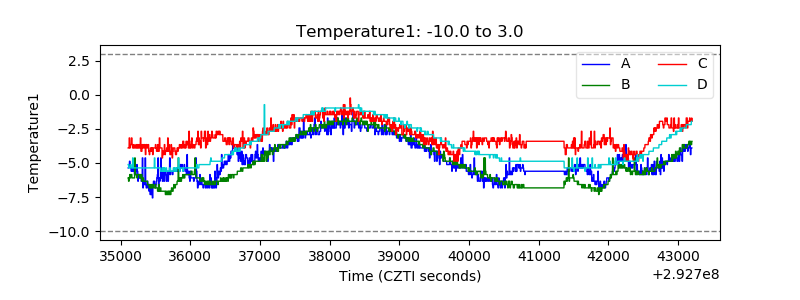 |
| Veto HV Monitor | 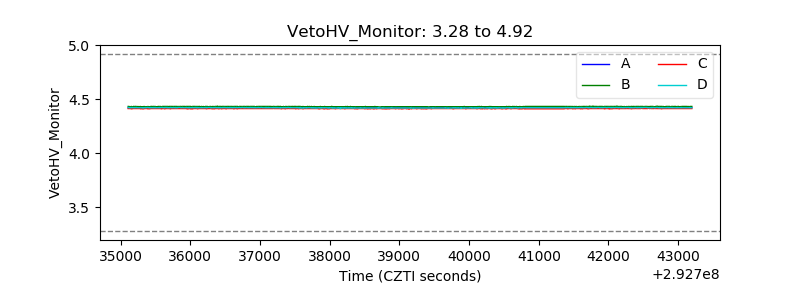 |
| Veto LLD | 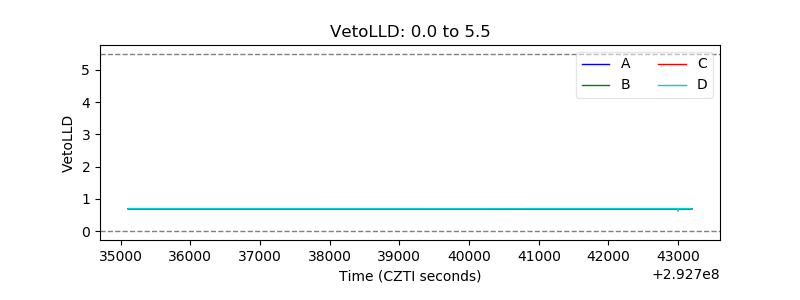 |
| Alpha Counter | 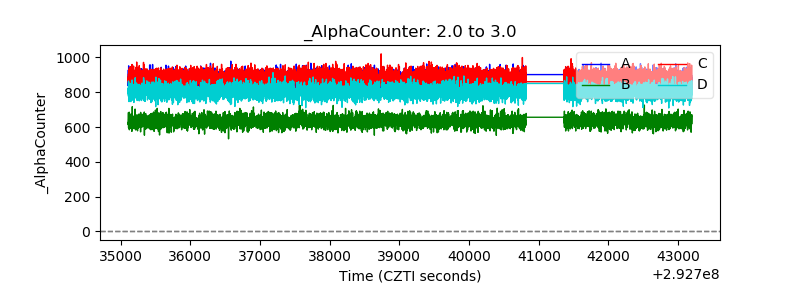 |
| _CPM_Rate | 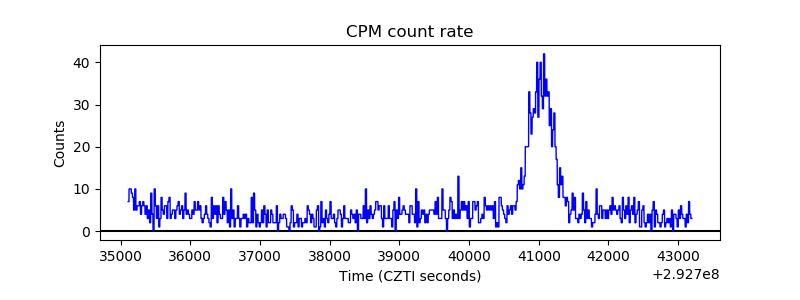 |
| CZT Counter | 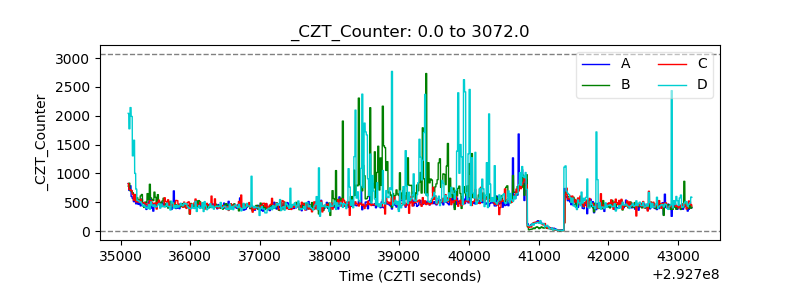 |
| +2.5 Volts monitor |  |
| +5 Volts monitor | 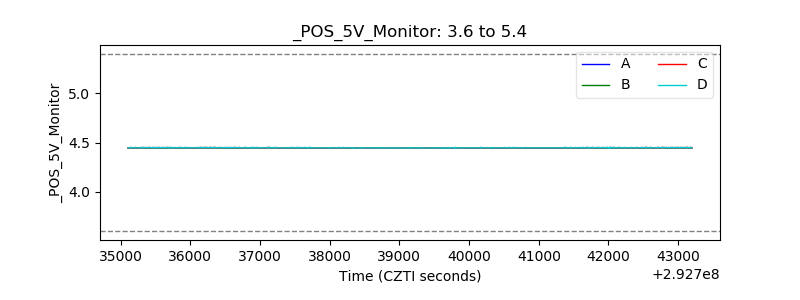 |
| _ROLL_ROT | 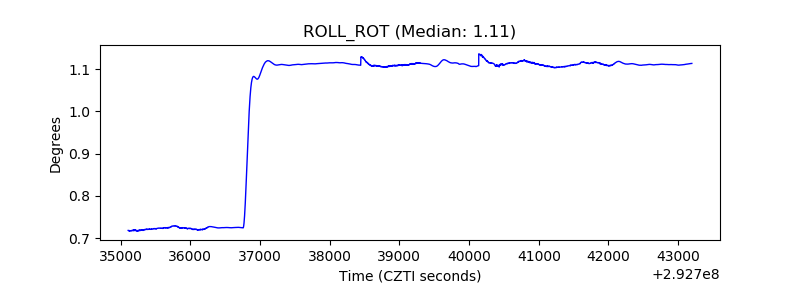 |
| _Roll_DEC | 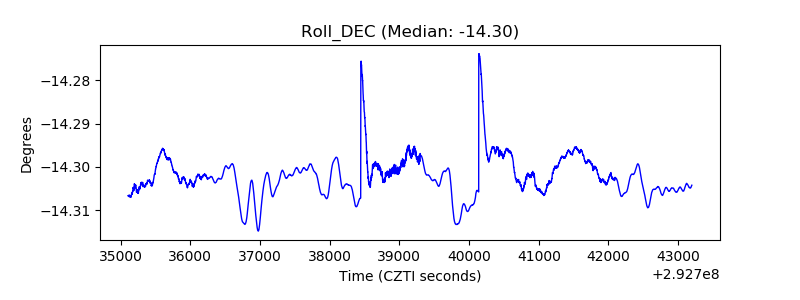 |
| _Roll_RA | 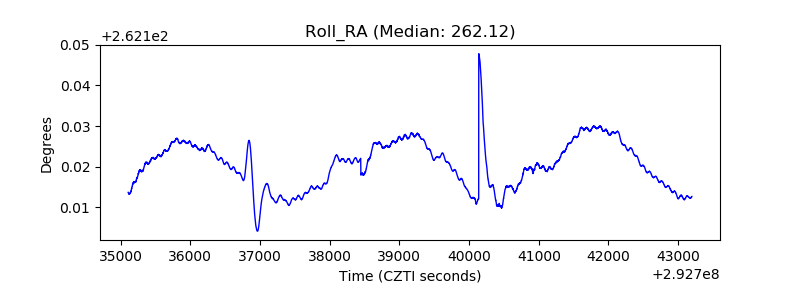 |
| Veto Counter | 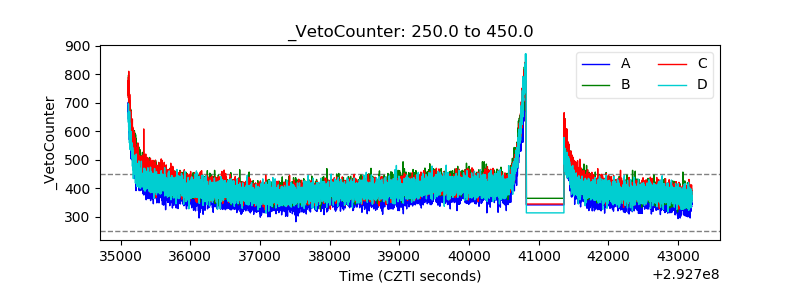 |