| Param | Original file | Final file |
|---|---|---|
| Filename | modeM0/AS1A05_046T01_9000002838_19130cztM0_level2.evt | modeM0/AS1A05_046T01_9000002838_19130cztM0_level2_quad_clean.evt |
| Size (bytes) | 2,583,192,960 | 406,716,480 |
| Size | 2.4 GB | 387.9 MB |
| Events in quadrant A | 16,088,746 | 2,505,954 |
| Events in quadrant B | 18,969,076 | 2,556,540 |
| Events in quadrant C | 16,714,933 | 2,495,052 |
| Events in quadrant D | 24,127,025 | 2,385,034 |
| Mode M0 | |||
|---|---|---|---|
| Quadrant | BADHDUFLAG | Total packets | Discarded packets |
| A | 0 | 70837 | 6 |
| B | 0 | 78583 | 6 |
| C | 0 | 71294 | 6 |
| D | 0 | 95332 | 6 |
| Mode SS | |||
|---|---|---|---|
| Quadrant | BADHDUFLAG | Total packets | Discarded packets |
| A | 0 | 702 | 0 |
| B | 0 | 702 | 0 |
| C | 0 | 702 | 0 |
| D | 0 | 702 | 0 |
| Mode M9 | |||
|---|---|---|---|
| Quadrant | BADHDUFLAG | Total packets | Discarded packets |
| A | 0 | 34 | 0 |
| B | 0 | 34 | 0 |
| C | 0 | 34 | 0 |
| D | 0 | 34 | 0 |
| Quadrant | Total seconds | Saturated seconds | Saturation percentage |
|---|---|---|---|
| A | 34580 | 496 | 1.434355% |
| B | 34580 | 809 | 2.339503% |
| C | 34581 | 609 | 1.761083% |
| D | 34581 | 1734 | 5.014314% |
Noise dominated data is calculated using 1-second bins in cleaned event files. If a bin has >2000 counts, and if more than 50% of those come from <1% of pixels, then it is considered to be noise-dominated and hence unusable.
| Quadrant | # 1 sec bins | Bins with >0 counts | Bins with >2000 counts | High rate bins dominated by noise | Noise dominated (total time) | Noise dominated (detector-on time) | Marked lightcurve |
|---|---|---|---|---|---|---|---|
| A | 37930 | 34582 | 5 | 5 | 0.01% | 0.01% | 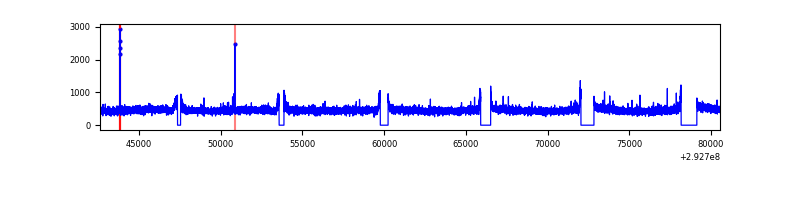 |
| B | 37930 | 34583 | 144 | 144 | 0.38% | 0.42% | 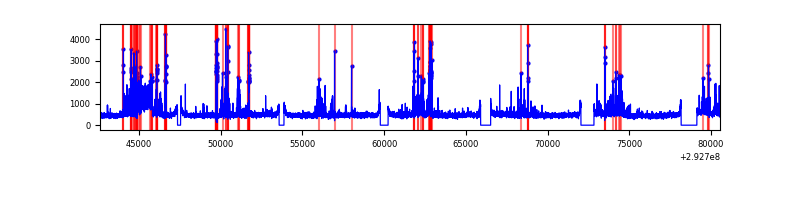 |
| C | 37931 | 34585 | 5 | 5 | 0.01% | 0.01% | 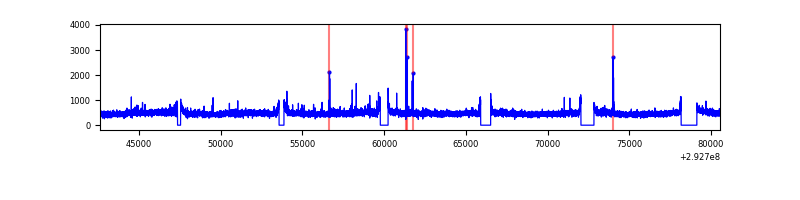 |
| D | 37931 | 34585 | 1080 | 1080 | 2.85% | 3.12% | 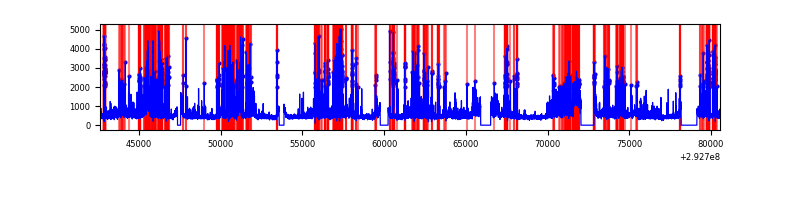 |
Top three noisy pixels from each quadrant. If the there are fewer than three noisy pixels in the level2.evt file, extra rows are filled as -1
| Pixel properties | Quadrant properties | ||||||
|---|---|---|---|---|---|---|---|
| Quadrant | DetID | PixID | Counts | Sigma | Mean | Median | Sigma |
| A | 13 | 254 | 37175 | 39.21 | 4171 | 4068 | 844.2 |
| A | 0 | 226 | 36212 | 38.07 | 4171 | 4068 | 844.2 |
| A | 3 | 137 | 33134 | 34.43 | 4171 | 4068 | 844.2 |
| B | 10 | 245 | 962117 | 1204.58 | 4158 | 4041 | 795.4 |
| B | 7 | 220 | 865639 | 1083.28 | 4158 | 4041 | 795.4 |
| B | 6 | 36 | 425793 | 530.27 | 4158 | 4041 | 795.4 |
| C | 14 | 238 | 618794 | 651.78 | 4039 | 4066 | 943.2 |
| C | 3 | 233 | 297387 | 311.0 | 4039 | 4066 | 943.2 |
| C | 0 | 207 | 41294 | 39.47 | 4039 | 4066 | 943.2 |
| D | 11 | 176 | 4170107 | 4248.36 | 4029 | 3913 | 980.7 |
| D | 1 | 20 | 2928583 | 2982.35 | 4029 | 3913 | 980.7 |
| D | 1 | 52 | 1268255 | 1289.28 | 4029 | 3913 | 980.7 |
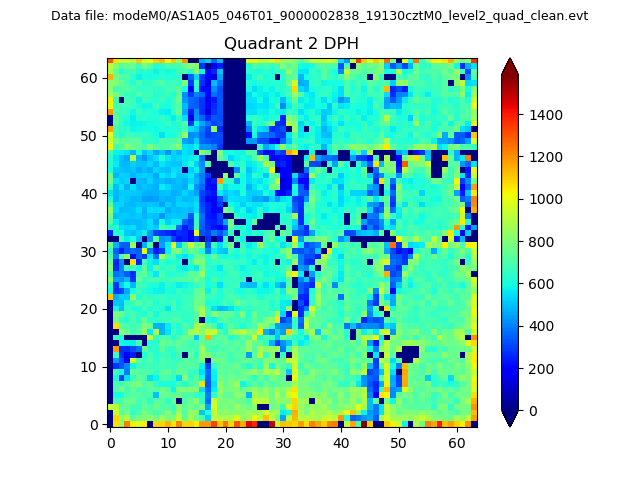
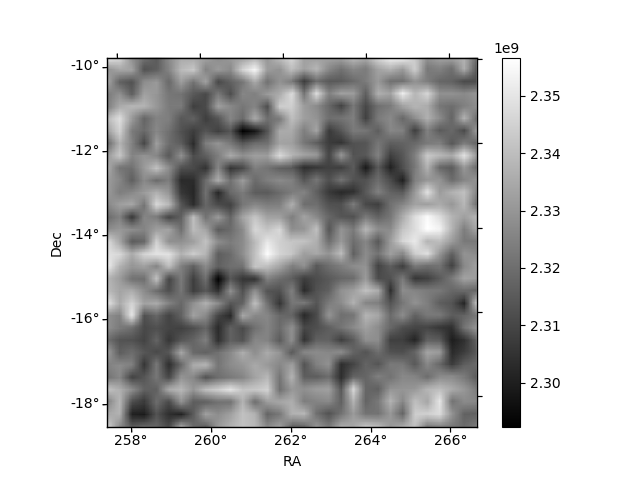
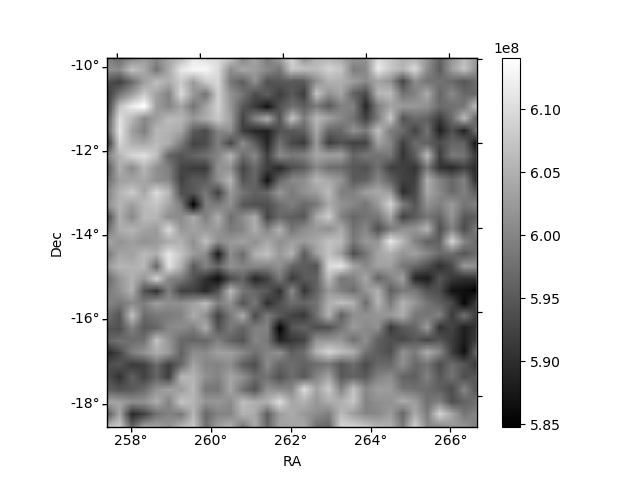
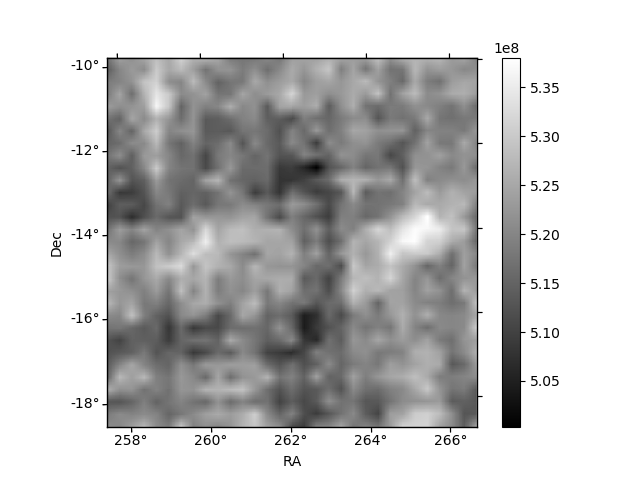
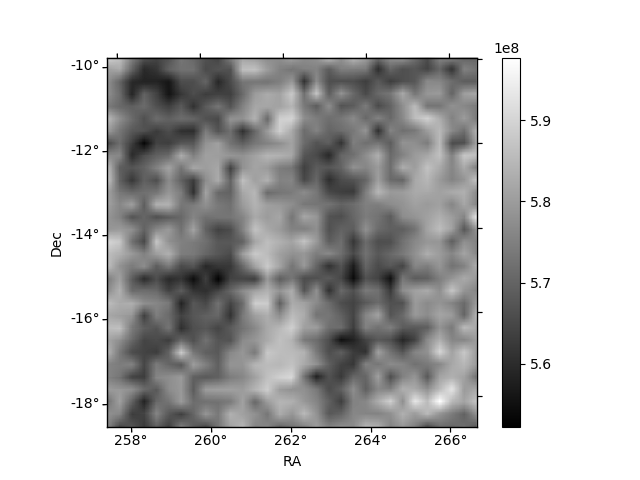
Histogram calculated using DETX and DETY for each event in the final _common_clean file
| Quadrant A | 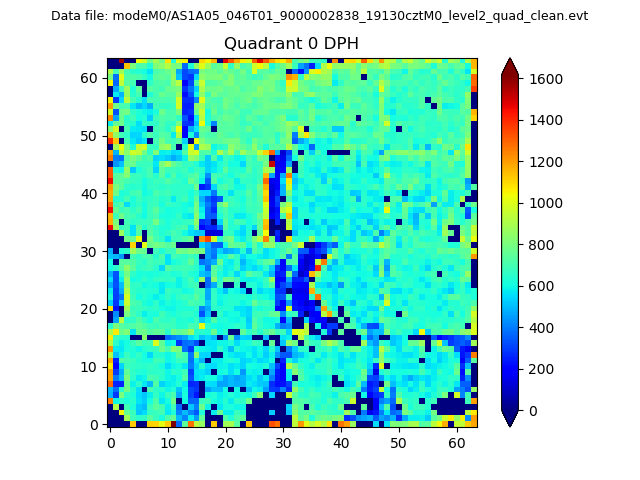 |
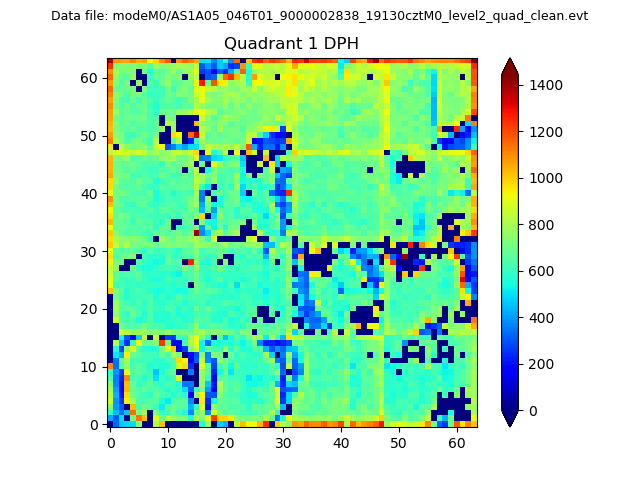 |
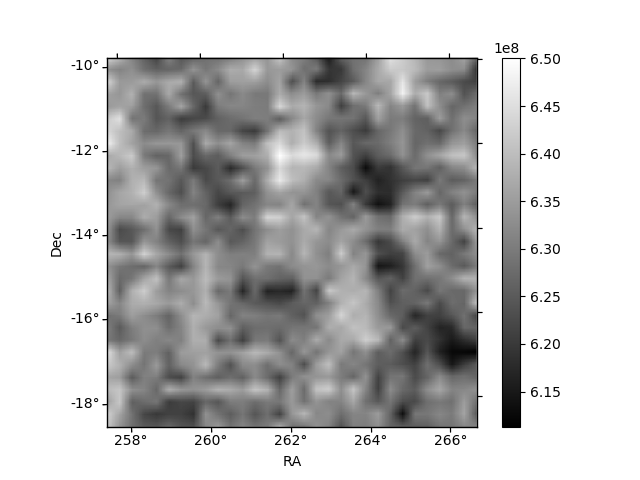
Quadrant B |
|---|---|---|---|
| Quadrant D | 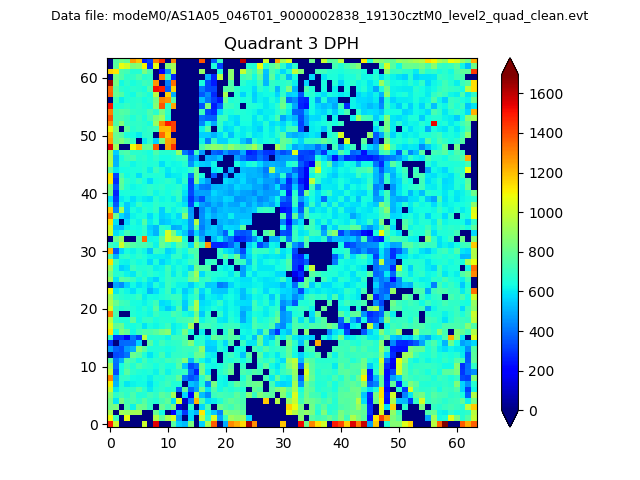 |
 |
Quadrant C |
| Plot type | Count rate plots | Images |
|---|---|---|
| Comparison with Poisson distribution Blue bars denote a histogram of data divided into 1 sec bins. Red curve is a Poisson curve with rate = median count rate of data. |
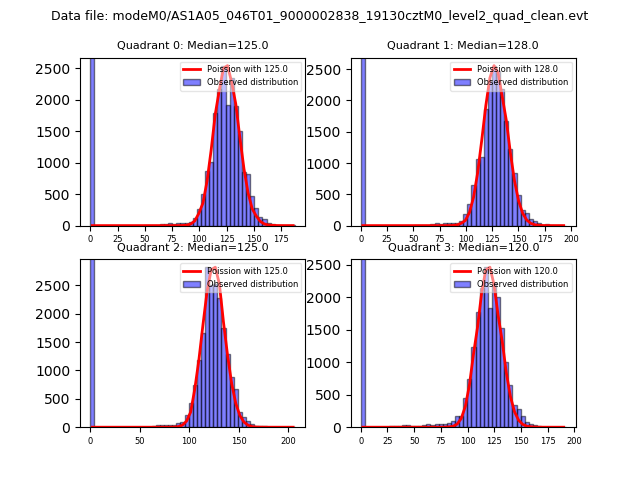 |
 |
| Quadrant-wise count rates Data is divided into 100 sec bins |
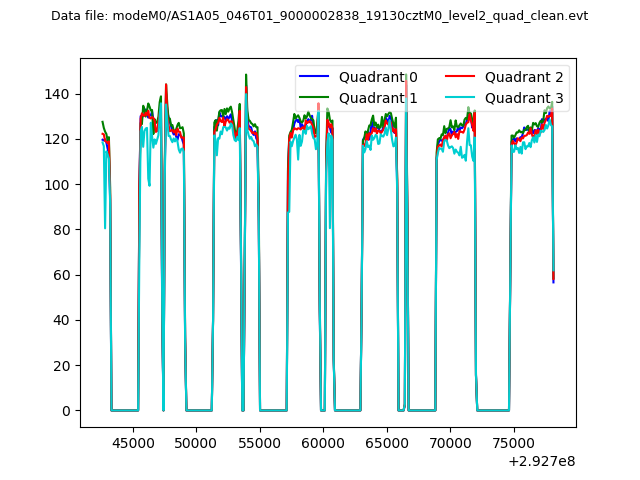 |
|
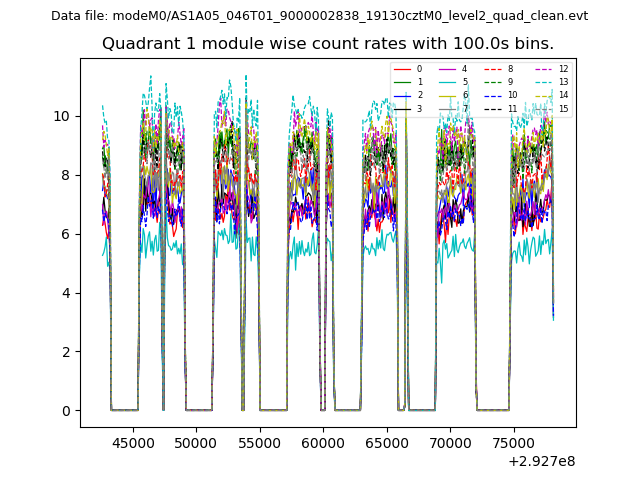
| Module-wise count rates for Quadrant A Data is divided into 100 sec bins |
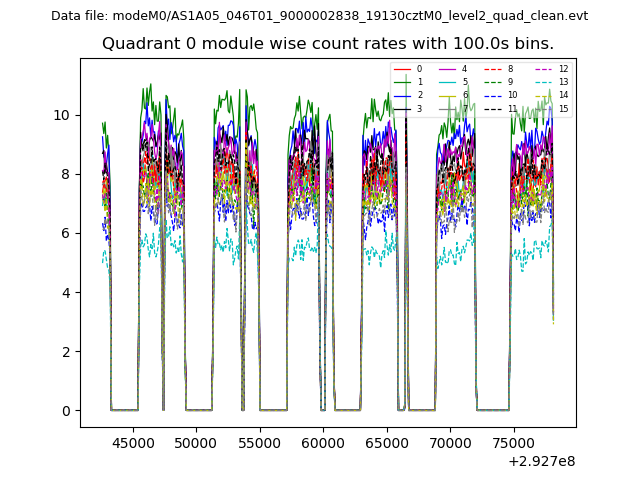 |
 |
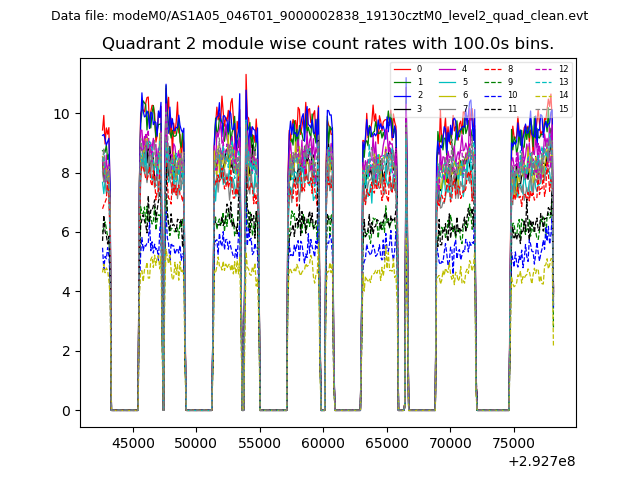
| Module-wise count rates for Quadrant B Data is divided into 100 sec bins |
 |
 |
| Module-wise count rates for Quadrant C Data is divided into 100 sec bins |
 |
 |
| Module-wise count rates for Quadrant D Data is divided into 100 sec bins |
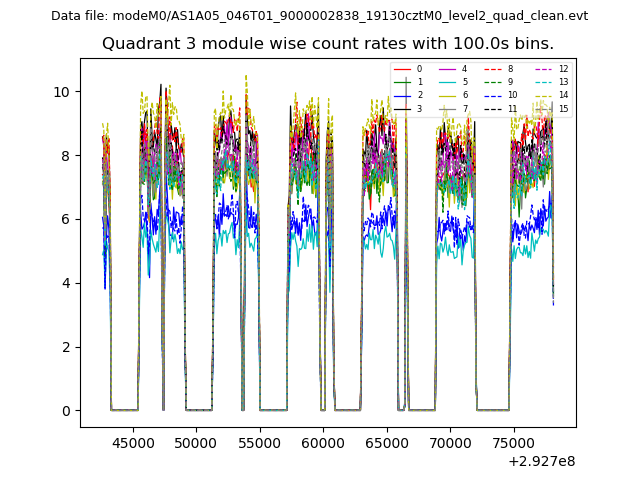 |
 |
| Parameter | Plot |
|---|---|
| CZT HV Monitor | 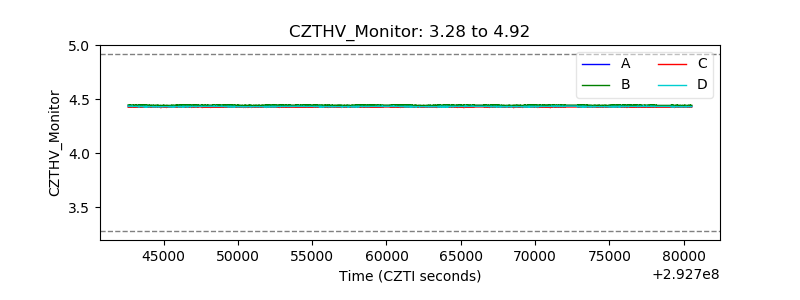 |
| D_VDD | 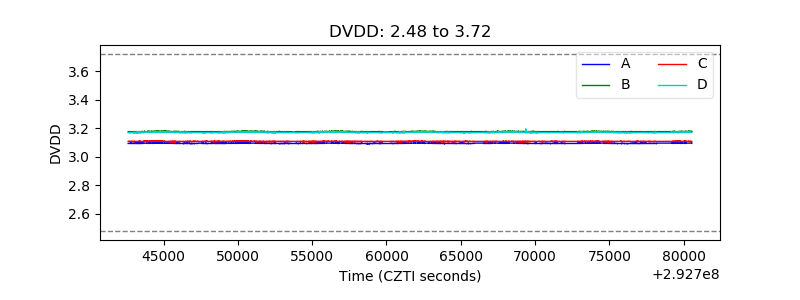 |
| Temperature 1 | 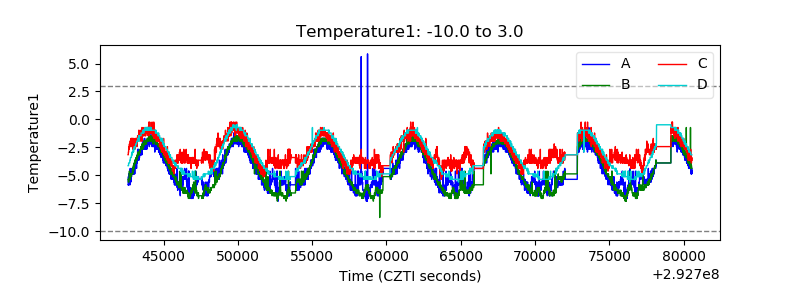 |
| Veto HV Monitor | 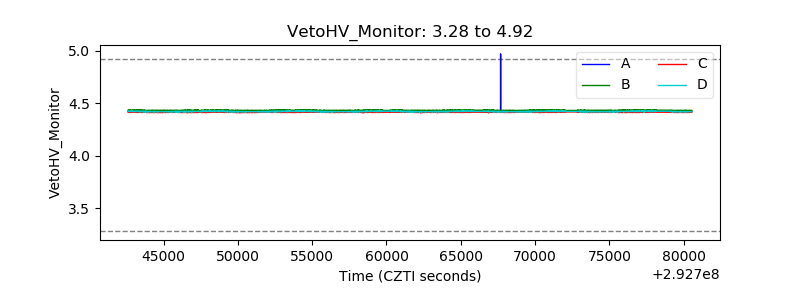 |
| Veto LLD | 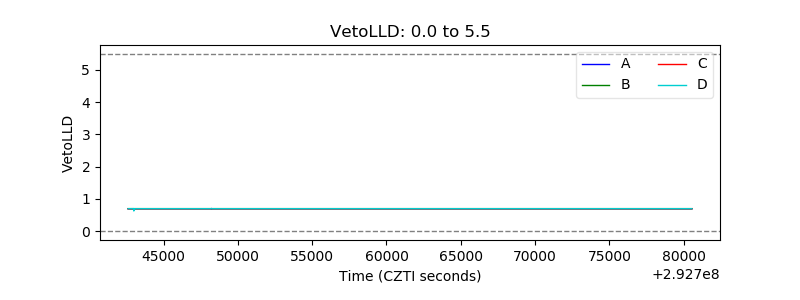 |
| Alpha Counter | 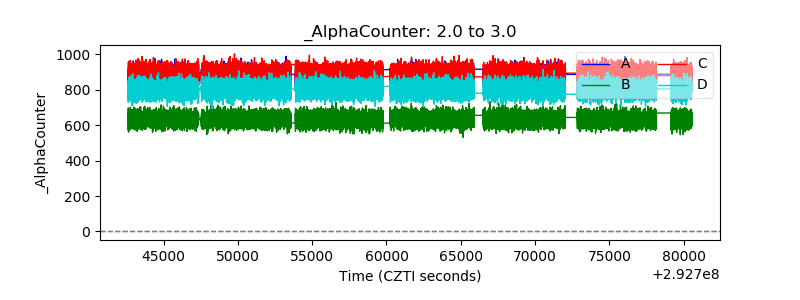 |
| _CPM_Rate | 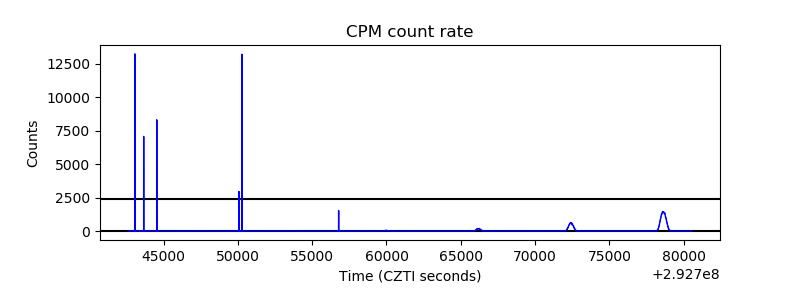 |
| CZT Counter | 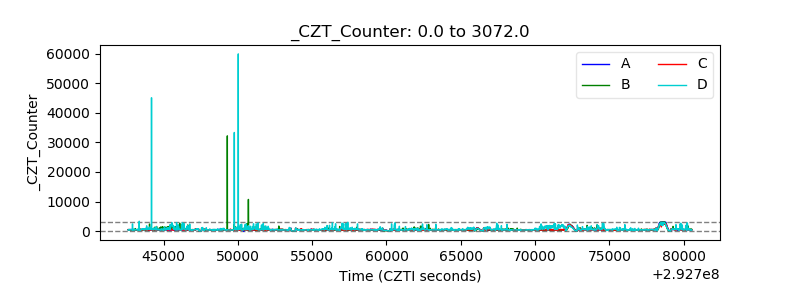 |
| +2.5 Volts monitor | 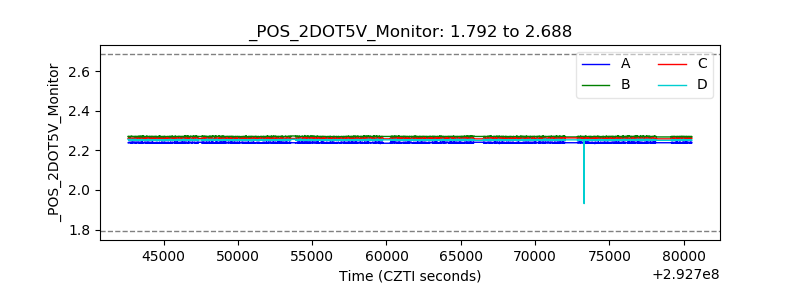 |
| +5 Volts monitor | 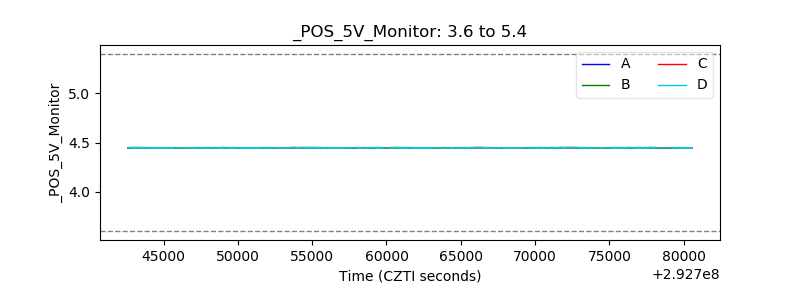 |
| _ROLL_ROT | 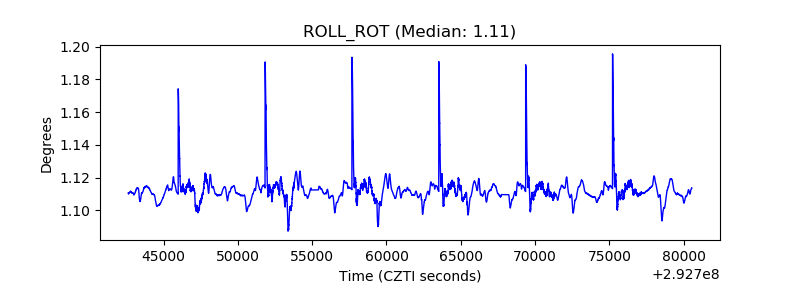 |
| _Roll_DEC | 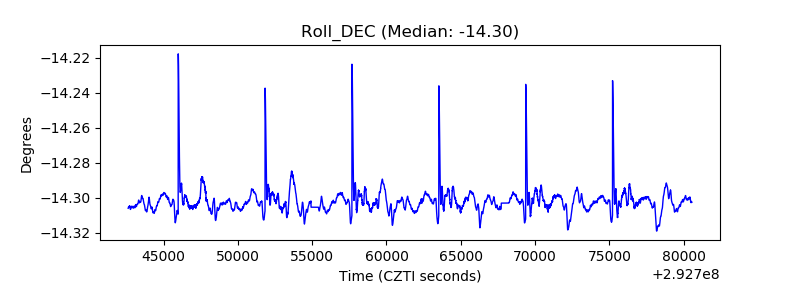 |
| _Roll_RA | 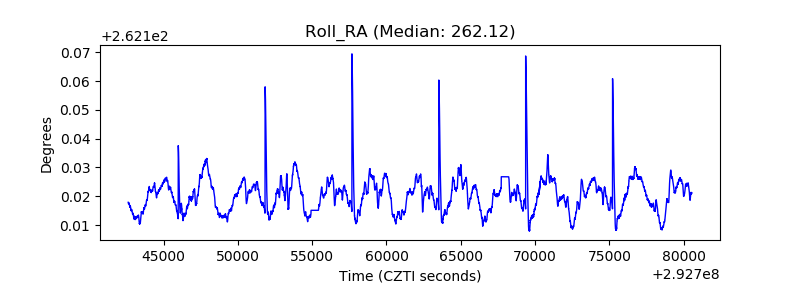 |
| Veto Counter | 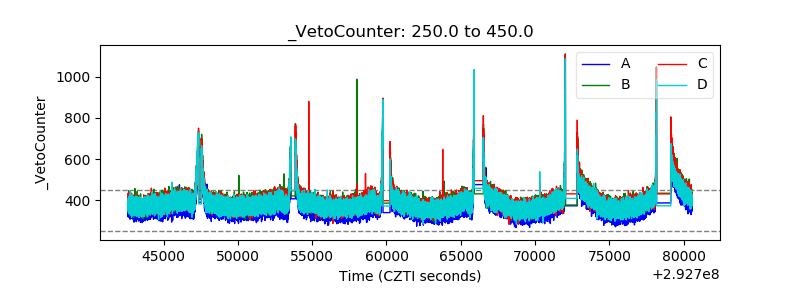 |