| Param | Original file | Final file |
|---|---|---|
| Filename | modeM0/AS1A05_046T01_9000002838_19134cztM0_level2.evt | modeM0/AS1A05_046T01_9000002838_19134cztM0_level2_quad_clean.evt |
| Size (bytes) | 512,844,480 | 104,947,200 |
| Size | 489.1 MB | 100.1 MB |
| Events in quadrant A | 3,475,110 | 679,480 |
| Events in quadrant B | 3,710,817 | 705,971 |
| Events in quadrant C | 3,561,390 | 676,963 |
| Events in quadrant D | 4,325,955 | 645,037 |
| Mode M0 | |||
|---|---|---|---|
| Quadrant | BADHDUFLAG | Total packets | Discarded packets |
| A | 0 | 14575 | 3 |
| B | 0 | 15285 | 2 |
| C | 0 | 14726 | 2 |
| D | 0 | 17313 | 2 |
| Mode SS | |||
|---|---|---|---|
| Quadrant | BADHDUFLAG | Total packets | Discarded packets |
| A | 0 | 138 | 0 |
| B | 0 | 138 | 0 |
| C | 0 | 138 | 0 |
| D | 0 | 138 | 0 |
| Mode M9 | |||
|---|---|---|---|
| Quadrant | BADHDUFLAG | Total packets | Discarded packets |
| A | 0 | 25 | 0 |
| B | 0 | 25 | 0 |
| C | 0 | 25 | 0 |
| D | 0 | 25 | 0 |
| Quadrant | Total seconds | Saturated seconds | Saturation percentage |
|---|---|---|---|
| A | 6760 | 84 | 1.242604% |
| B | 6761 | 122 | 1.804467% |
| C | 6761 | 103 | 1.523443% |
| D | 6761 | 107 | 1.582606% |
Noise dominated data is calculated using 1-second bins in cleaned event files. If a bin has >2000 counts, and if more than 50% of those come from <1% of pixels, then it is considered to be noise-dominated and hence unusable.
| Quadrant | # 1 sec bins | Bins with >0 counts | Bins with >2000 counts | High rate bins dominated by noise | Noise dominated (total time) | Noise dominated (detector-on time) | Marked lightcurve |
|---|---|---|---|---|---|---|---|
| A | 9245 | 6762 | 0 | 0 | 0.00% | 0.00% | 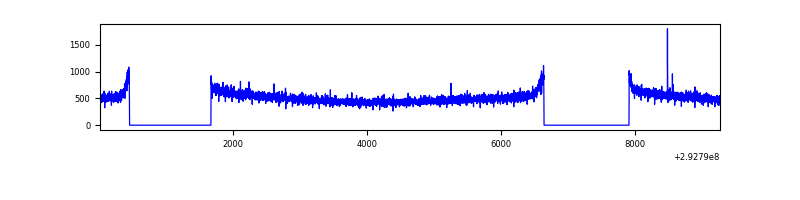 |
| B | 9246 | 6763 | 6 | 6 | 0.06% | 0.09% | 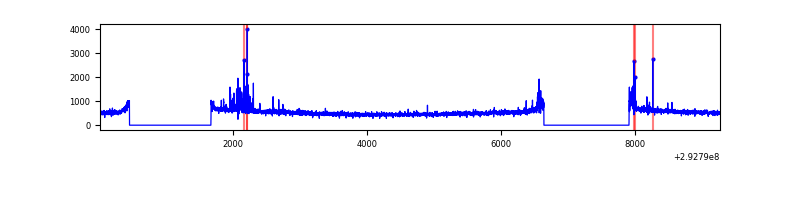 |
| C | 9246 | 6763 | 0 | 0 | 0.00% | 0.00% | 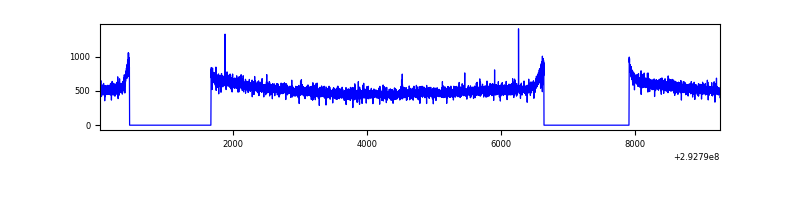 |
| D | 9246 | 6763 | 41 | 41 | 0.44% | 0.61% | 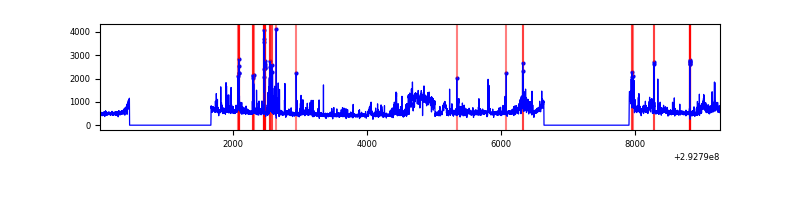 |
Top three noisy pixels from each quadrant. If the there are fewer than three noisy pixels in the level2.evt file, extra rows are filled as -1
| Pixel properties | Quadrant properties | ||||||
|---|---|---|---|---|---|---|---|
| Quadrant | DetID | PixID | Counts | Sigma | Mean | Median | Sigma |
| A | 13 | 254 | 8390 | 41.5 | 901 | 883 | 180.9 |
| A | 0 | 226 | 7911 | 38.85 | 901 | 883 | 180.9 |
| A | 3 | 137 | 6694 | 32.12 | 901 | 883 | 180.9 |
| B | 7 | 220 | 66833 | 383.51 | 908 | 889 | 171.9 |
| B | 0 | 197 | 30817 | 174.05 | 908 | 889 | 171.9 |
| B | 10 | 245 | 23933 | 134.02 | 908 | 889 | 171.9 |
| C | 14 | 238 | 137624 | 668.93 | 876 | 884 | 204.4 |
| C | 13 | 61 | 6239 | 26.2 | 876 | 884 | 204.4 |
| C | 0 | 207 | 5362 | 21.91 | 876 | 884 | 204.4 |
| D | 1 | 20 | 602416 | 2865.14 | 875 | 854 | 210.0 |
| D | 11 | 176 | 208252 | 987.8 | 875 | 854 | 210.0 |
| D | 1 | 52 | 186449 | 883.96 | 875 | 854 | 210.0 |
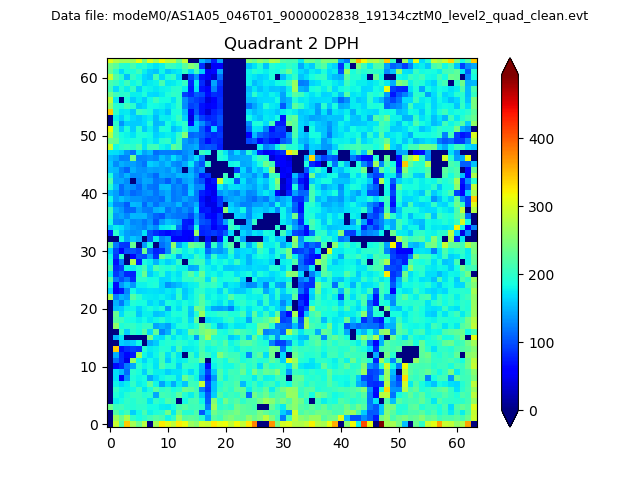
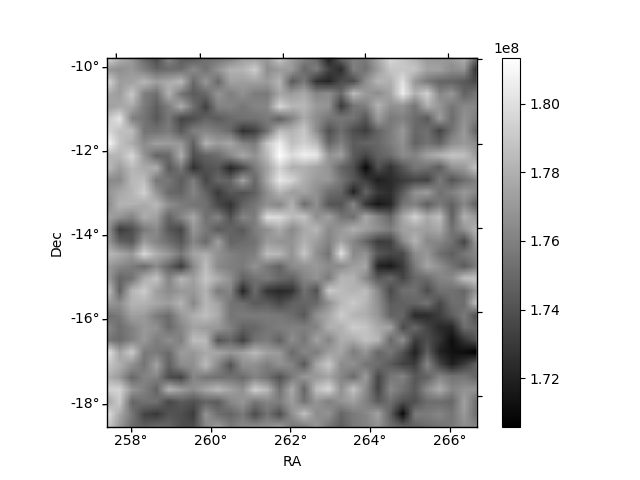
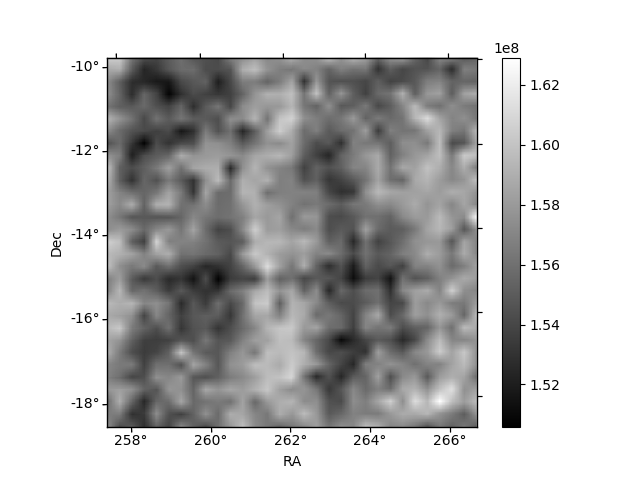
Histogram calculated using DETX and DETY for each event in the final _common_clean file
| Quadrant A | 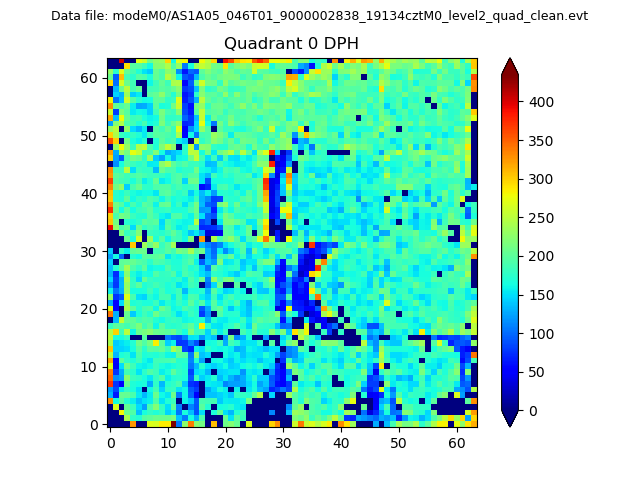 |
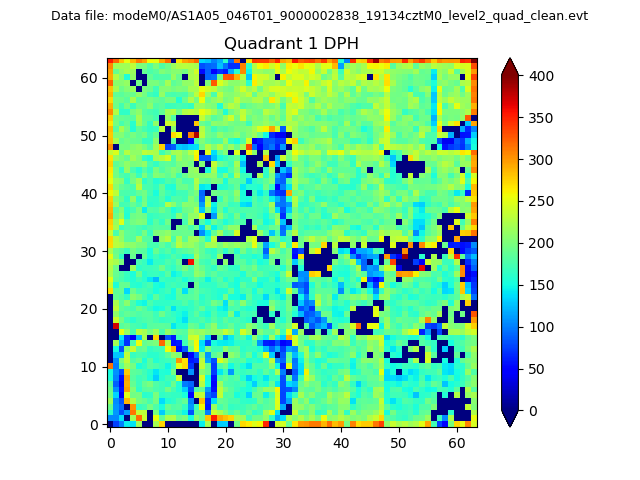 |
Quadrant B |
|---|---|---|---|
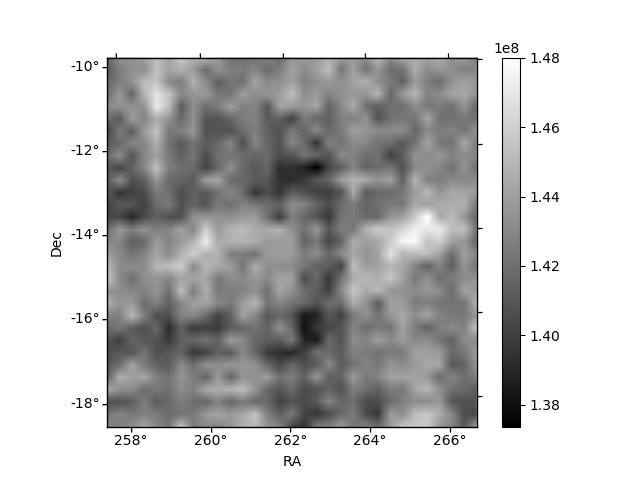
| Quadrant D | 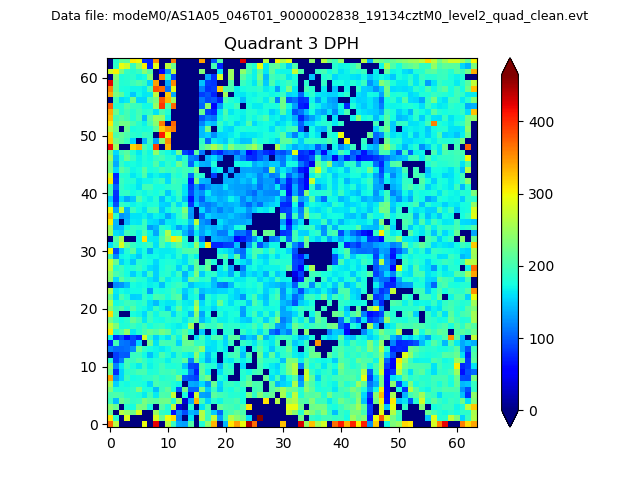 |
 |
Quadrant C |
| Plot type | Count rate plots | Images |
|---|---|---|
| Comparison with Poisson distribution Blue bars denote a histogram of data divided into 1 sec bins. Red curve is a Poisson curve with rate = median count rate of data. |
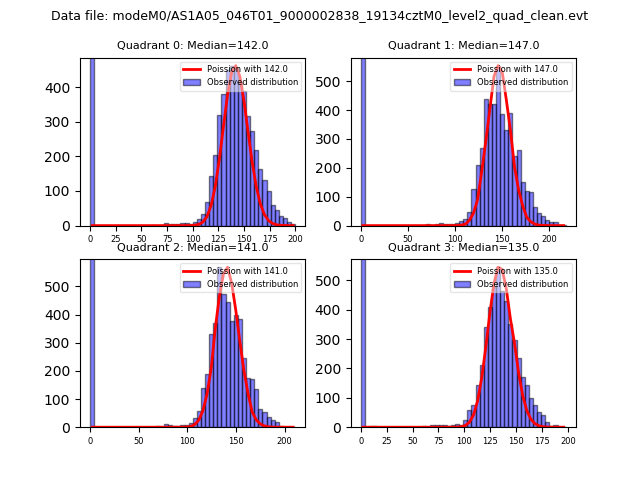 |
 |
| Quadrant-wise count rates Data is divided into 100 sec bins |
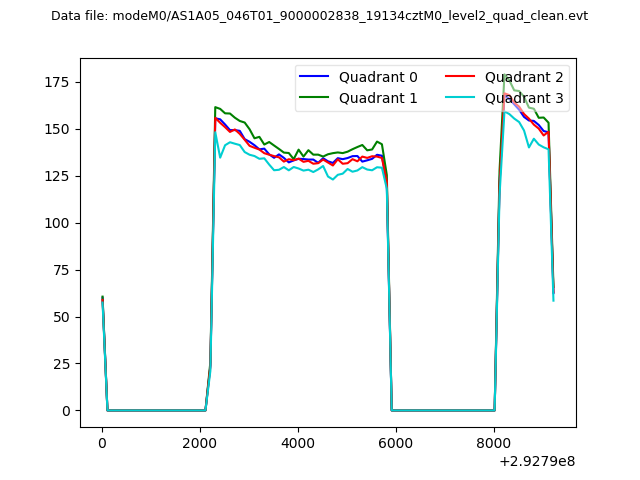 |
|
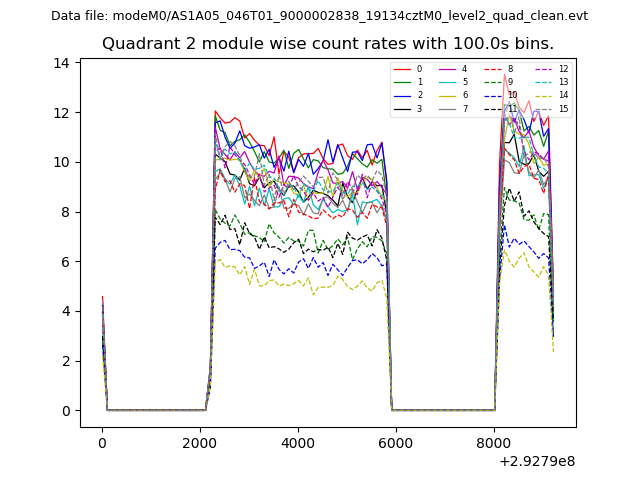
| Module-wise count rates for Quadrant A Data is divided into 100 sec bins |
 |
 |
| Module-wise count rates for Quadrant B Data is divided into 100 sec bins |
 |
 |
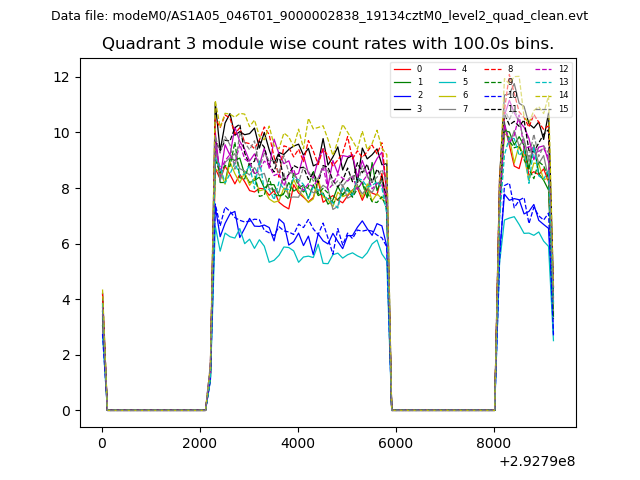
| Module-wise count rates for Quadrant C Data is divided into 100 sec bins |
 |
 |
| Module-wise count rates for Quadrant D Data is divided into 100 sec bins |
 |
 |
| Parameter | Plot |
|---|---|
| CZT HV Monitor |  |
| D_VDD | 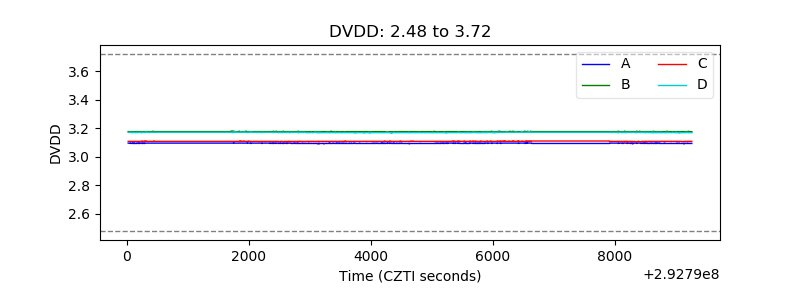 |
| Temperature 1 | 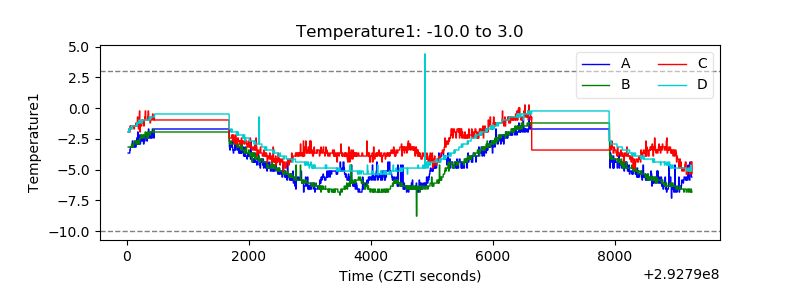 |
| Veto HV Monitor |  |
| Veto LLD | 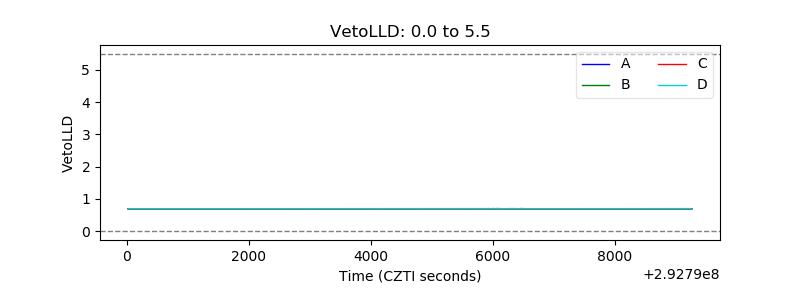 |
| Alpha Counter | 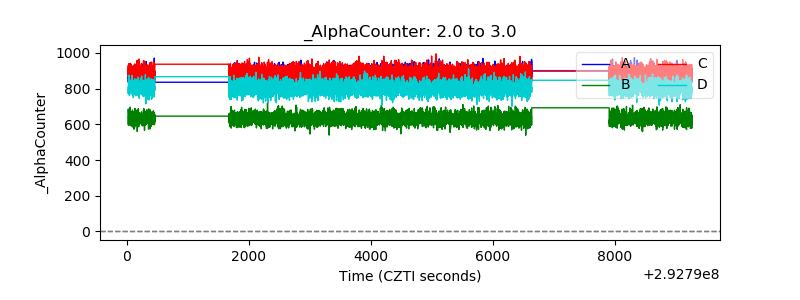 |
| _CPM_Rate | 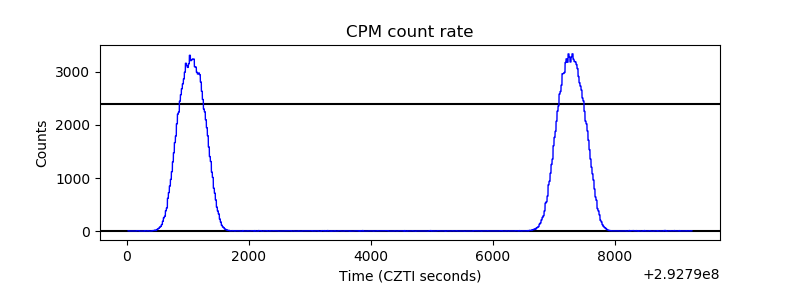 |
| CZT Counter | 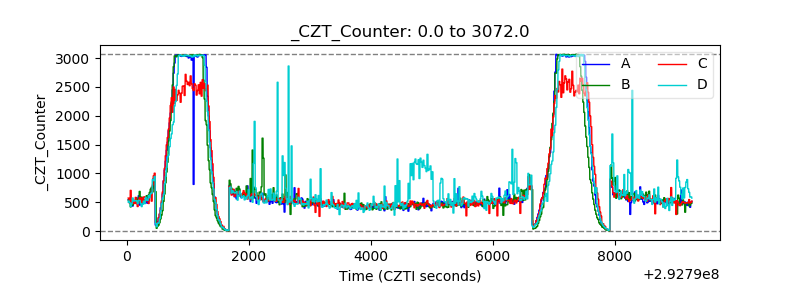 |
| +2.5 Volts monitor | 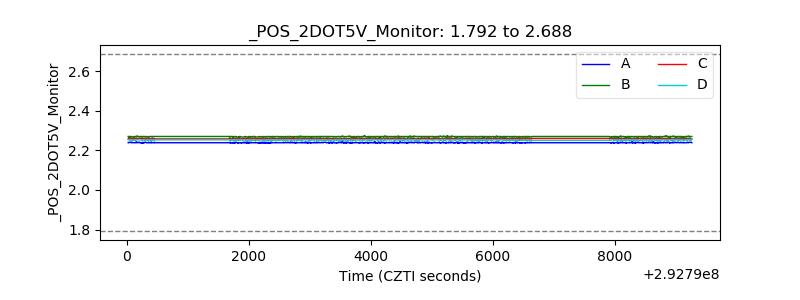 |
| +5 Volts monitor |  |
| _ROLL_ROT |  |
| _Roll_DEC | 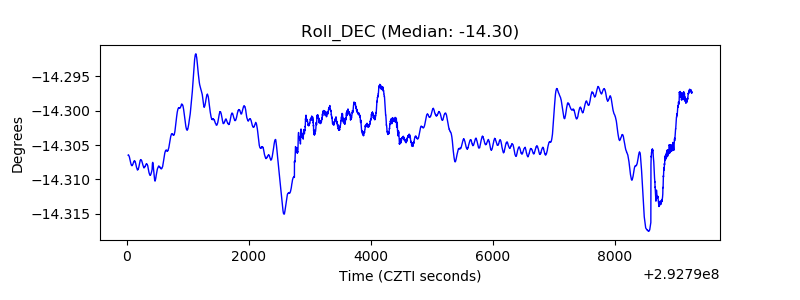 |
| _Roll_RA | 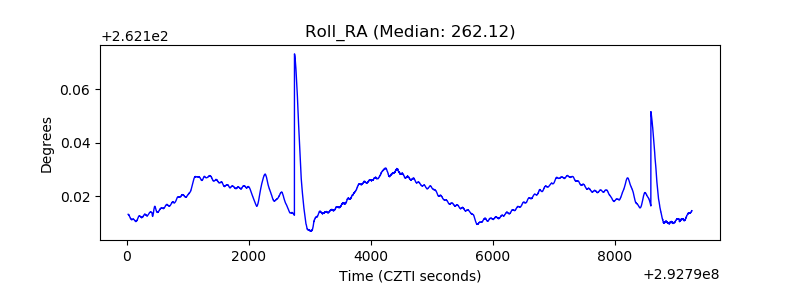 |
| Veto Counter |  |