| Param | Original file | Final file |
|---|---|---|
| Filename | modeM0/AS1A05_046T01_9000002838_19135cztM0_level2.evt | modeM0/AS1A05_046T01_9000002838_19135cztM0_level2_quad_clean.evt |
| Size (bytes) | 477,374,400 | 108,388,800 |
| Size | 455.3 MB | 103.4 MB |
| Events in quadrant A | 3,153,547 | 715,375 |
| Events in quadrant B | 3,380,589 | 743,361 |
| Events in quadrant C | 3,257,645 | 714,939 |
| Events in quadrant D | 4,242,965 | 674,483 |
| Mode M0 | |||
|---|---|---|---|
| Quadrant | BADHDUFLAG | Total packets | Discarded packets |
| A | 0 | 13228 | 2 |
| B | 0 | 13869 | 2 |
| C | 0 | 13463 | 2 |
| D | 0 | 16653 | 2 |
| Mode SS | |||
|---|---|---|---|
| Quadrant | BADHDUFLAG | Total packets | Discarded packets |
| A | 0 | 126 | 0 |
| B | 0 | 126 | 0 |
| C | 0 | 126 | 0 |
| D | 0 | 126 | 0 |
| Mode M9 | |||
|---|---|---|---|
| Quadrant | BADHDUFLAG | Total packets | Discarded packets |
| A | 0 | 23 | 0 |
| B | 0 | 24 | 0 |
| C | 0 | 24 | 0 |
| D | 0 | 24 | 0 |
| Quadrant | Total seconds | Saturated seconds | Saturation percentage |
|---|---|---|---|
| A | 6227 | 46 | 0.738718% |
| B | 6227 | 96 | 1.541673% |
| C | 6227 | 83 | 1.332905% |
| D | 6227 | 241 | 3.870242% |
Noise dominated data is calculated using 1-second bins in cleaned event files. If a bin has >2000 counts, and if more than 50% of those come from <1% of pixels, then it is considered to be noise-dominated and hence unusable.
| Quadrant | # 1 sec bins | Bins with >0 counts | Bins with >2000 counts | High rate bins dominated by noise | Noise dominated (total time) | Noise dominated (detector-on time) | Marked lightcurve |
|---|---|---|---|---|---|---|---|
| A | 7537 | 6228 | 0 | 0 | 0.00% | 0.00% | 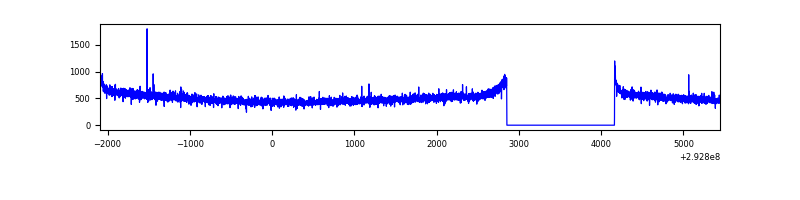 |
| B | 7537 | 6228 | 3 | 3 | 0.04% | 0.05% | 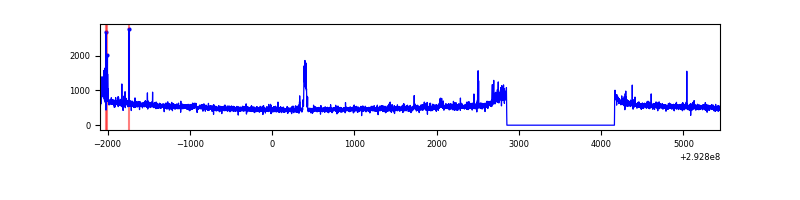 |
| C | 7537 | 6228 | 0 | 0 | 0.00% | 0.00% | 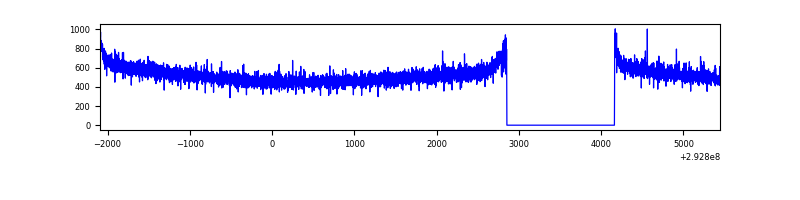 |
| D | 7537 | 6228 | 124 | 124 | 1.65% | 1.99% | 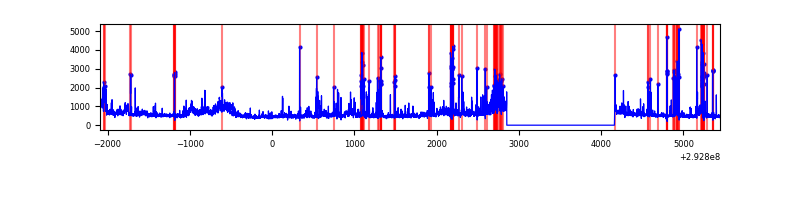 |
Top three noisy pixels from each quadrant. If the there are fewer than three noisy pixels in the level2.evt file, extra rows are filled as -1
| Pixel properties | Quadrant properties | ||||||
|---|---|---|---|---|---|---|---|
| Quadrant | DetID | PixID | Counts | Sigma | Mean | Median | Sigma |
| A | 0 | 226 | 7059 | 38.42 | 817 | 802 | 162.9 |
| A | 13 | 254 | 6102 | 32.54 | 817 | 802 | 162.9 |
| A | 3 | 137 | 5887 | 31.22 | 817 | 802 | 162.9 |
| B | 3 | 112 | 45056 | 283.84 | 829 | 809 | 155.9 |
| B | 7 | 220 | 37008 | 232.21 | 829 | 809 | 155.9 |
| B | 0 | 197 | 25958 | 161.33 | 829 | 809 | 155.9 |
| C | 14 | 238 | 125900 | 671.53 | 802 | 812 | 186.3 |
| C | 13 | 61 | 5753 | 26.53 | 802 | 812 | 186.3 |
| C | 0 | 207 | 2793 | 10.63 | 802 | 812 | 186.3 |
| D | 1 | 52 | 720771 | 3785.91 | 789 | 768 | 190.2 |
| D | 1 | 20 | 481073 | 2525.53 | 789 | 768 | 190.2 |
| D | 11 | 176 | 38111 | 196.36 | 789 | 768 | 190.2 |
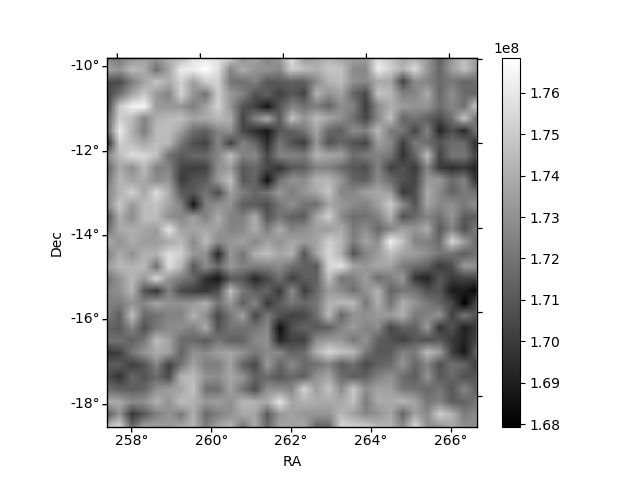
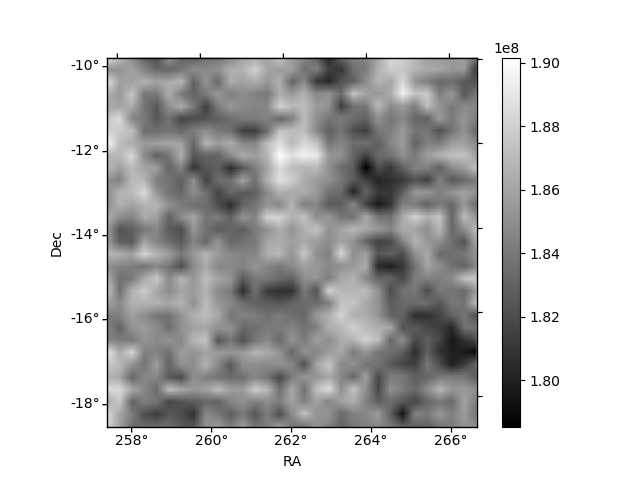
Histogram calculated using DETX and DETY for each event in the final _common_clean file
| Quadrant A | 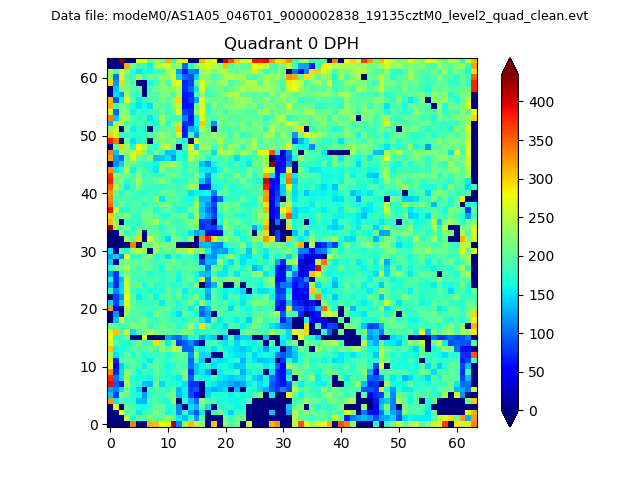 |
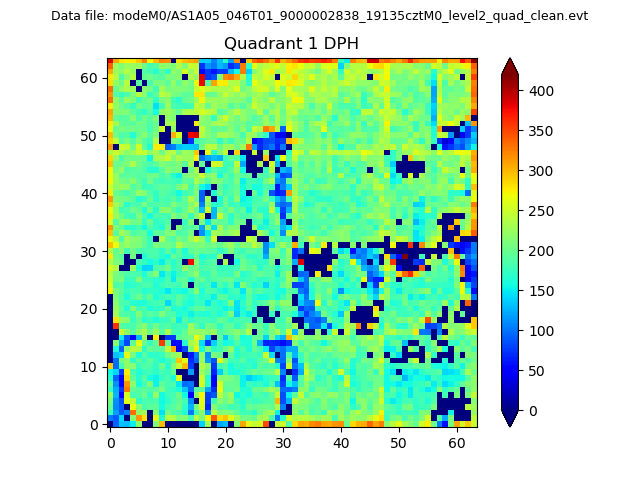 |
Quadrant B |
|---|---|---|---|
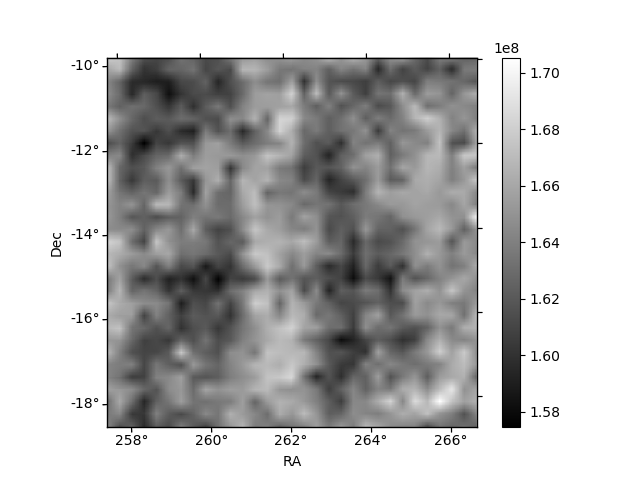
| Quadrant D | 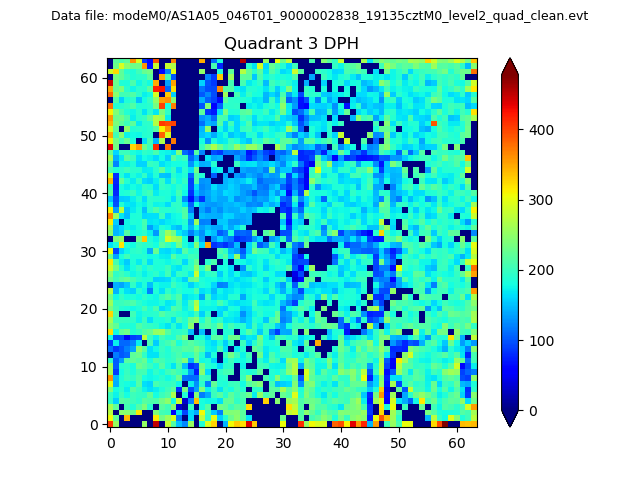 |
 |
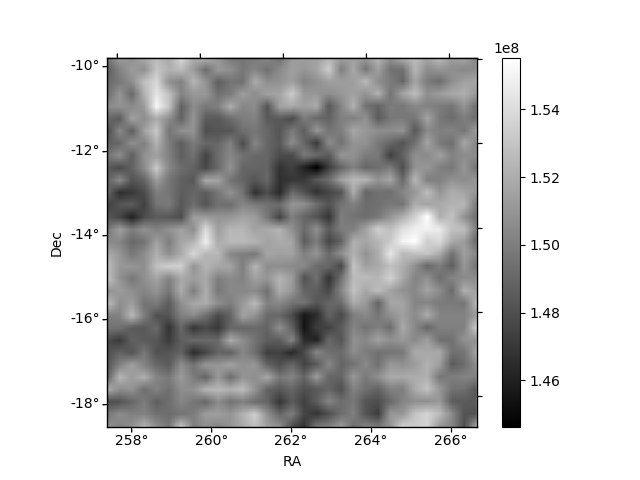
Quadrant C |
| Plot type | Count rate plots | Images |
|---|---|---|
| Comparison with Poisson distribution Blue bars denote a histogram of data divided into 1 sec bins. Red curve is a Poisson curve with rate = median count rate of data. |
 |
 |
| Quadrant-wise count rates Data is divided into 100 sec bins |
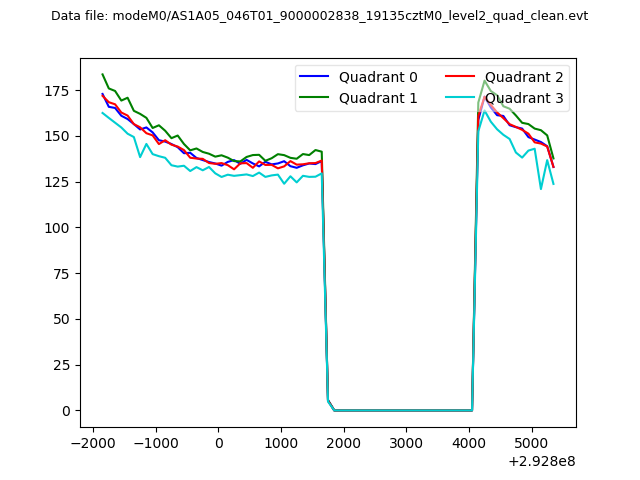 |
|
| Module-wise count rates for Quadrant A Data is divided into 100 sec bins |
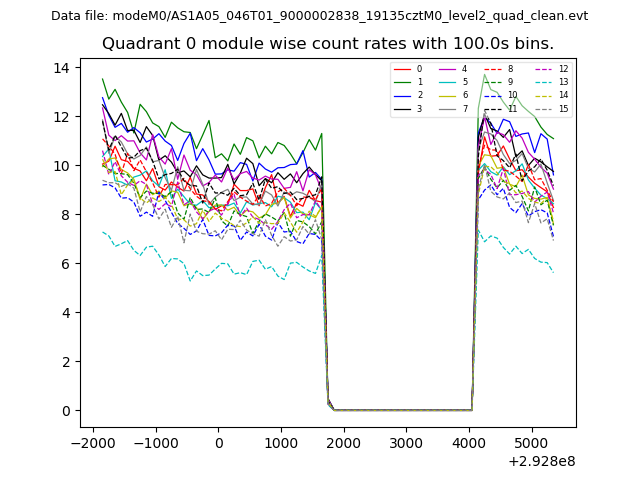 |
 |
| Module-wise count rates for Quadrant B Data is divided into 100 sec bins |
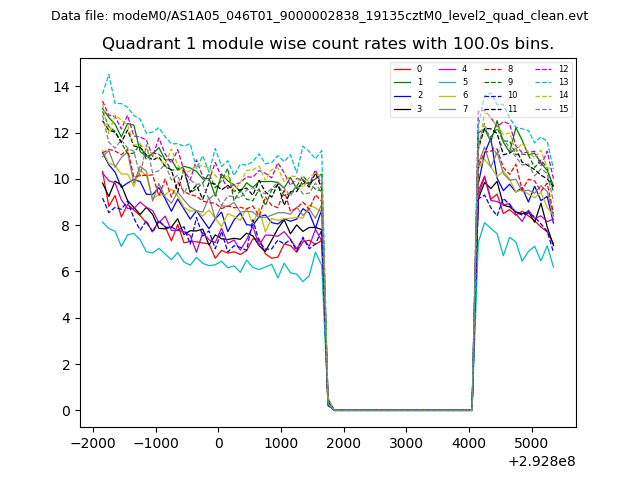 |
 |
| Module-wise count rates for Quadrant C Data is divided into 100 sec bins |
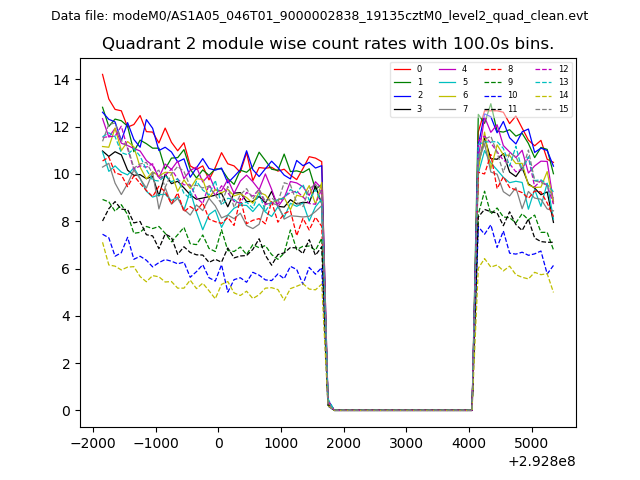 |
 |
| Module-wise count rates for Quadrant D Data is divided into 100 sec bins |
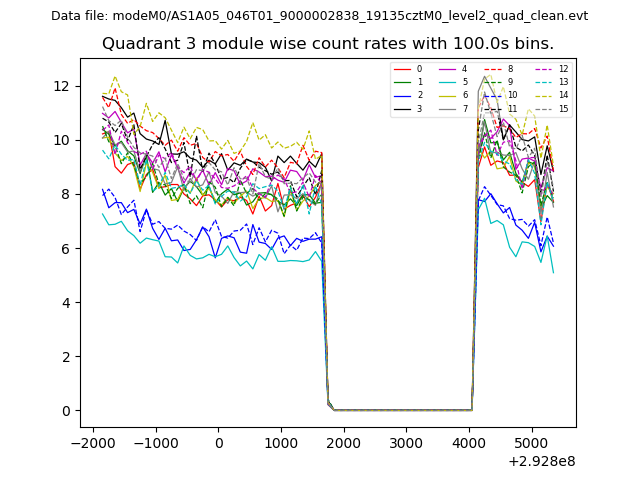 |
 |
| Parameter | Plot |
|---|---|
| CZT HV Monitor | 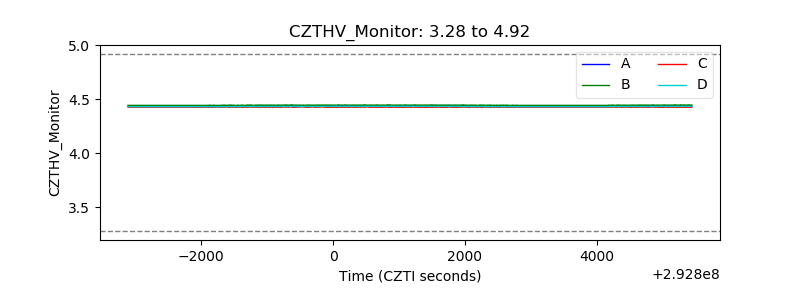 |
| D_VDD | 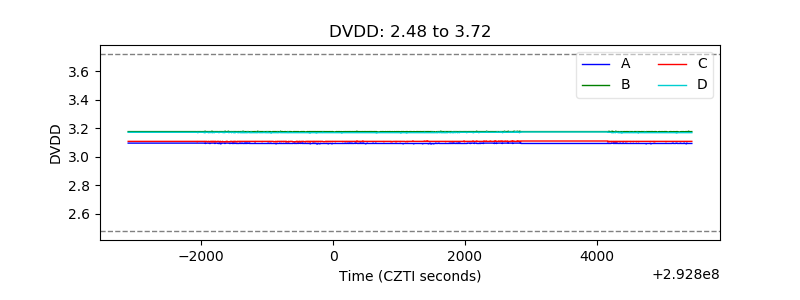 |
| Temperature 1 | 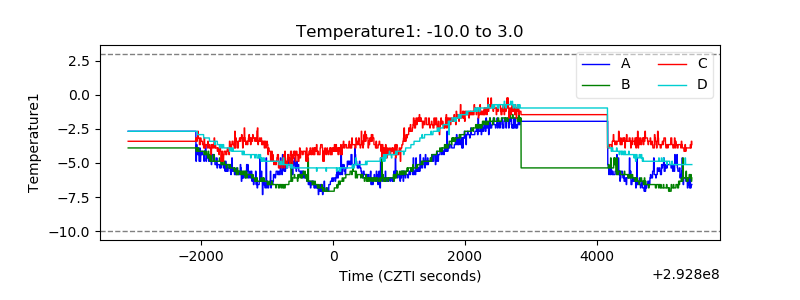 |
| Veto HV Monitor | 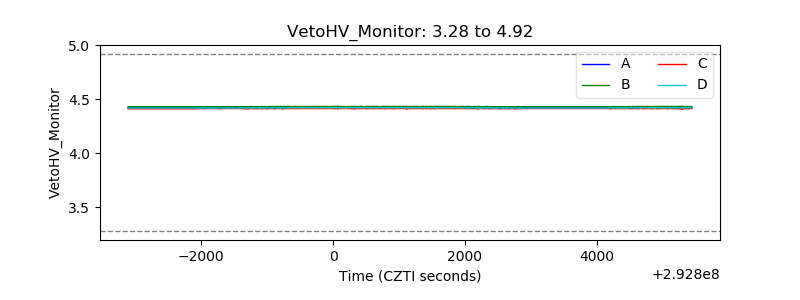 |
| Veto LLD | 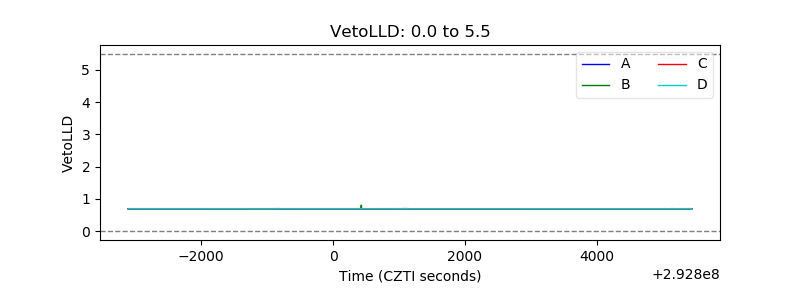 |
| Alpha Counter | 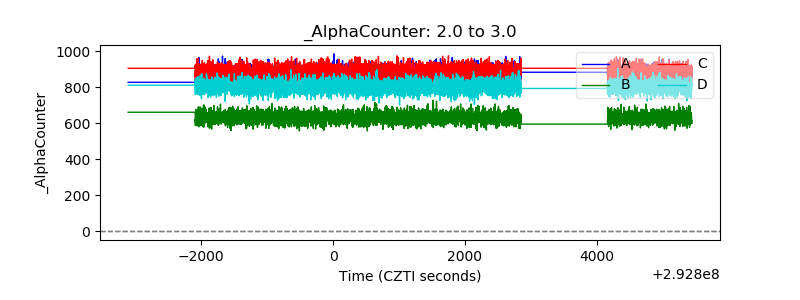 |
| _CPM_Rate | 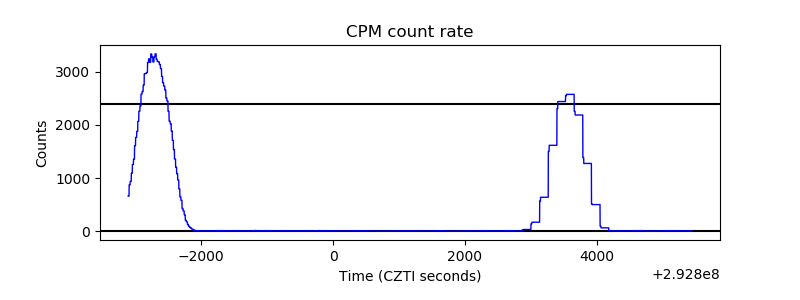 |
| CZT Counter |  |
| +2.5 Volts monitor |  |
| +5 Volts monitor |  |
| _ROLL_ROT |  |
| _Roll_DEC | 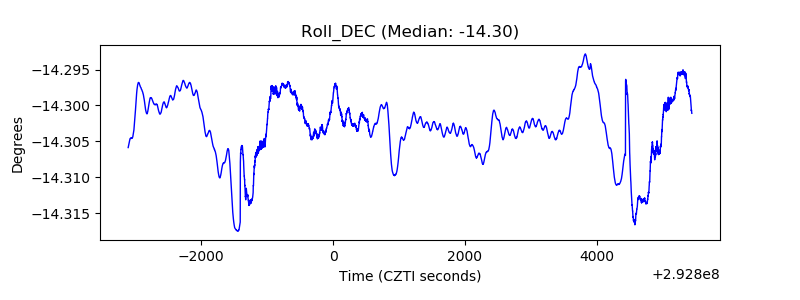 |
| _Roll_RA |  |
| Veto Counter | 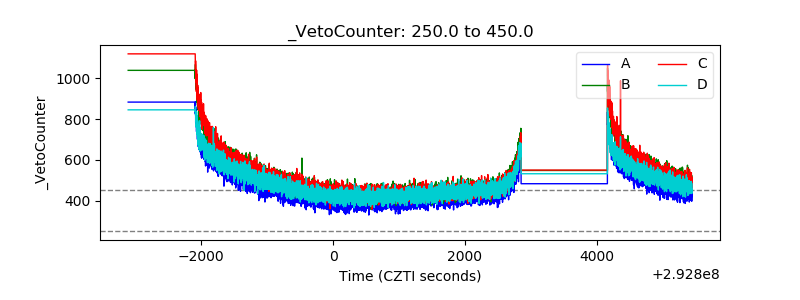 |