| Param | Original file | Final file |
|---|---|---|
| Filename | modeM0/AS1A05_046T01_9000002838_19137cztM0_level2.evt | modeM0/AS1A05_046T01_9000002838_19137cztM0_level2_quad_clean.evt |
| Size (bytes) | 450,135,360 | 94,743,360 |
| Size | 429.3 MB | 90.4 MB |
| Events in quadrant A | 3,155,157 | 602,548 |
| Events in quadrant B | 3,335,955 | 623,721 |
| Events in quadrant C | 3,244,073 | 603,048 |
| Events in quadrant D | 3,452,521 | 583,616 |
| Mode M0 | |||
|---|---|---|---|
| Quadrant | BADHDUFLAG | Total packets | Discarded packets |
| A | 0 | 13600 | 2 |
| B | 0 | 14065 | 2 |
| C | 0 | 13651 | 2 |
| D | 0 | 14700 | 2 |
| Mode SS | |||
|---|---|---|---|
| Quadrant | BADHDUFLAG | Total packets | Discarded packets |
| A | 0 | 132 | 0 |
| B | 0 | 132 | 0 |
| C | 0 | 132 | 0 |
| D | 0 | 132 | 0 |
| Mode M9 | |||
|---|---|---|---|
| Quadrant | BADHDUFLAG | Total packets | Discarded packets |
| A | 0 | 17 | 0 |
| B | 0 | 18 | 0 |
| C | 0 | 18 | 0 |
| D | 0 | 18 | 0 |
| Quadrant | Total seconds | Saturated seconds | Saturation percentage |
|---|---|---|---|
| A | 6546 | 45 | 0.687443% |
| B | 6546 | 83 | 1.267950% |
| C | 6546 | 77 | 1.176291% |
| D | 6546 | 66 | 1.008249% |
Noise dominated data is calculated using 1-second bins in cleaned event files. If a bin has >2000 counts, and if more than 50% of those come from <1% of pixels, then it is considered to be noise-dominated and hence unusable.
| Quadrant | # 1 sec bins | Bins with >0 counts | Bins with >2000 counts | High rate bins dominated by noise | Noise dominated (total time) | Noise dominated (detector-on time) | Marked lightcurve |
|---|---|---|---|---|---|---|---|
| A | 7626 | 6547 | 0 | 0 | 0.00% | 0.00% | 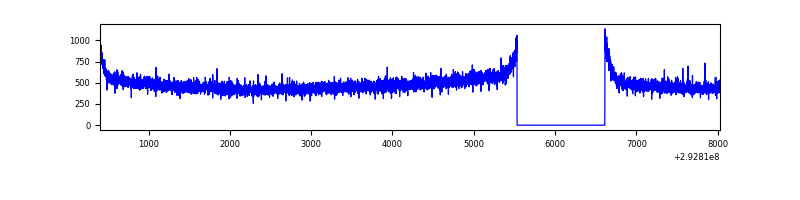 |
| B | 7626 | 6547 | 6 | 6 | 0.08% | 0.09% | 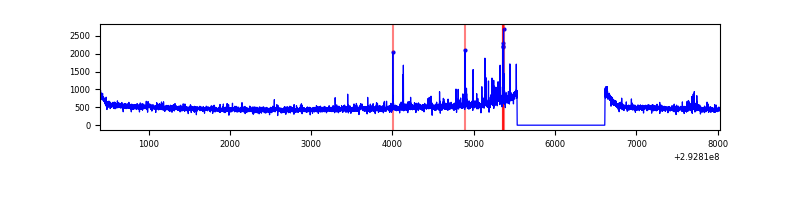 |
| C | 7626 | 6547 | 0 | 0 | 0.00% | 0.00% | 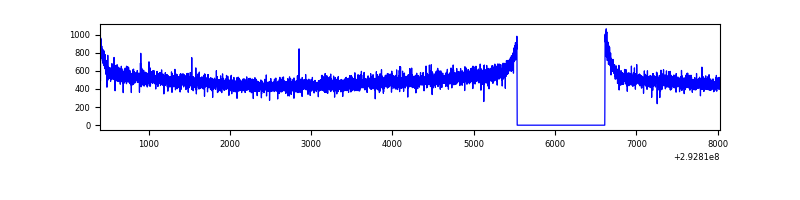 |
| D | 7626 | 6547 | 37 | 37 | 0.49% | 0.57% | 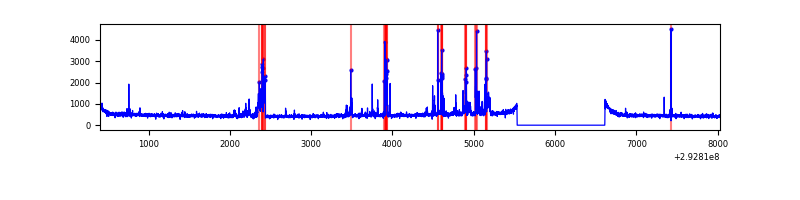 |
Top three noisy pixels from each quadrant. If the there are fewer than three noisy pixels in the level2.evt file, extra rows are filled as -1
| Pixel properties | Quadrant properties | ||||||
|---|---|---|---|---|---|---|---|
| Quadrant | DetID | PixID | Counts | Sigma | Mean | Median | Sigma |
| A | 11 | 47 | 8836 | 48.78 | 816 | 799 | 164.8 |
| A | 0 | 226 | 7182 | 38.74 | 816 | 799 | 164.8 |
| A | 13 | 254 | 6225 | 32.93 | 816 | 799 | 164.8 |
| B | 7 | 220 | 65966 | 413.64 | 822 | 803 | 157.5 |
| B | 3 | 112 | 27900 | 172.0 | 822 | 803 | 157.5 |
| B | 12 | 111 | 18427 | 111.87 | 822 | 803 | 157.5 |
| C | 14 | 238 | 123604 | 654.45 | 799 | 806 | 187.6 |
| C | 7 | 220 | 8531 | 41.17 | 799 | 806 | 187.6 |
| C | 13 | 61 | 5508 | 25.06 | 799 | 806 | 187.6 |
| D | 1 | 52 | 165122 | 846.4 | 800 | 777 | 194.2 |
| D | 11 | 176 | 136642 | 699.72 | 800 | 777 | 194.2 |
| D | 10 | 199 | 107935 | 551.87 | 800 | 777 | 194.2 |
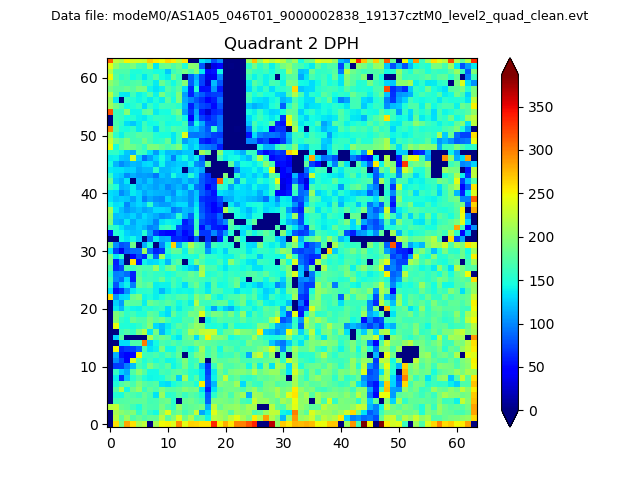
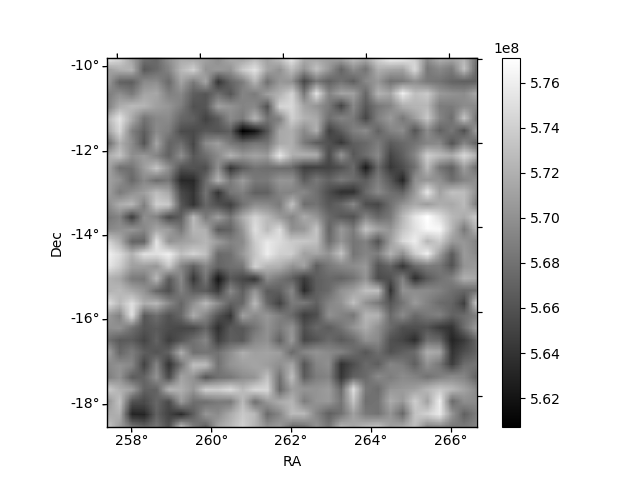
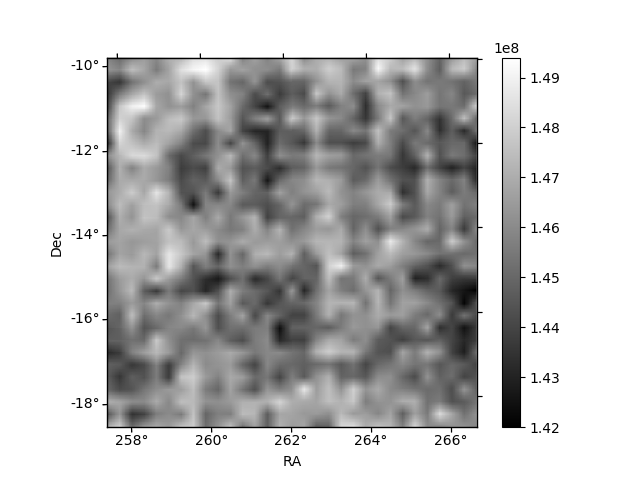
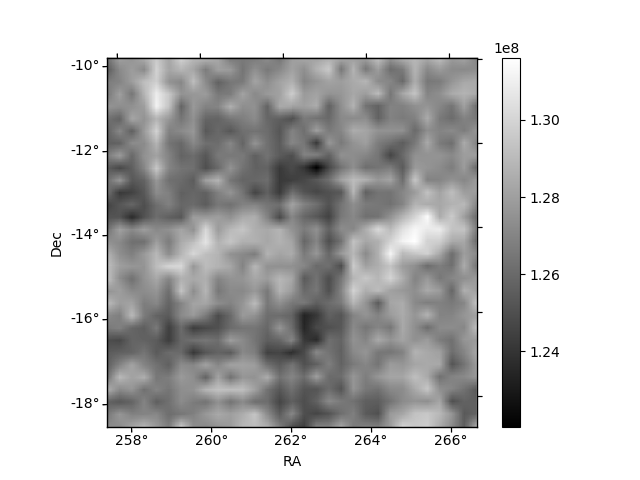
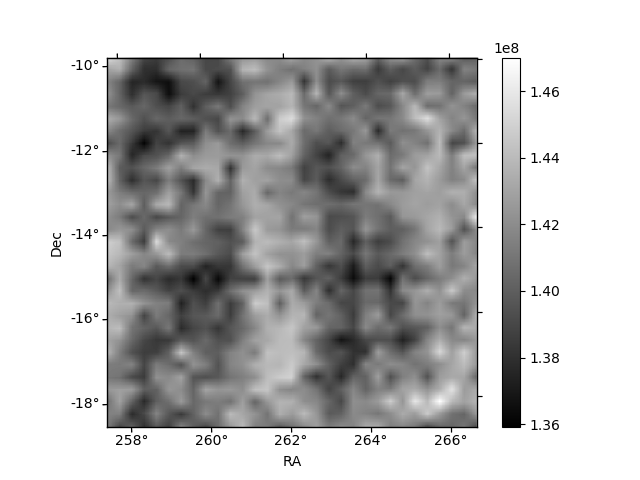
Histogram calculated using DETX and DETY for each event in the final _common_clean file
| Quadrant A | 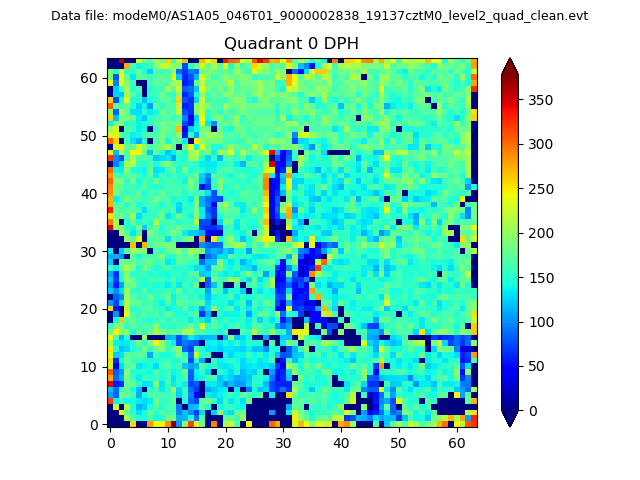 |
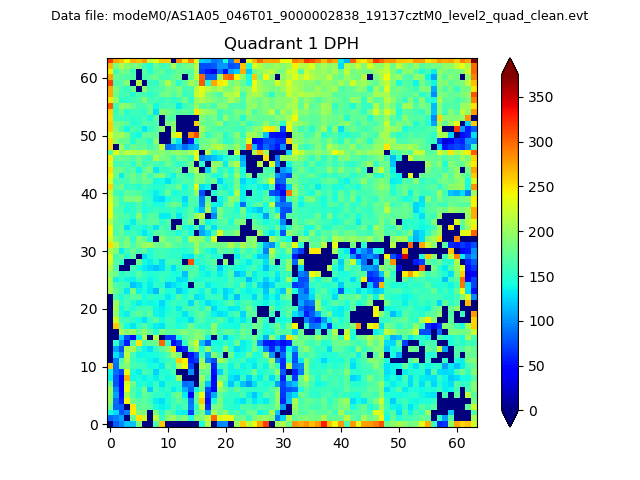 |
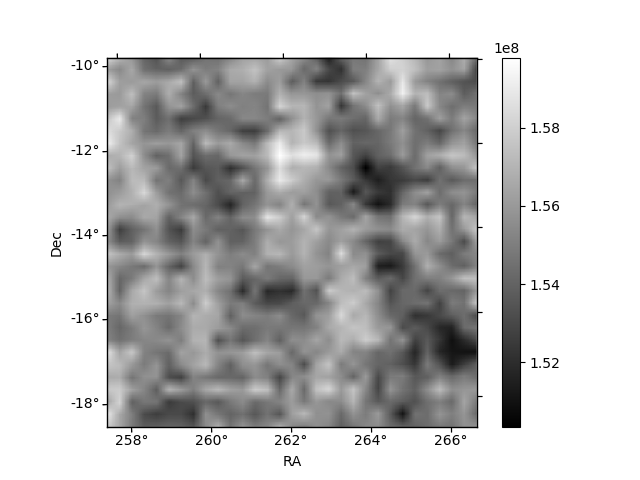
Quadrant B |
|---|---|---|---|
| Quadrant D | 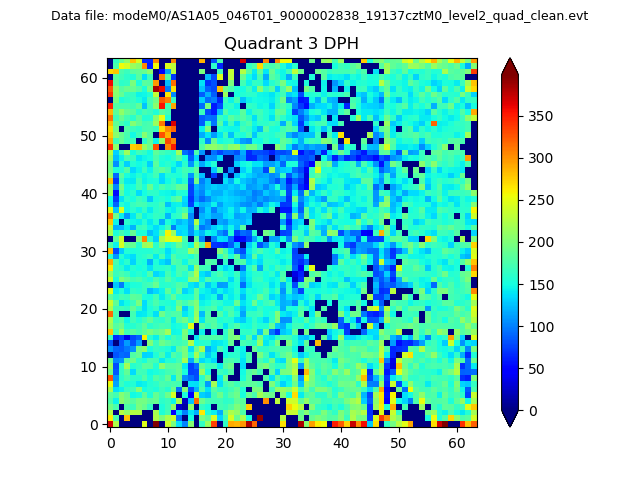 |
 |
Quadrant C |
| Plot type | Count rate plots | Images |
|---|---|---|
| Comparison with Poisson distribution Blue bars denote a histogram of data divided into 1 sec bins. Red curve is a Poisson curve with rate = median count rate of data. |
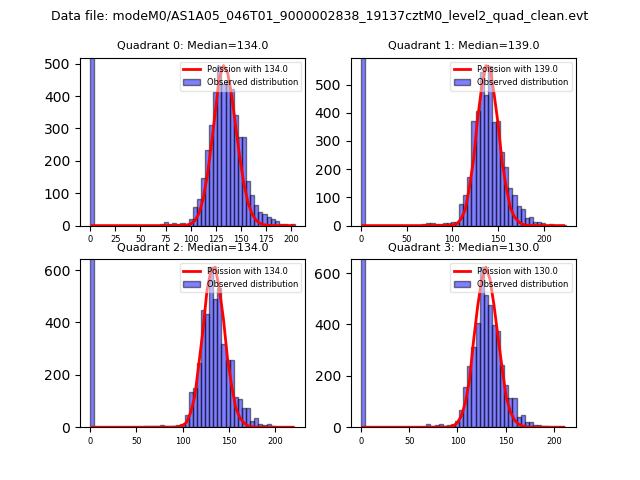 |
 |
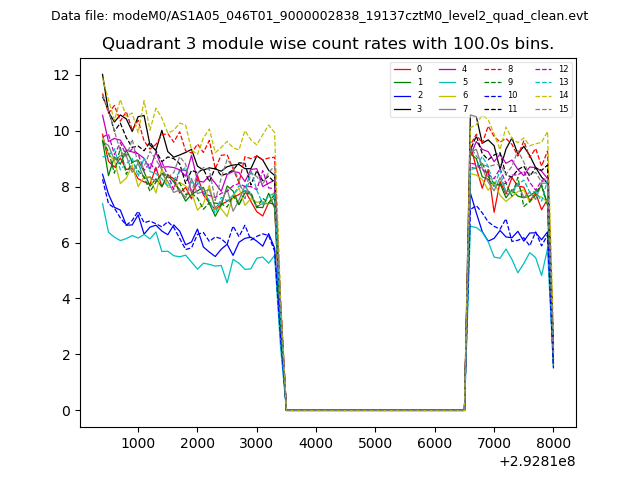
| Quadrant-wise count rates Data is divided into 100 sec bins |
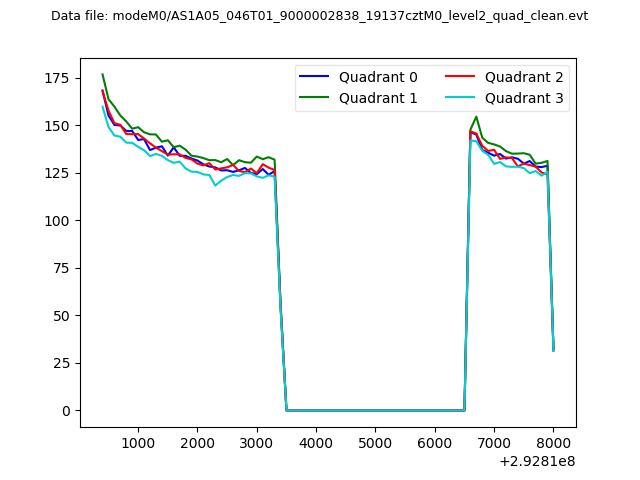 |
|
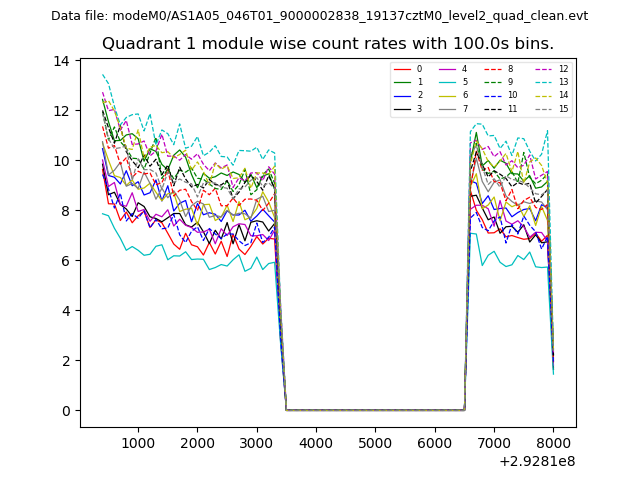
| Module-wise count rates for Quadrant A Data is divided into 100 sec bins |
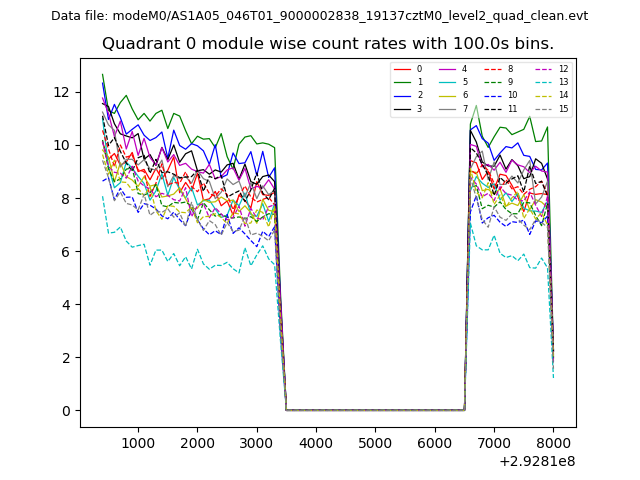 |
 |
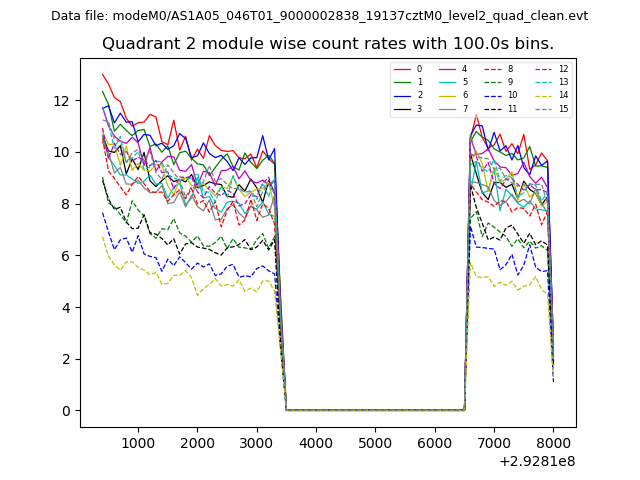
| Module-wise count rates for Quadrant B Data is divided into 100 sec bins |
 |
 |
| Module-wise count rates for Quadrant C Data is divided into 100 sec bins |
 |
 |
| Module-wise count rates for Quadrant D Data is divided into 100 sec bins |
 |
 |
| Parameter | Plot |
|---|---|
| CZT HV Monitor | 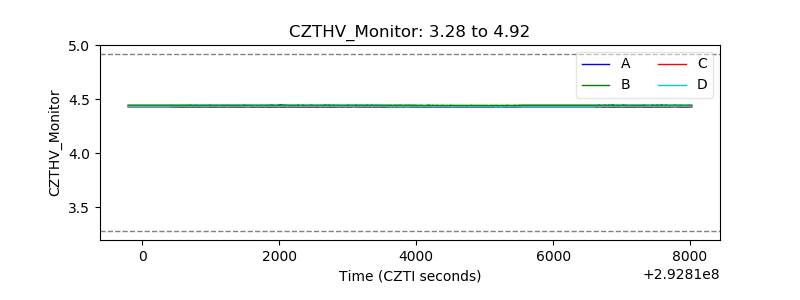 |
| D_VDD | 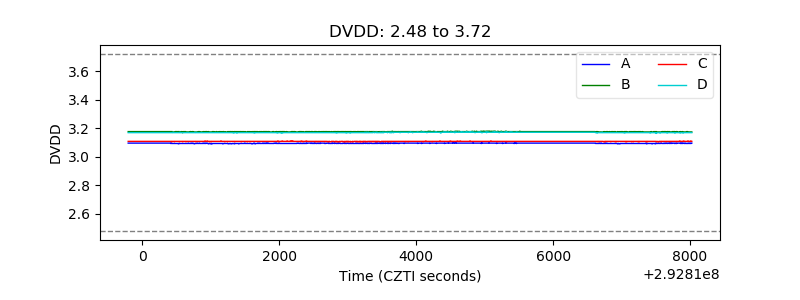 |
| Temperature 1 | 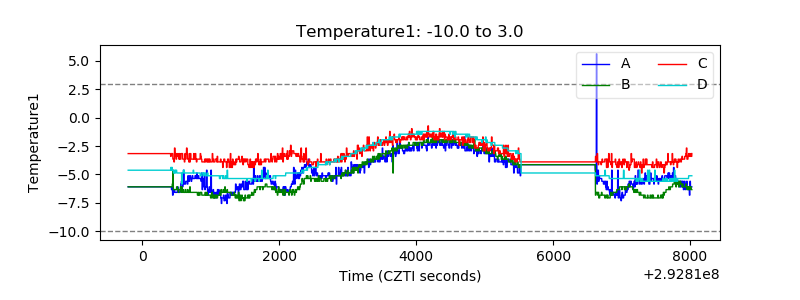 |
| Veto HV Monitor | 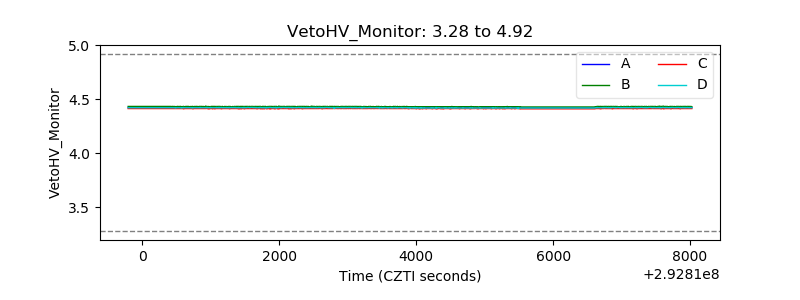 |
| Veto LLD | 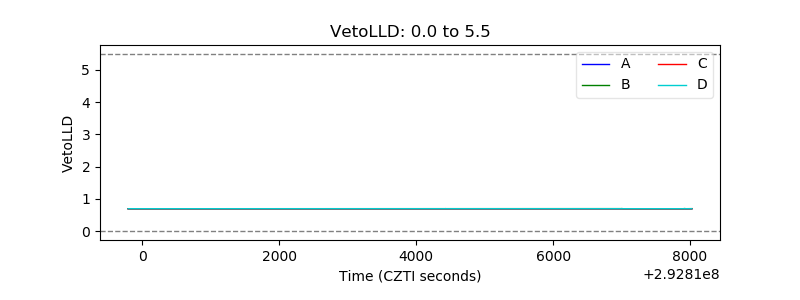 |
| Alpha Counter | 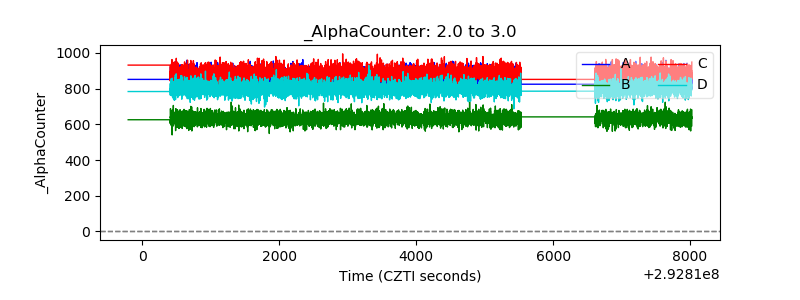 |
| _CPM_Rate | 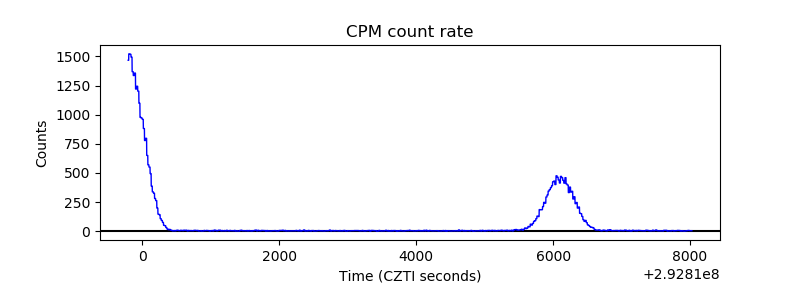 |
| CZT Counter | 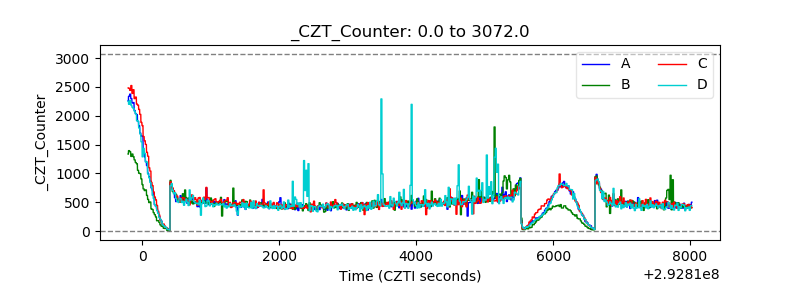 |
| +2.5 Volts monitor |  |
| +5 Volts monitor |  |
| _ROLL_ROT | 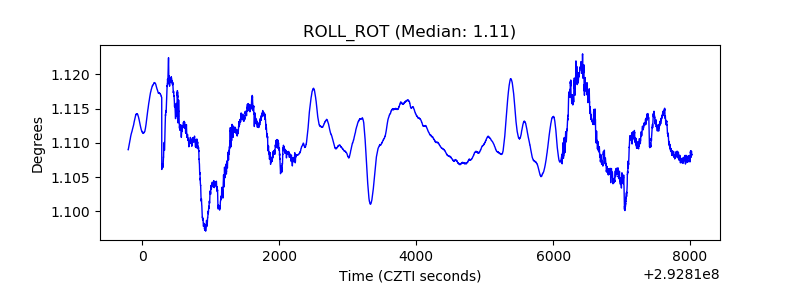 |
| _Roll_DEC | 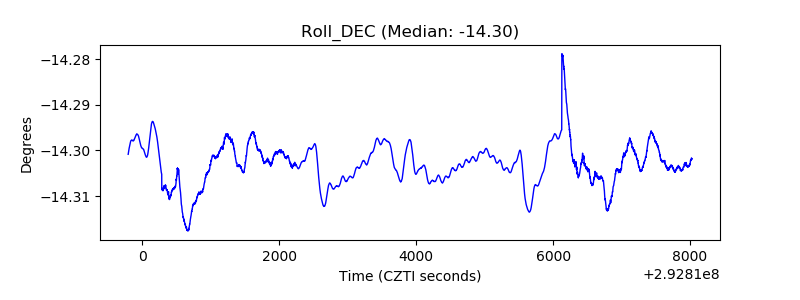 |
| _Roll_RA | 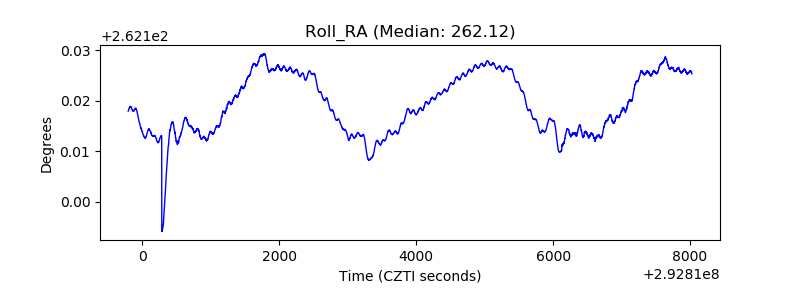 |
| Veto Counter | 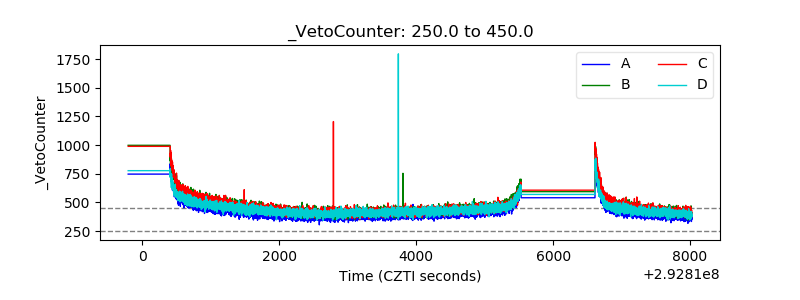 |