| Param | Original file | Final file |
|---|---|---|
| Filename | modeM0/AS1A05_046T01_9000002838_19139cztM0_level2.evt | modeM0/AS1A05_046T01_9000002838_19139cztM0_level2_quad_clean.evt |
| Size (bytes) | 276,033,600 | 46,494,720 |
| Size | 263.2 MB | 44.3 MB |
| Events in quadrant A | 1,765,435 | 284,506 |
| Events in quadrant B | 1,887,594 | 293,647 |
| Events in quadrant C | 1,805,606 | 283,813 |
| Events in quadrant D | 2,634,291 | 270,383 |
| Mode M0 | |||
|---|---|---|---|
| Quadrant | BADHDUFLAG | Total packets | Discarded packets |
| A | 0 | 12741 | 4754 |
| B | 0 | 13437 | 5208 |
| C | 0 | 12921 | 4997 |
| D | 0 | 16818 | 6337 |
| Mode SS | |||
|---|---|---|---|
| Quadrant | BADHDUFLAG | Total packets | Discarded packets |
| A | 0 | 128 | 50 |
| B | 0 | 126 | 50 |
| C | 0 | 127 | 45 |
| D | 0 | 128 | 48 |
| Mode M9 | |||
|---|---|---|---|
| Quadrant | BADHDUFLAG | Total packets | Discarded packets |
| A | 0 | 5 | 2 |
| B | 0 | 5 | 3 |
| C | 0 | 5 | 3 |
| D | 0 | 5 | 2 |
| Quadrant | Total seconds | Saturated seconds | Saturation percentage |
|---|---|---|---|
| A | 3953 | 6 | 0.151783% |
| B | 3912 | 29 | 0.741309% |
| C | 3892 | 28 | 0.719424% |
| D | 3816 | 146 | 3.825996% |
Noise dominated data is calculated using 1-second bins in cleaned event files. If a bin has >2000 counts, and if more than 50% of those come from <1% of pixels, then it is considered to be noise-dominated and hence unusable.
| Quadrant | # 1 sec bins | Bins with >0 counts | Bins with >2000 counts | High rate bins dominated by noise | Noise dominated (total time) | Noise dominated (detector-on time) | Marked lightcurve |
|---|---|---|---|---|---|---|---|
| A | 6185 | 4197 | 0 | 0 | 0.00% | 0.00% | 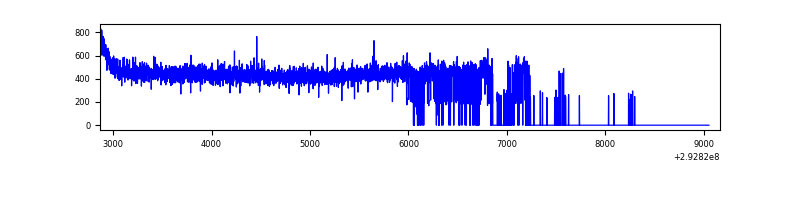 |
| B | 6276 | 4160 | 10 | 10 | 0.16% | 0.24% | 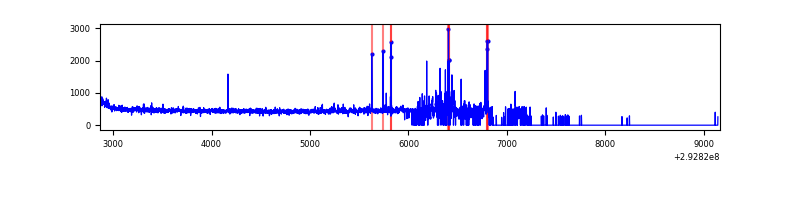 |
| C | 6222 | 4138 | 2 | 2 | 0.03% | 0.05% | 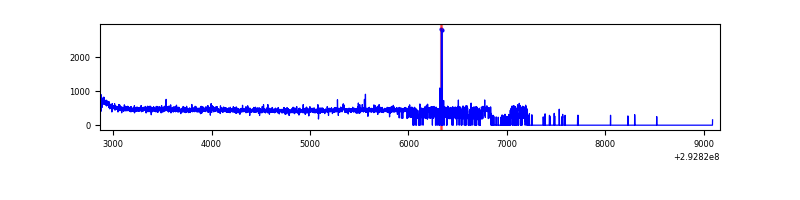 |
| D | 6296 | 4079 | 122 | 122 | 1.94% | 2.99% | 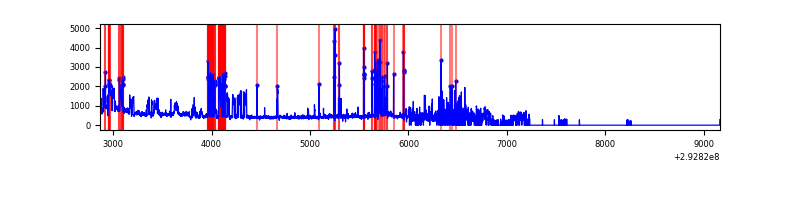 |
Top three noisy pixels from each quadrant. If the there are fewer than three noisy pixels in the level2.evt file, extra rows are filled as -1
| Pixel properties | Quadrant properties | ||||||
|---|---|---|---|---|---|---|---|
| Quadrant | DetID | PixID | Counts | Sigma | Mean | Median | Sigma |
| A | 0 | 226 | 3851 | 36.02 | 458 | 448 | 94.5 |
| A | 13 | 254 | 3467 | 31.95 | 458 | 448 | 94.5 |
| A | 3 | 137 | 3421 | 31.47 | 458 | 448 | 94.5 |
| B | 7 | 220 | 49691 | 563.41 | 450 | 439 | 87.4 |
| B | 6 | 36 | 24322 | 273.2 | 450 | 439 | 87.4 |
| B | 3 | 112 | 17399 | 194.01 | 450 | 439 | 87.4 |
| C | 14 | 238 | 67907 | 653.33 | 437 | 441 | 103.3 |
| C | 3 | 233 | 20446 | 193.72 | 437 | 441 | 103.3 |
| C | 0 | 207 | 9245 | 85.26 | 437 | 441 | 103.3 |
| D | 1 | 52 | 843527 | 7952.94 | 429 | 416 | 106.0 |
| D | 11 | 176 | 113341 | 1065.2 | 429 | 416 | 106.0 |
| D | 12 | 233 | 32633 | 303.9 | 429 | 416 | 106.0 |
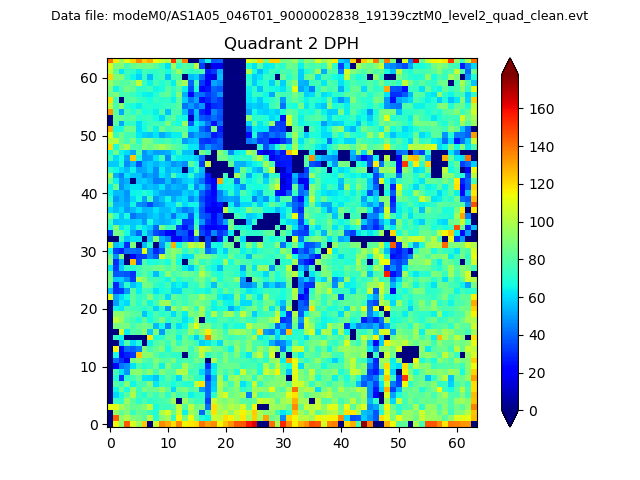
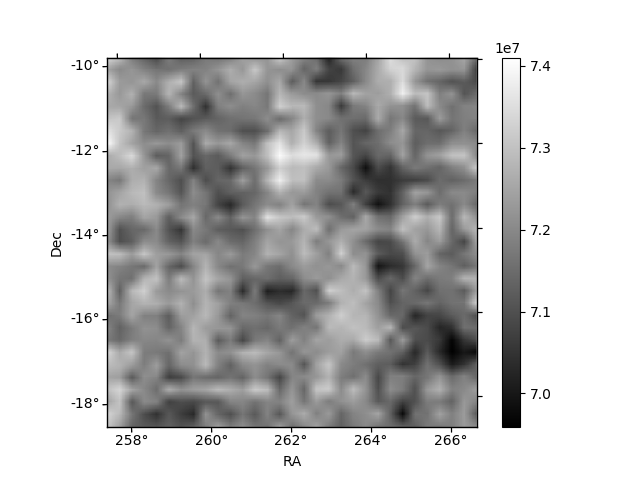
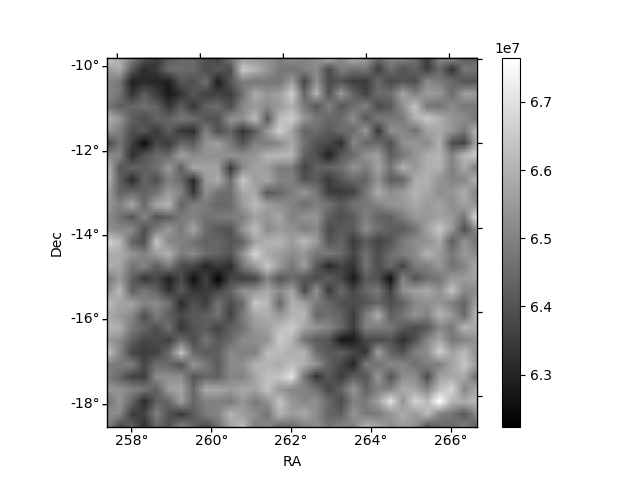
Histogram calculated using DETX and DETY for each event in the final _common_clean file
| Quadrant A | 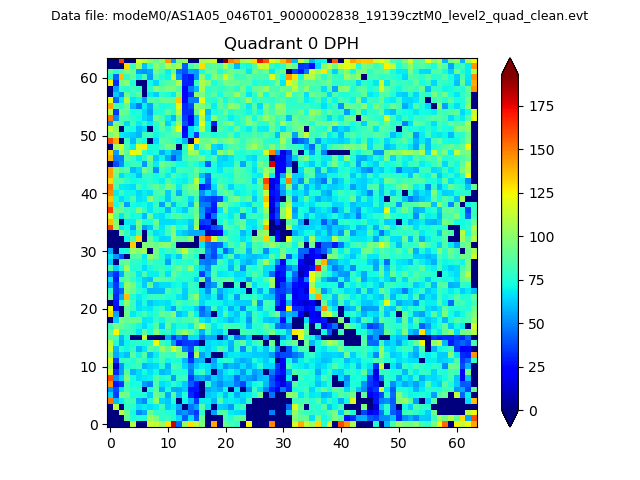 |
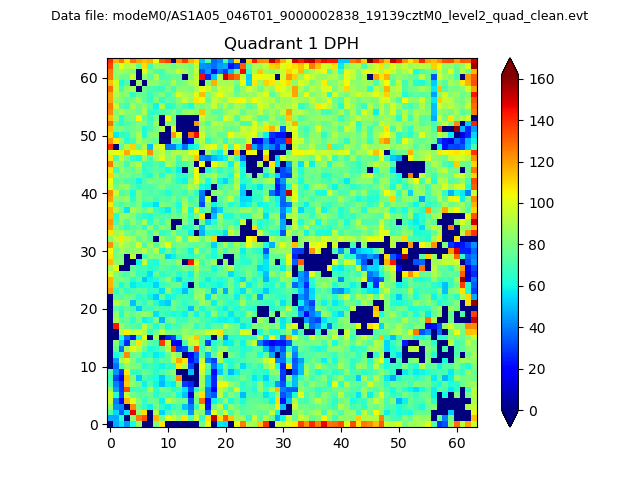 |
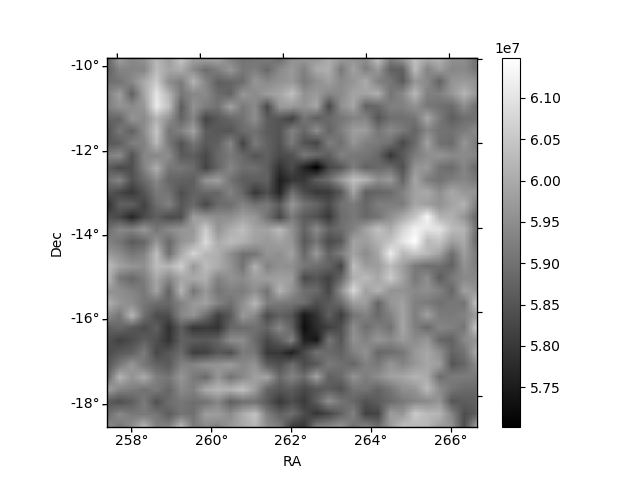
Quadrant B |
|---|---|---|---|
| Quadrant D | 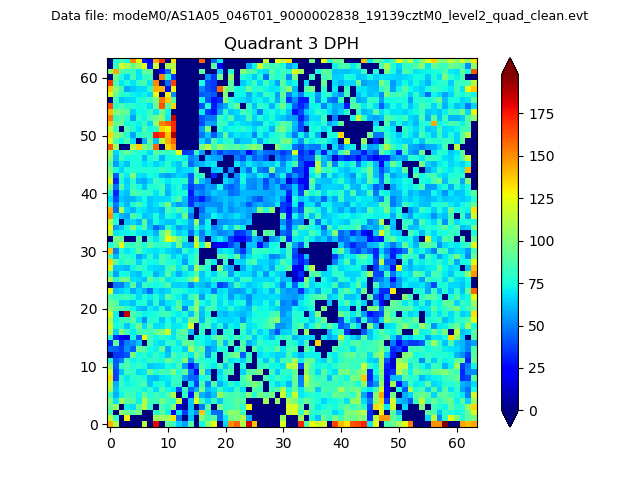 |
 |
Quadrant C |
| Plot type | Count rate plots | Images |
|---|---|---|
| Comparison with Poisson distribution Blue bars denote a histogram of data divided into 1 sec bins. Red curve is a Poisson curve with rate = median count rate of data. |
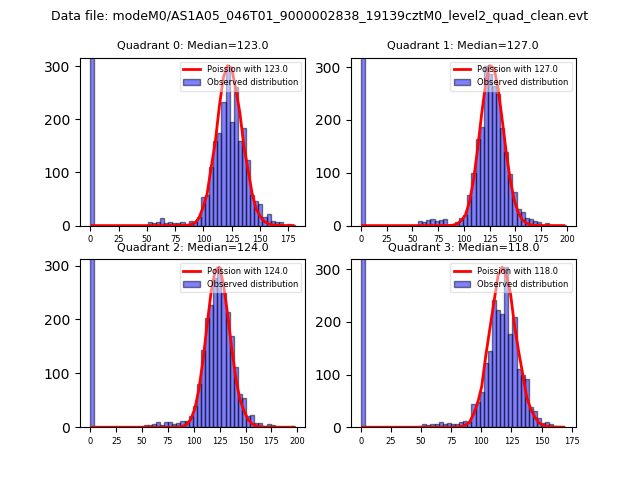 |
 |
| Quadrant-wise count rates Data is divided into 100 sec bins |
 |
|
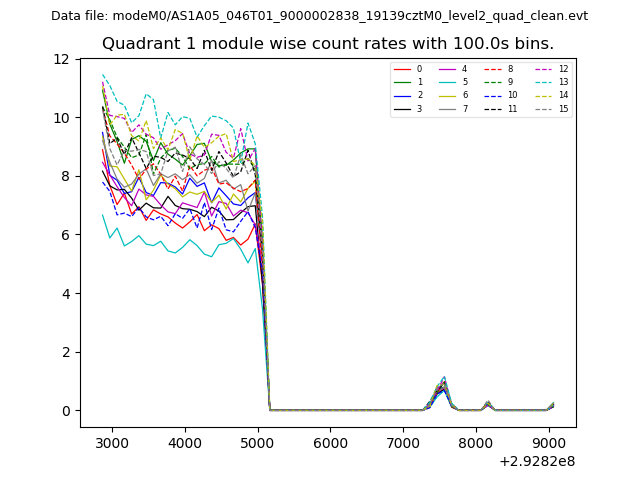
| Module-wise count rates for Quadrant A Data is divided into 100 sec bins |
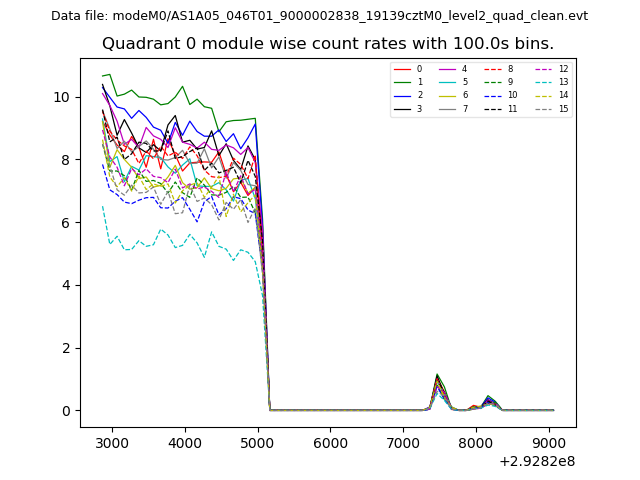 |
 |
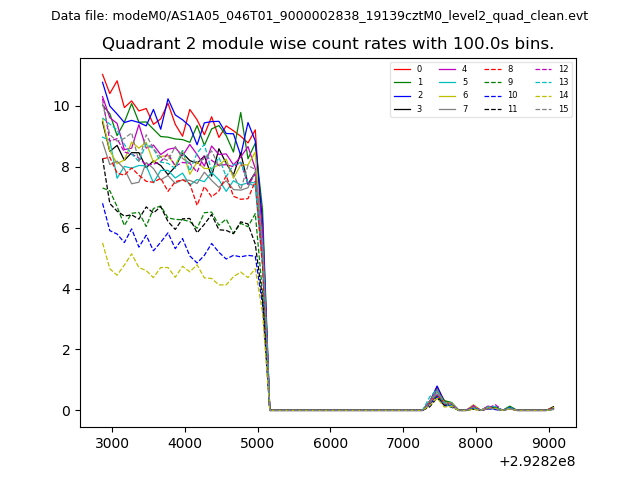
| Module-wise count rates for Quadrant B Data is divided into 100 sec bins |
 |
 |
| Module-wise count rates for Quadrant C Data is divided into 100 sec bins |
 |
 |
| Module-wise count rates for Quadrant D Data is divided into 100 sec bins |
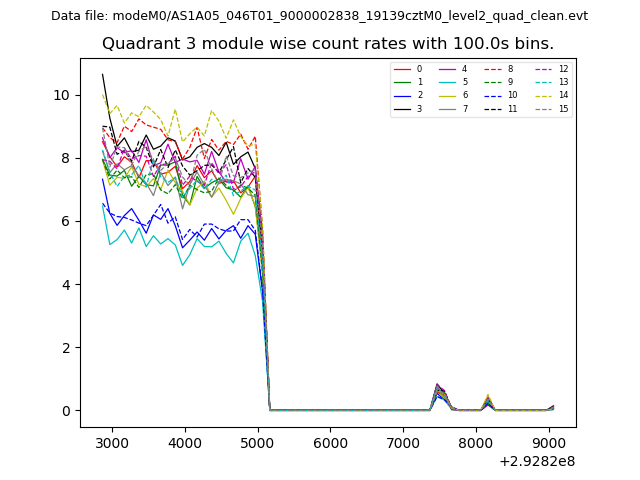 |
 |
| Parameter | Plot |
|---|---|
| CZT HV Monitor | 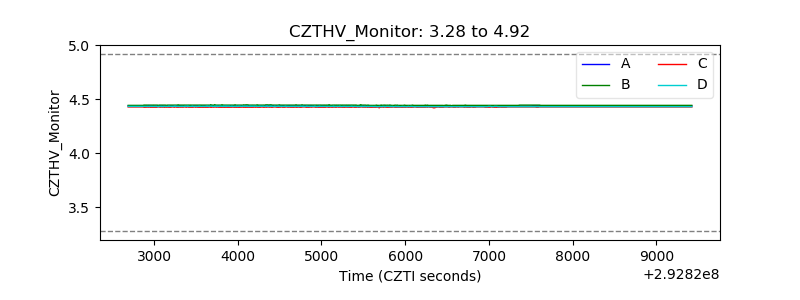 |
| D_VDD | 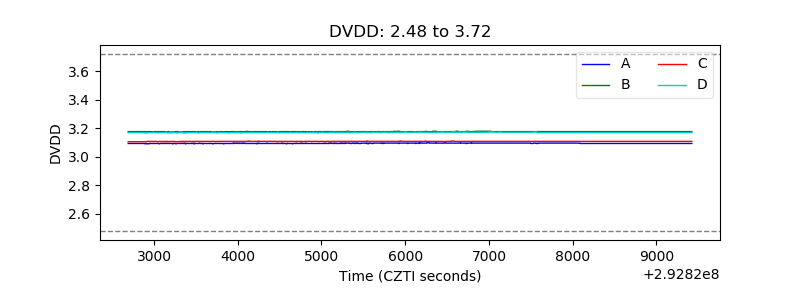 |
| Temperature 1 | 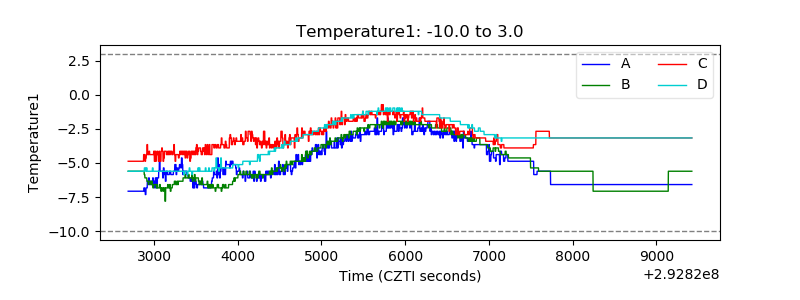 |
| Veto HV Monitor | 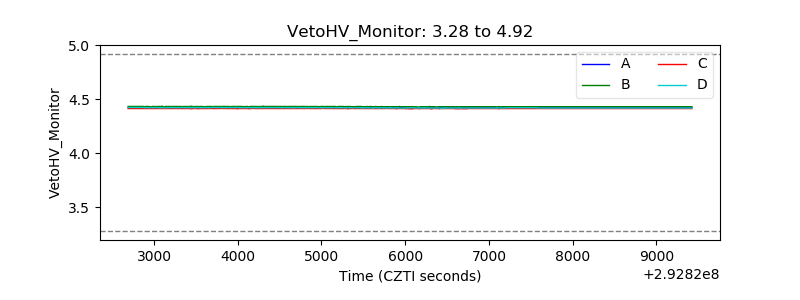 |
| Veto LLD | 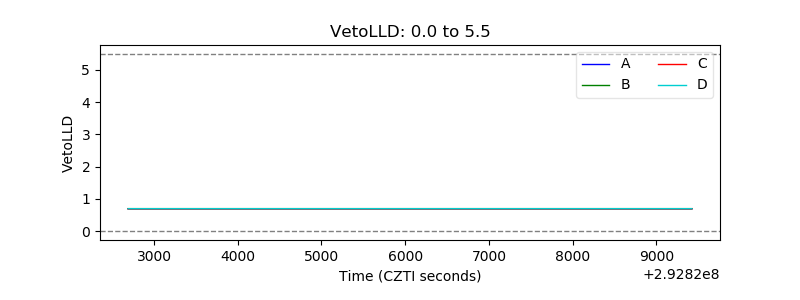 |
| Alpha Counter |  |
| _CPM_Rate | 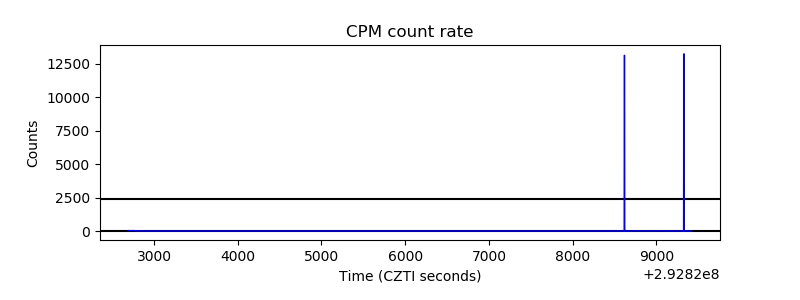 |
| CZT Counter | 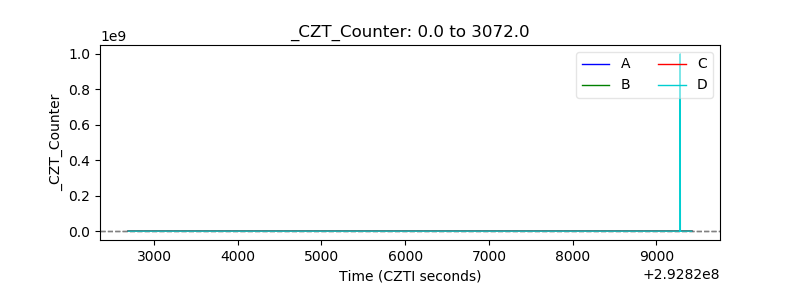 |
| +2.5 Volts monitor |  |
| +5 Volts monitor |  |
| _ROLL_ROT | 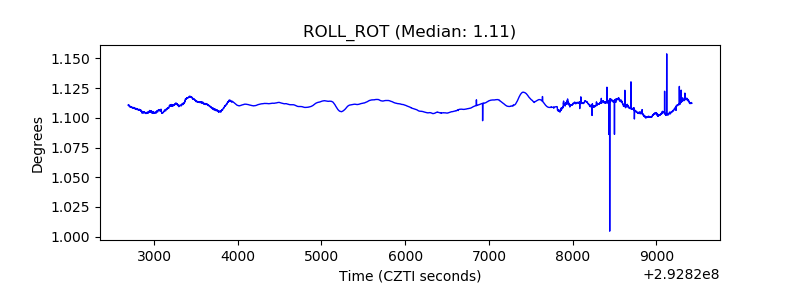 |
| _Roll_DEC | 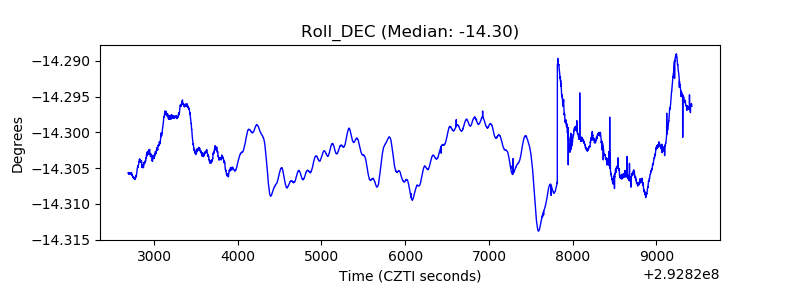 |
| _Roll_RA | 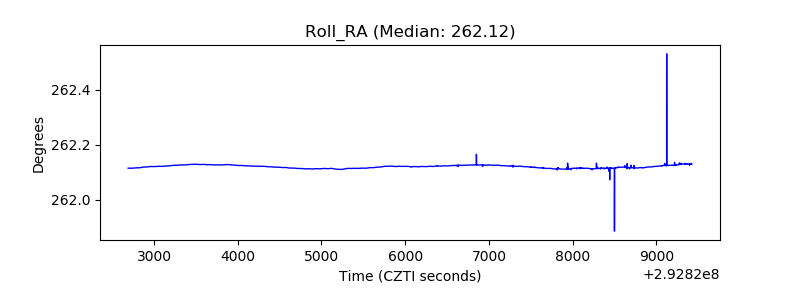 |
| Veto Counter |  |