| Param | Original file | Final file |
|---|---|---|
| Filename | modeM0/AS1A05_046T01_9000002838_19143cztM0_level2.evt | modeM0/AS1A05_046T01_9000002838_19143cztM0_level2_quad_clean.evt |
| Size (bytes) | 945,429,120 | 143,550,720 |
| Size | 901.6 MB | 136.9 MB |
| Events in quadrant A | 6,057,941 | 867,786 |
| Events in quadrant B | 7,650,645 | 889,690 |
| Events in quadrant C | 7,069,096 | 859,728 |
| Events in quadrant D | 6,979,111 | 835,587 |
| Mode M0 | |||
|---|---|---|---|
| Quadrant | BADHDUFLAG | Total packets | Discarded packets |
| A | 0 | 26525 | 3 |
| B | 0 | 31019 | 3 |
| C | 0 | 29324 | 3 |
| D | 0 | 29389 | 3 |
| Mode SS | |||
|---|---|---|---|
| Quadrant | BADHDUFLAG | Total packets | Discarded packets |
| A | 0 | 264 | 0 |
| B | 0 | 264 | 0 |
| C | 0 | 264 | 0 |
| D | 0 | 264 | 0 |
| Mode M9 | |||
|---|---|---|---|
| Quadrant | BADHDUFLAG | Total packets | Discarded packets |
| A | 0 | 16 | 0 |
| B | 0 | 16 | 0 |
| C | 0 | 16 | 0 |
| D | 0 | 16 | 0 |
| Quadrant | Total seconds | Saturated seconds | Saturation percentage |
|---|---|---|---|
| A | 12943 | 209 | 1.614772% |
| B | 12943 | 561 | 4.334389% |
| C | 12944 | 277 | 2.139988% |
| D | 12944 | 428 | 3.306551% |
Noise dominated data is calculated using 1-second bins in cleaned event files. If a bin has >2000 counts, and if more than 50% of those come from <1% of pixels, then it is considered to be noise-dominated and hence unusable.
| Quadrant | # 1 sec bins | Bins with >0 counts | Bins with >2000 counts | High rate bins dominated by noise | Noise dominated (total time) | Noise dominated (detector-on time) | Marked lightcurve |
|---|---|---|---|---|---|---|---|
| A | 14548 | 12943 | 0 | 0 | 0.00% | 0.00% | 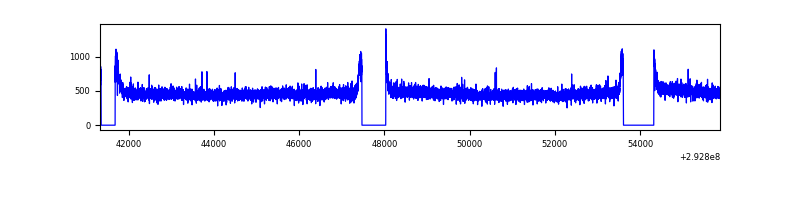 |
| B | 14548 | 12945 | 240 | 240 | 1.65% | 1.85% | 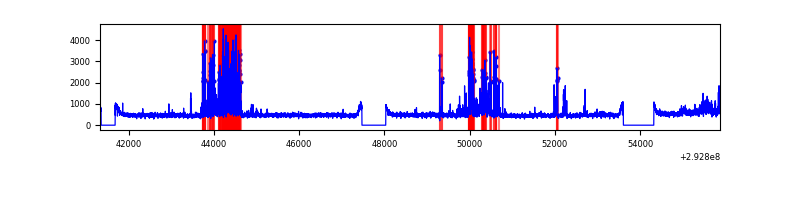 |
| C | 14549 | 12947 | 18 | 18 | 0.12% | 0.14% | 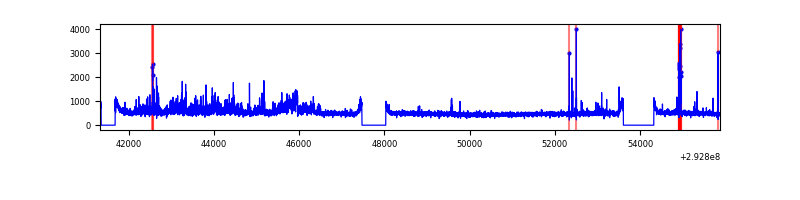 |
| D | 14549 | 12946 | 215 | 215 | 1.48% | 1.66% | 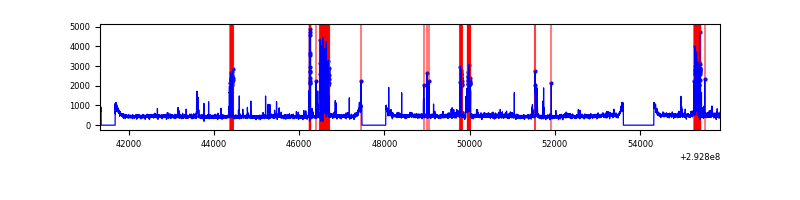 |
Top three noisy pixels from each quadrant. If the there are fewer than three noisy pixels in the level2.evt file, extra rows are filled as -1
| Pixel properties | Quadrant properties | ||||||
|---|---|---|---|---|---|---|---|
| Quadrant | DetID | PixID | Counts | Sigma | Mean | Median | Sigma |
| A | 13 | 254 | 15196 | 42.69 | 1569 | 1531 | 320.1 |
| A | 0 | 226 | 13604 | 37.72 | 1569 | 1531 | 320.1 |
| A | 3 | 137 | 12472 | 34.18 | 1569 | 1531 | 320.1 |
| B | 6 | 36 | 1039475 | 3480.37 | 1551 | 1511 | 298.2 |
| B | 7 | 220 | 270019 | 900.33 | 1551 | 1511 | 298.2 |
| B | 3 | 64 | 199121 | 662.6 | 1551 | 1511 | 298.2 |
| C | 3 | 233 | 866163 | 2427.76 | 1512 | 1520 | 356.1 |
| C | 14 | 238 | 230467 | 642.84 | 1512 | 1520 | 356.1 |
| C | 0 | 207 | 80085 | 220.6 | 1512 | 1520 | 356.1 |
| D | 1 | 52 | 1119652 | 2983.66 | 1528 | 1482 | 374.8 |
| D | 2 | 234 | 55395 | 143.86 | 1528 | 1482 | 374.8 |
| D | 7 | 238 | 44080 | 113.67 | 1528 | 1482 | 374.8 |
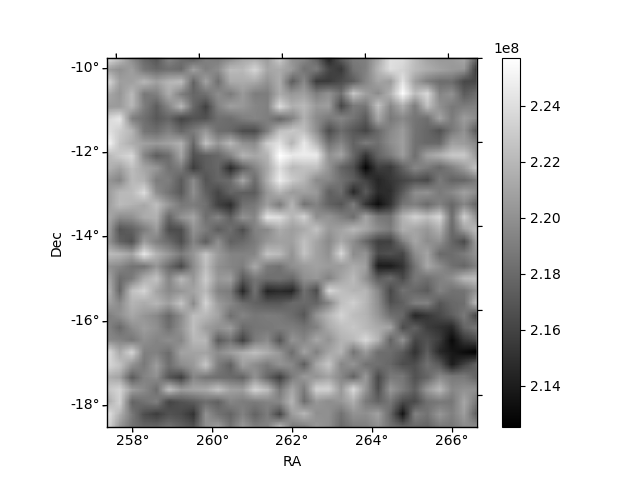
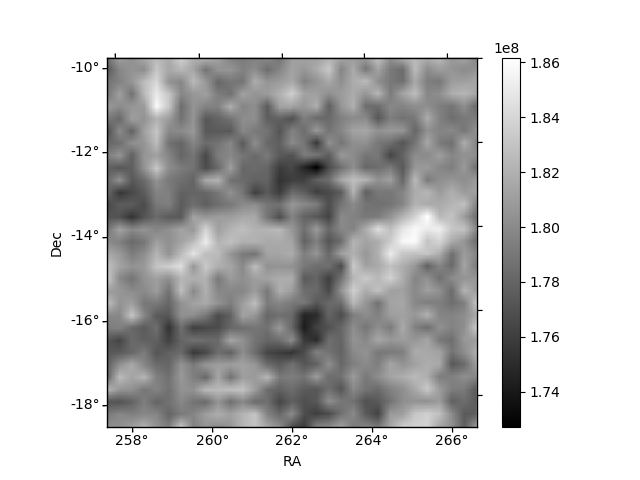
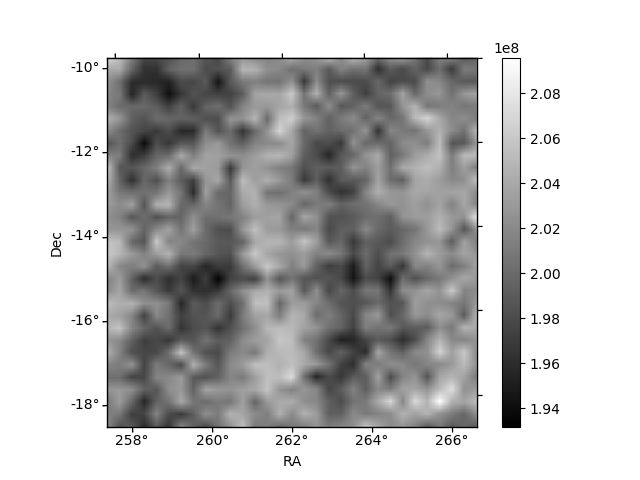
Histogram calculated using DETX and DETY for each event in the final _common_clean file
| Quadrant A | 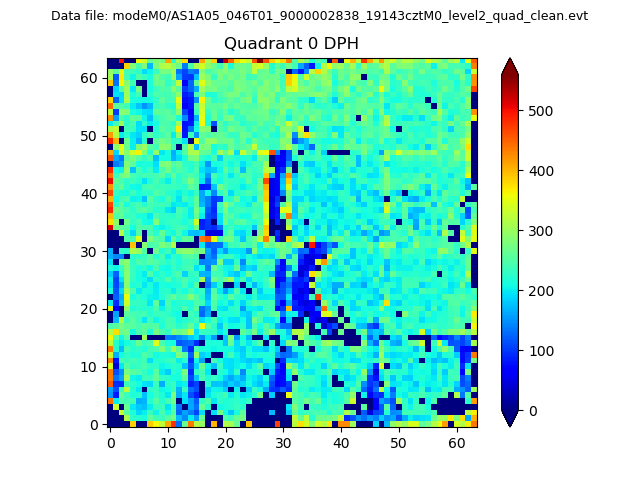 |
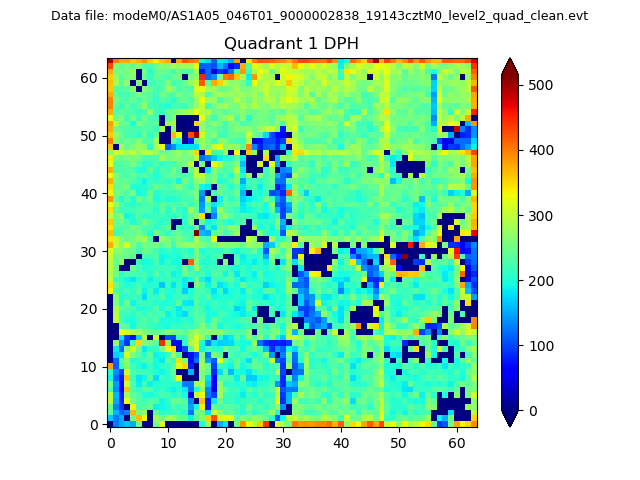 |
Quadrant B |
|---|---|---|---|
| Quadrant D | 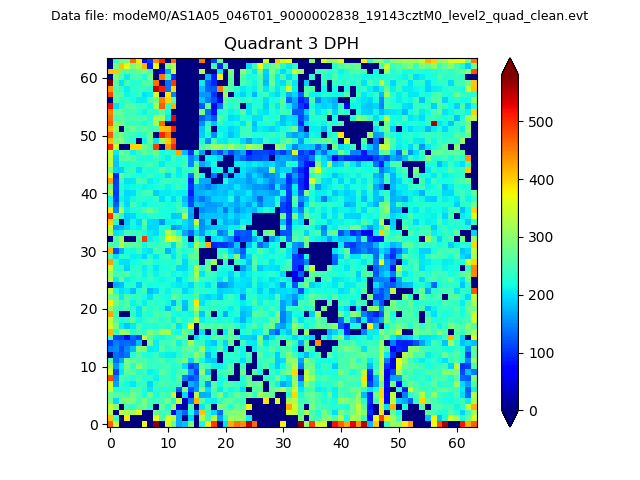 |
 |
Quadrant C |
| Plot type | Count rate plots | Images |
|---|---|---|
| Comparison with Poisson distribution Blue bars denote a histogram of data divided into 1 sec bins. Red curve is a Poisson curve with rate = median count rate of data. |
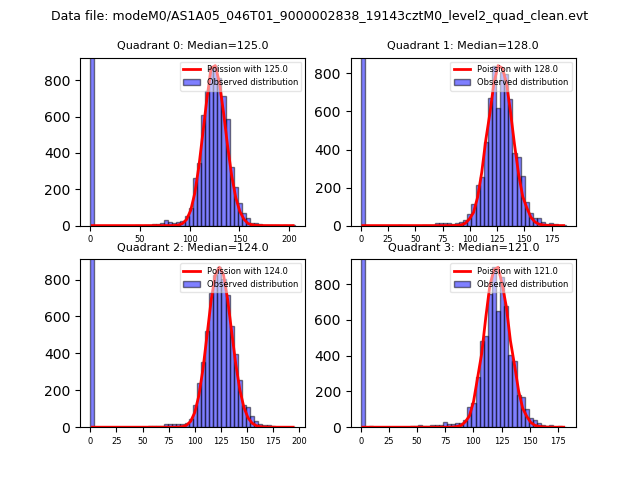 |
 |
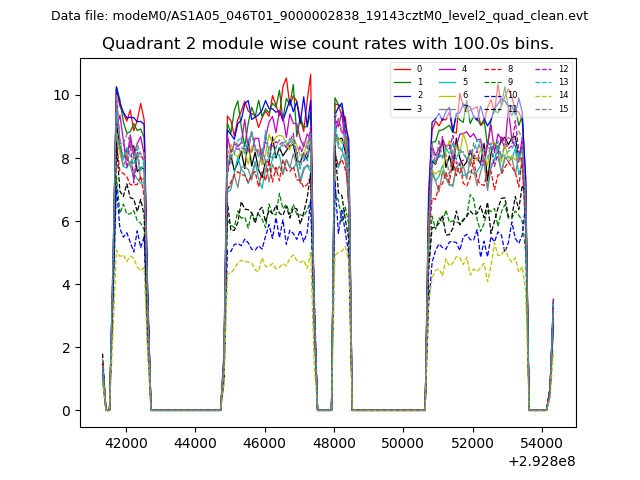
| Quadrant-wise count rates Data is divided into 100 sec bins |
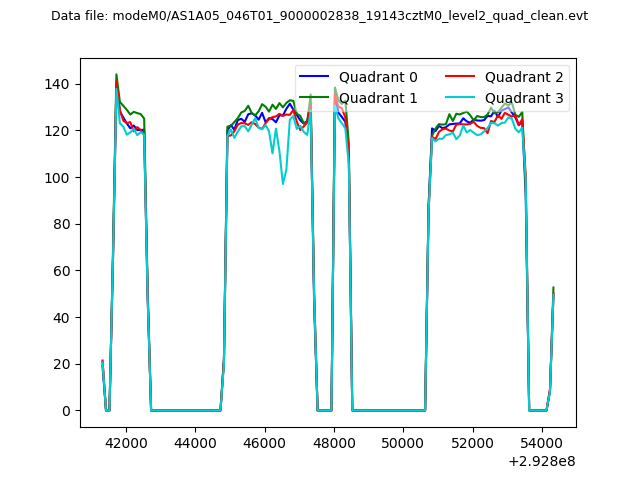 |
|
| Module-wise count rates for Quadrant A Data is divided into 100 sec bins |
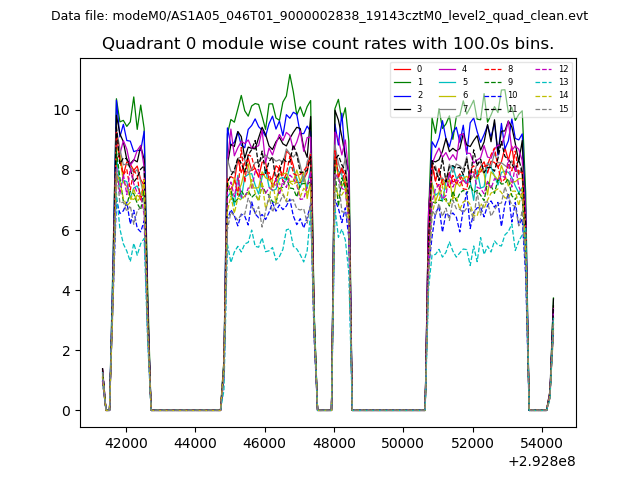 |
 |
| Module-wise count rates for Quadrant B Data is divided into 100 sec bins |
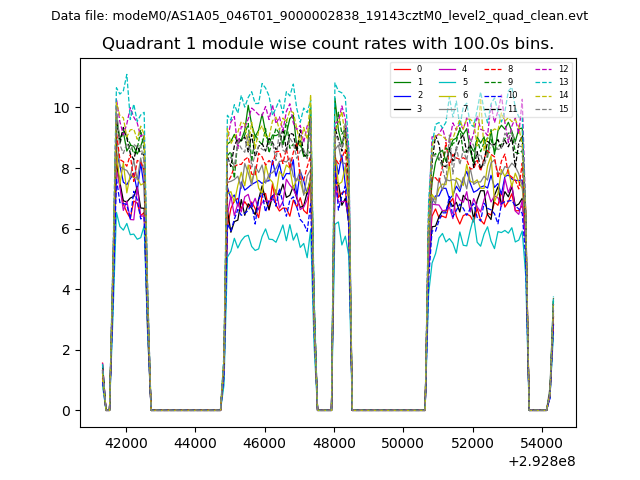 |
 |
| Module-wise count rates for Quadrant C Data is divided into 100 sec bins |
 |
 |
| Module-wise count rates for Quadrant D Data is divided into 100 sec bins |
 |
 |
| Parameter | Plot |
|---|---|
| CZT HV Monitor | 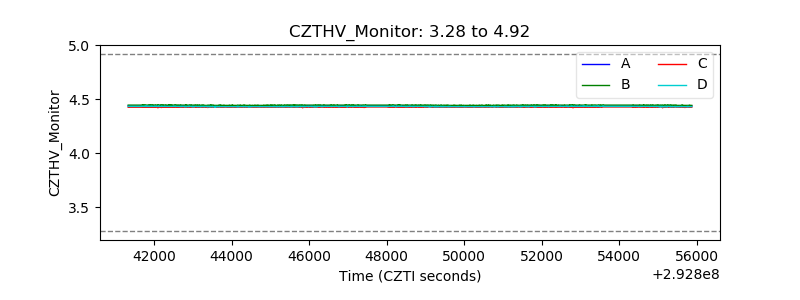 |
| D_VDD | 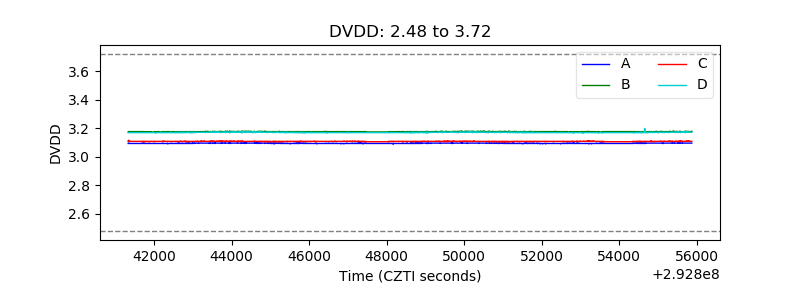 |
| Temperature 1 | 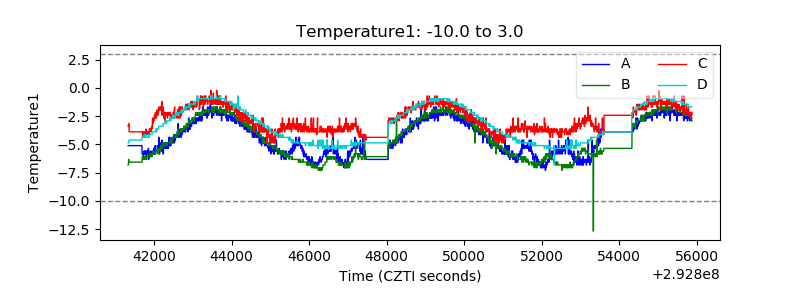 |
| Veto HV Monitor | 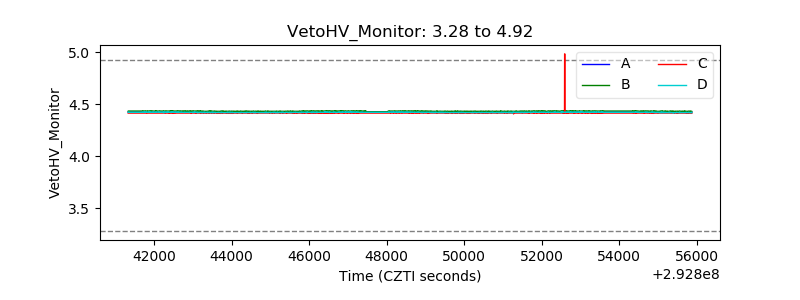 |
| Veto LLD | 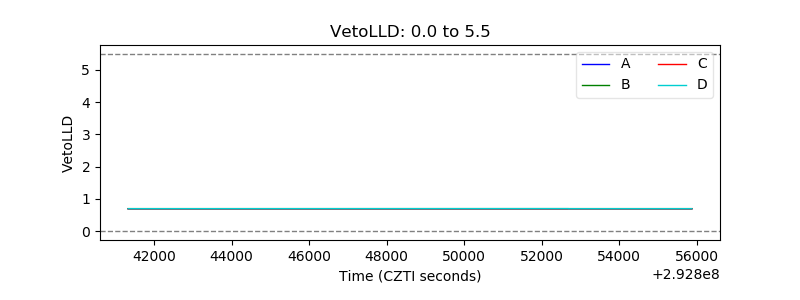 |
| Alpha Counter | 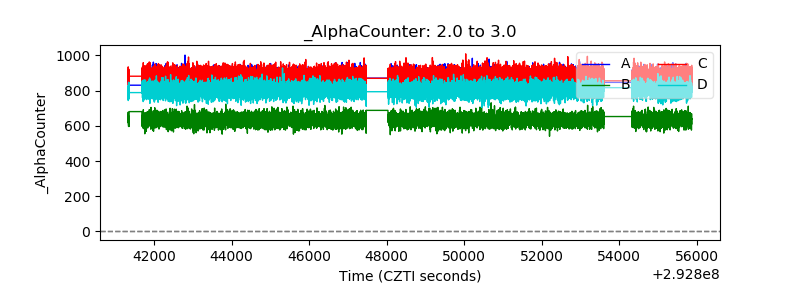 |
| _CPM_Rate | 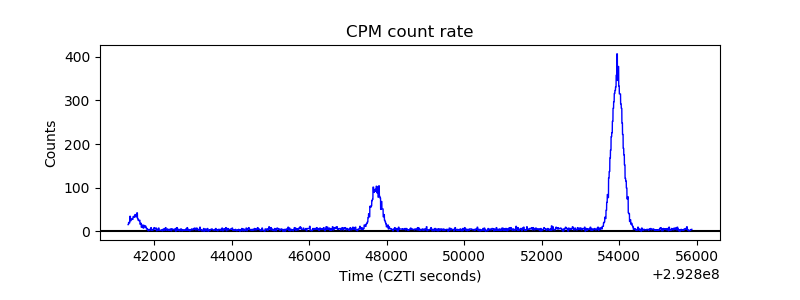 |
| CZT Counter |  |
| +2.5 Volts monitor |  |
| +5 Volts monitor |  |
| _ROLL_ROT |  |
| _Roll_DEC |  |
| _Roll_RA |  |
| Veto Counter | 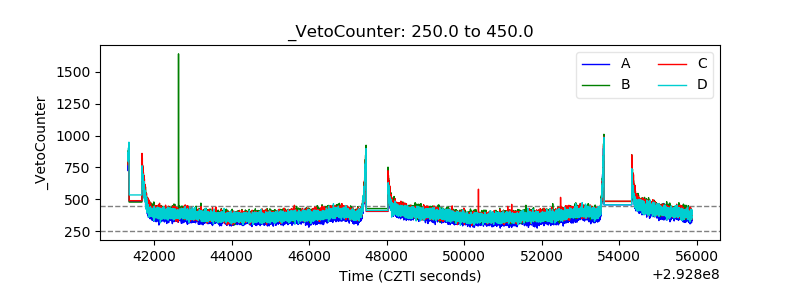 |